
PUBLISHER: Marketstrat, Inc. | PRODUCT CODE: 1892159

PUBLISHER: Marketstrat, Inc. | PRODUCT CODE: 1892159
Global Oncology Imaging AI Market Pulse 2025-2032 Size, Mix and Momentum
The global Oncology Imaging AI market is forecast to grow from US$604.7M in 2023 to US$7.74B by 2032 (32.7% CAGR)-making oncology one of the fastest-scaling categories inside medical imaging AI and a leading indicator for where enterprise buyers will place their next AI budgets.
Overview
Global Oncology Imaging AI Market Pulse 2025-2032: Size, Mix & Momentum is Marketstrat's world-market sizing and forecasting report for AI in cancer imaging-covering how demand is shifting across regions, modalities (CT, mammography/DBT, MRI, PET/Nuclear, ultrasound), clinical applications, tumor sites, care pathway stages, end-use settings, and revenue models.
This Pulse is built for teams who want a clean, quantitative global view-without needing to navigate a full multi-hundred-page Horizon program. It delivers a fast, decision-grade answer to:
- How big is the global oncology imaging AI market today-and where will it be by 2032?
- Where is the mix of spend concentrated (the "big pools")?
- Where will incremental dollars accrue (the "fast pools" and "growth contribution" lanes)?
- How do monetization models shift (software vs services vs cloud/usage-based)?
Market expands from US$604.7M (2023) to US$7.74B (2032) at a 32.7% CAGR, driven primarily by attach-rate expansion and workflow adoption, not scanner unit growth.
Key Market Trends (what's changing)
1. From "point AI" to pathway adoption
Oncology imaging AI is shifting from single-task CAD toward pathway-wide workflows-screening, detection, staging, treatment planning (including RT), response assessment, and surveillance-where standardized measurement becomes a clinical and economic requirement.
2. Screening programs anchor predictable AI volumes
Breast screening (mammography/DBT) and LDCT lung screening continue to expand and industrialize, increasing demand for AI that supports triage, QA, second reads, and program operations at scale.
3. Measurement-grade quantification becomes the value center
Across MRI (prostate/liver), CT (lung pathways), and PET/Nuclear (theranostics), growth increasingly concentrates in quantification, analytics, and structured reporting-tools that make cancer imaging more reproducible and operationally scalable.
4. Premium pools rise in MRI and PET/Nuclear (high ARPU lanes)
MRI is the fastest-growing major modality, and PET/Nuclear grows as a high-value niche as therapy-linked imaging (including theranostics) expands demand for quantification and dosimetry-oriented AI.
5. Monetization shifts toward software + usage + lifecycle services
Software remains the core revenue engine, while cloud/usage-based (PPU) models accelerate in high-volume workflows (screening hubs, teleradiology, and enterprise multi-site networks). Services expand alongside validation, monitoring, and governance requirements.
Competitive Snapshot (commercial reality, not market shares)
This Global Pulse focuses on how the market is captured-not vendor-by-vendor market shares. The report highlights the commercial rails that shape winners and pricing power across segments:
- OEM bundling and "default attach" economics in high-volume modalities and screening lanes
- Enterprise contracting and governance requirements in IDNs and cancer networks
- Marketplace/platform distribution that reduces deployment friction for multi-vendor portfolios
- Teleradiology and centralized reading hubs as catalysts for usage-based pricing and standardized QA
The following companies/divisions have been mentioned (not profiled): Aidoc; AIQ Solutions; Annalise.ai; Arterys; Bayer; Blackford; Calantic; Canon Medical; CARPL.ai; DeepHealth; Deepwise; Densitas; EXINI Diagnostics; Fujifilm; GE HealthCare; Hermes Medical Solutions; Hologic; Imbio; Incepto; Kheiron; Koios Medical; Lantheus; Lunit; Median Technologies; MIM Software; Mindray; Mirada Medical; MVision AI; Nuance; Oxipit; Perspectum; Philips; Ping An Healthcare; Quibim; Qure.ai; Rad AI; RadNet; RaySearch; Riverain; ScreenPoint; Sectra; Segami; Siemens Healthineers; Subtle Medical; Tempus; TheraPanacea; United Imaging; Vara; Varian
Sample Insights & Figures (what you'll be able to cite)
Inside this report, readers gain immediate answers to questions such as:
- Which regions are over- or under-indexed in specific modalities or pathway stages versus the global mix?
- Where is the largest dollar lift coming from-by modality, tumor site, pathway stage, and revenue stream?
- Which tumor-site x modality combinations create the most incremental dollars (e.g., breast x X-ray/DR, lung x CT, prostate x MRI)?
- Where are cloud/PPU models structurally advantaged versus traditional licensing?
This Pulse includes 41 figures and 36 tables, structured to be reusable in planning decks, investment briefs, and GTM prioritization.
What's Inside
- Executive Summary focused on global size, growth, and the few mix shifts that matter most
- Condensed Research Methodology (scope definition, segmentation compass, and forecast architecture)
- World Market Analysis (2023-2032) across:
- Region and selected country views
- Modality mix and growth contribution
- Clinical application mix and momentum
- Tumor-site mix and growth contribution
- Revenue streams (hardware, software, services, cloud/PPU)
- End-use organizations (IDNs/AMCs, cancer centers, community providers, teleradiology)
- Pathway stage dynamics (screening -> treatment planning/RT -> response/surveillance)
- Mix & Momentum matrices and cross-tabs (e.g., region x modality, tumor site x modality, pathway stage x revenue stream)
Why This Report
Global Oncology Imaging AI Market Pulse 2025-2032 is built for teams that need high-confidence sizing plus practical segmentation-the combination required to make real decisions:
- Portfolio and roadmap decisions: Which modalities and tumor sites are worth sustained investment?
- Market entry and sequencing: Where do you start (big pools) vs where do you place selective bets (fast pools)?
- Commercial strategy: How will revenue models evolve (license vs service vs usage), and where will pricing compress vs hold?
- Investor and diligence workflows: Which growth narratives are supported by global mix/momentum patterns rather than anecdote?
TABLE OF CONTENTS
SECTION 0 - HOW TO USE THIS GLOBAL MARKET PULSE
SECTION 1 - GOBAL MARKET SNAPSHOT (2023-2032)
SECTION 2 - EXECUTIVE SUMMARY
SECTION 3 - RESEARCH METHODOLOGY
SECTION 4 - WORLD MARKET FOR ONCOLOGY IMAGING AI
- 4.1 WORLD MARKET OVERVIEW
- Oncology Imaging AI: From Niche App to Enterprise Platform
- Why Adoption is Accelerating
- Regional Growth Snapshot (2023 -> 2032)
- Strategic Implications for Vendors
- Market Momentum & Outlook
- Oncology Imaging AI: From Niche App to Enterprise Platform
- 4.2 WORLD MARKET FORECAST BY REGION (2023-2032)
- 4.3 WORLD MARKET BY COUNTRY x END-USE ORG
- Estimate by Country x End-Use (USD Mill, 2023)
- Forecast by Country x End-Use (2032)
- Highlights (2032 Country Pattern vs World Mix)
- What's Shifting vs 2023 (Directional)
- Top Growth Cells (US$ M Lift, 2023->2032)
- What This Means (Commercial Playbook)
- Signals to Watch
- 4.4 WORLD MARKET BY MODALITY
- Highlights
- World Market by Modality (2023-32)
- Implications
- Market Math & Diffusion Pattern
- 2032 Mix and Key Growth Lenses
- Share Shift and Dollar Lift (2023 -> 2032)
- Competitive Landscape - by Modality
- Modality Deep-Dives (Oncology-specific)
- CT
- X-ray/DR (incl. Mammography)
- MRI
- PET/Nuclear
- Ultrasound
- Strategic Takeaways for Vendors (Oncology-specific)
- Signals to Watch (2025-2027)
- 4.5 WORLD MARKET BY CLINICAL APPLICATION
- Highlights
- World Market by Clinical Application (2023-32)
- What's Shifting
- Key Growth Lenses by Application
- Who Contributes the Growth (2023->2032 lift)
- What This Means
- Competitive Landscape - by Clinical Application
- Deep Dives by Clinical Application
- Detection & Diagnosis
- Quantification & Analytics
- Workflow & Orchestration
- Reporting & Communication
- Image Reconstruction & Acquisition
- Strategic Takeaways for Vendors
- Signals to Watch (2025-2027)
- 4.6 WORLD MARKET BY TUMOR SITE
- Highlights
- What's Shifting (Mix Dynamics)
- World Market by Tumor Site (2023-32)
- Growth Lenses - by Tumor Site
- What This Means
- What Shifts Through 2032
- Commercial Takeaways
- Competitive Landscape - by Tumor Site
- Deep Dives by Tumor Site
- Breast
- Lung/Chest
- Prostate
- Colorectal
- Liver
- Neuro-Oncology
- Gynecologic
- Head & Neck
- Other (Rare)
- Strategic Takeaways
- Signals to Watch (2025-2027)
- 4.7 WORLD MARKET BY REVENUE STREAM
- Highlights
- What's Shifting
- World Market by Revenue Stream (2023-32)
- Growth Lenses - by Revenue Stream
- Who Contributes the Growth (2023->2032 Dollar Lift)
- What This Means
- Deep Dives by Revenue Stream
- Hardware
- Software
- Service
- Cloud/PPU
- Competitive Landscape - by Revenue Stream
- Signals to Watch (2025-2027)
- 4.8 WORLD MARKET BY END-USE ORGANIZATION TYPE
- Highlights
- What's Shifting
- World Market by End-Use Organization (2023-32)
- Growth Lenses by End-use
- Who Contributes the Growth (2023->2032 Dollar Lift)
- What this Means
- Deep Dives
- Academic/IDNs
- Comprehensive Cancer Centers
- Community Hospitals & Imaging Centers
- Teleradiology Providers
- Competitive Landscape - by End-Use
- Signals to Watch (2025-2027)
- 4.9 WORLD MARKET BY AI TECHNOLOGY
- Highlights
- What's Shifting
- World Market by AI Technology (2023-32)
- Growth Lenses - by AI Technology
- Who Contributes the Growth (2023->2032 Dollar Lift)
- What This Means
- Deep Dives by AI Technology (Oncology Lens)
- Competitive Landscape - by AI Technology
- Signals to Watch (2025-2027)
- 4.10 WORLD MARKET BY PATHWAY STAGE
- Highlights
- What's Shifting
- World Market by Pathway Stage (2023-32)
- Growth Lenses - by Pathway Stage
- Who Contributes the Growth (2023->2032 Dollar Lift)
- What This Means
- Competitive Landscape - by Pathway Stage
- Signals to Watch (2025-2027)
- HOW TO INTERPRET "MIX & MOMENTUM" MATRICES
- 4.11 REGIONAL MIX & MOMENTUM - WORLD ONCOLOGY IMAGING AI
- Executive Takeaways
- Marke by Region x Modality
- World Market by Region x Modality - 2023
- World Market by Region x Modality - 2032
- What's Shifting (Mix, 2032 Over/Under-index)
- Who Contributes the Growth (2023->2032 Lift)
- What This Means
- Market by Region x Revenue Stream
- World Market by Region x Revenue Stream - 2023
- World Market by Region x Revenue Stream - 2032
- What's Shifting (Mix, 2032 Over/Under Index)
- Who Contributes the Growth
- What This Means
- Market by Region x Clinical Application
- World Market by Region x Clinical Application - 2023
- World Market by Region x Clinical Application - 2032
- What's Shifting (Mix, 2032 Over/Under Index)
- Who Contributes the Growth
- What this Means
- Competitive Snapshots (Illustrative)
- 4.12 DISEASE-DRIVEN DEMAND MAP - WORLD ONCOLOGY IMAGING AI
- Executive Takeaways
- Tumor Site x Modality
- World Market by Tumor Site x Modality - 2023
- World Market by Tumor Site x Modality - 2032
- What's Shifting (2032 Mix vs Global)
- Who Contributes the Growth (2023->2032 Dollar Lift)
- What This Means
- Tumor Site x Clinical Application
- World Market by Tumor Site x Clinical Application - 2023
- What's Shifting (2032 Mix vs Global)
- World Market by Tumor Site x Clinical Application - 2032
- Who Contributes the Growth (2023->2032 Dollar Lift)
- What this means
- Tumor Site x Revenue Stream
- World Market by Tumor Site x Revenue Stream - 2023
- World Market by Tumor Site x Revenue Stream - 2032
- What's Shifting (2032 mix vs global)
- Who Contributes the Growth (2023->2032 Dollar lift)
- What This Means
- Competitive Snapshot (Illustrative, Oncology-focused)
- Signals to Watch
- 4.13 WORKFLOW ECONOMICS - WORLD ONCOLOGY IMAGING AI
- Modality x Revenue Stream
- World Market by Modality x Revenue Stream - 2023
- World Market by Modality x Revenue Stream - 20232
- Highlights
- What's Shifting (Mix & Over/Under-Index)
- Who Contributes the Growth (2023->2032 Dollar Lift)
- What This Means (Commercial Playbook)
- Competitive Lens (Illustrative)
- Clinical Application x Revenue Stream
- Highlights (2032 Pattern)
- World Market by Clinical Application x Revenue Stream - 2023
- World Market by Clinical Application x Revenue Stream - 2032
- What's Shifting (2023 -> 2032)
- Who Contributes the Growth (US$ M lift, 2023->2032)
- What This Means (Commercial Playbook by Application)
- Competitive Lens (Indicative, Non-exhaustive)
- Pricing Archetypes That Clear Approvals (What Buyers Say "Yes" to)
- Signals to Watch
- Risks & Watchouts
- Modality x Revenue Stream
- 4.14 PATHWAY STAGE ECONOMICS - WORLD ONCOLOGY IMAGING AI
- Pathway Stage x Revenue Stream
- Highlights
- World Market by Pathway Stage x Revenue Stream - 2023
- World Market by Pathway Stage x Revenue Stream - 2032
- What's Shifting (Mix vs Global)
- Who Contributes the Growth (2023 -> 2032 Dollar Lift)
- What This Means (Commercial Playbook)
- Competitive Lens (Indicative)
- Signals to Watch
- Pathway Stage x Modality - Where Each Stage Leans and Why
- World Market by Pathway Stage x Modality - 2023
- World Market by Pathway Stage x Modality - 2032
- Highlights (2032 Pattern vs World Mix)
- Where the Dollars Moved (2023 -> 2032)
- Stage-specific Readouts (2032 Shares Inside Each Stage)
- What This Means (Commercial Takeaways)
- Competitive Lens (Illustrative, not Exhaustive)
- Signals to Watch
- Pathway Stage x Clinical Application - How Workloads Drive Spend
- World Market by Pathway Stage x Clinical Application - 2023
- World Market by Pathway Stage x Clinical Application - 2032
- Highlights (2032 Pattern vs World Mix)
- Where the Dollars Moved (2023 -> 2032)
- What This Means (Commercial Playbook)
- Competitive Lens (Indicative)
- Signals to Watch
- Pathway Stage x End-use - Who Buys What, and Where Growth Concentrates
- World Context (2032 End-use Mix)
- World Market by Pathway Stage x End-use - 2023
- World Market by Pathway Stage x End-use - 2032
- Highlights (2032 Pattern vs Global Mix)
- Who Contributes the Growth (US$ M lift 2023->2032)
- What This Means (Commercial Playbook by Stage)
- Competitive Lens (Indicative, Non-exhaustive)
- Signals to Watch
- Pathway Stage x AI Technology - How Capability Mix Shifts Across the Cancer Pathway
- World Tech Mix
- World Market for Pathway Stage x AI Technology - 2023
- World Market for Pathway Stage x AI Technology - 2032
- Highlights (2032 Pattern vs Global Mix)
- Where the Dollars Moved (2023 -> 2032)
- What This Means (Commercial Playbook)
- Competitive Lens (indicative)
- Signals to Watch
- Pathway Stage x Revenue Stream
List of Tables
- Table 1: World Market for AI in Oncology Imaging by Region (2023-2032, USD Million)
- Table 2: World Market for Oncology Imaging AI by Country x End-Use Org (2023)
- Table 3: World Market for Oncology Imaging AI by Country x End-Use Org (2032)
- Table 4: World Market for Oncology Imaging AI by Modality (USD Mill, 2023-32)
- Table 5: World Market for Oncology Imaging AI by Clinical Application (USD Mill, 2023-32)
- Table 6: World Market for Oncology Imaging AI by Tumor Site (USD Mill, 2023-32)
- Table 7: World Market for Oncology Imaging AI by Revenue Stream (USD Mill, 2023-32)
- Table 8: World Market for Oncology Imaging AI by End-Use Org (USD Mill, 2023-32)
- Table 9: World Market for Oncology Imaging AI by Technology (USD Mill, 2023-32)
- Table 10: World Market for Oncology Imaging AI by Pathway Stage (USD Mill, 2023-32)
- Table 11: World Market for Oncology Imaging AI by Region x Modality (USD Mill, 2023)
- Table 12: World Market for Oncology Imaging AI by Region x Modality (USD Mill, 2032)
- Table 13: World Market for Oncology Imaging AI by Region x Revenue Stream (USD Mill, 2023)
- Table 14: World Market for Oncology Imaging AI by Region x Revenue Stream (USD Mill, 2032)
- Table 15: World Market for Oncology Imaging AI by Region x Clinical Application (USD Mill, 2023)
- Table 16: World Market for Oncology Imaging AI by Region x Clinical Application (USD Mill, 2032)
- Table 17: World Market for Oncology Imaging AI by Tumor Site x Modality (USD Mill, 2023)
- Table 18: World Market for Oncology Imaging AI by Tumor Site x Modality (USD Mill, 2032)
- Table 19: World Market for Oncology Imaging AI by Tumor Site x Clinical Application (USD Mill, 2023)
- Table 20: World Market for Oncology Imaging AI by Tumor Site x Clinical Application (USD Mill, 2032)
- Table 21: World Market for Oncology Imaging AI by Tumor Site x Revenue Stream (USD Mill, 2023)
- Table 22: World Market for Oncology Imaging AI by Tumor Site x Revenue Stream (USD Mill, 2032)
- Table 23: World Market for Oncology Imaging AI by Modality x Revenue Stream (2023)
- Table 24: World Market for Oncology Imaging AI by Modality X Revenue Stream (2032)
- Table 25: World Market for Oncology Imaging AI by Clinical Application x Revenue Stream (2023)
- Table 26: World Market for Oncology Imaging AI by Clinical Application x Revenue Stream (2032)
- Table 27: World Market for Oncology Imaging AI - By Pathway Stage X Revenue Stream (USD Mill, 2023)
- Table 28: World Market for Oncology Imaging AI - By Pathway Stage X Revenue Stream (USD Mill, 2032)
- Table 29: World Market for Oncology Imaging AI - By Pathway Stage X Modality (USD Mill, 2023)
- Table 30: World Market for Oncology Imaging AI - By Pathway Stage X Modality (USD Mill, 2032)
- Table 31: World Market for Oncology Imaging AI by Pathway Stage x Clinical Application (USD Mill, 2023)
- Table 32: World Market for Oncology Imaging AI by Pathway Stage x Clinical Application (USD Mill, 2032)
- Table 33: World Market for Oncology Imaging AI by Pathway Stage x End-use Org (USD Mill, 2023)
- Table 34: World Market for Oncology Imaging AI by Pathway Stage x End-use Org (USD Mill, 2032)
- Table 35: World Market for Oncology Imaging AI by Pathway Stage x AI Technology (USD Mill, 2023)
- Table 36: World Market for Oncology Imaging AI by Pathway Stage x AI Technology (USD Mill, 2032)
List of Figures
- Figure 1: Global Oncology Imaging AI - Country x End-Use Org (2032 Market Size and Index vs. Global Mix)
- Figure 2: Global Oncology Imaging AI - Country x End-Use (Dollar Lift 2023 to 2032)
- Figure 3: Global Oncology Imaging AI Market by Modality: 2023 vs. 2
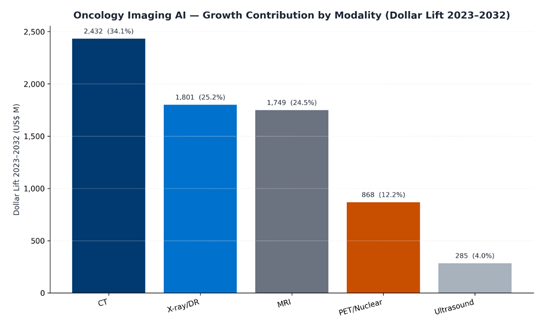
- Figure 4: Global Oncology Imaging AI Growth Contribution by Modality: Dollar Lift 2023 to 2
- Figure 5: Global Oncology Imaging AI Market by Clinical Application: 2023 vs. 2
- Figure 6: Global Oncology Imaging AI Growth Contribution by Clinical Application: Dollar Lift 2023 to 2
- Figure 7: Global Oncology Imaging AI Growth Contribution by Tumor Site: Dollar Lift 2023 to 2
- Figure 8: Global Oncology Imaging AI Growth Contribution by Tumor Site: Dollar Lift 2023 to 2
- Figure 9: Global Oncology Imaging Growth Contribution by Revenue Stream: Dollar Lift 2023 to 2
- Figure 10: Global Oncology Imaging Market by End-Use Org: 2023 vs. 2
- Figure 11: Global Oncology Imaging Growth Contribution by End-Use Org: Dollar Lift 2023 to 2
- Figure 12: Global Oncology Imaging Market by AI Technology: 2023 vs. 2
- Figure 13: World Market for Oncology Imaging AI by Technology (USD Mill, 2023-32)
- Figure 14: Global Oncology Imaging Market by Pathway Stage: 2023 vs. 2
- Figure 15: Global Oncology Imaging AI Growth Contribution by Pathway Stage: Dollar Lift 2023 to 2
- Figure 16: Global Oncology Imaging AI - Region x Modality (2032 Market Size and Index vs. Global Mix)
- Figure 17: Global Oncology Imaging AI - Region x Modality (Dollar Lift 2023 vs 2032)
- Figure 18: Global Oncology Imaging AI - Region x Revenue Stream (2032 Market Size and Index vs. Global Mix)
- Figure 19: Global Oncology Imaging AI - Region x Revenue Stream (Dollar Lift 2023 to 2032)
- Figure 20: World Market for Oncology Imaging AI by Region x Clinical Application (USD Mill, 2032)
- Figure 21: Global Oncology Imaging AI - Region x Clinical Application (Dollar Lift 2023 to 2032)
- Figure 22: Global Oncology Imaging AI - Tumor Site x Modality (2032 Market Size and Index vs. Global Mix)
- Figure 23: Global Oncology Imaging AI - Tumor Site x Modality (Dollar Lift 2023 to 2032)
- Figure 24: Global Oncology Imaging AI - Tumor Site x Clinical Application (2032 Market Size and Index vs. Global Mix)
- Figure 25: Global Oncology Imaging AI - Tumor Site x Clinical Application (Dollar Lift 2023 to 2032)
- Figure 26: Global Oncology Imaging AI - Tumor Site x Revenue Stream (2032 Market Size and Index vs. Global Mix)
- Figure 27: Global Oncology Imaging AI - Tumor Site x Revenue Stream (Dollar Lift 2023 to 2032)
- Figure 28: Global Oncology Imaging AI - Modality x Revenue Stream (2032 Market Size and Index vs. Global Mix)
- Figure 29: Global Oncology Imaging AI - Modality x Revenue Stream (Dollar Lift 2023 to 2032)
- Figure 30: Global Oncology Imaging AI - Clinical Application x Revenue Stream (2032 Market Size and Index vs. Global Mix)
- Figure 31: Global Oncology Imaging AI - Clinical Application x Revenue Stream (Dollar Lift 2023 to 2032)
- Figure 32: Global Oncology Imaging AI - Pathway Stage x Revenue Stream (2032 Market Size and Index vs. Global Mix)
- Figure 33: Global Oncology Imaging AI - Pathway Stage x Revenue Stream (Dollar Lift 2023 to 2032)
- Figure 34: Global Oncology Imaging AI - Pathway Stage x Modality (2032 Market Size and Index vs. Global Mix)
- Figure 35: Global Oncology Imaging AI - Pathway Stage x Modality (2032 Market Size and Index vs. Global Mix)
- Figure 36: Global Oncology Imaging AI - Pathway Stage x Clinical Application (2032 Market Size and Index vs. Global Mix)
- Figure 37: Global Oncology Imaging AI - Pathway Stage x Clinical Application (Dollar Lift 2023 to 2032)
- Figure 38: World Market for Oncology Imaging AI by Pathway Stage x End-use Org (2032 Market Size and Index vs. Global Mix)
- Figure 39: Global Oncology Imaging AI - Pathway Stage x End-Use (Dollar Lift 2023 to 2032)
- Figure 40: World Market for Oncology Imaging AI by Pathway Stage x AI Technology (2032 Over/Under Mix)
- Figure 41: World Market for Oncology Imaging AI by Pathway Stage x AI Technology (USD Mill, 2032)

