
PUBLISHER: MTN Consulting, LLC | PRODUCT CODE: 1636632

PUBLISHER: MTN Consulting, LLC | PRODUCT CODE: 1636632
Telecommunications Network Operators - 3Q24 Market Review: Telco Topline Rebounds but Annualized Capex Dips Below $300B Mark amid Continued Spending Cuts
This report reviews the growth and development of the telecommunications network operator (TNO, or telco) market. The report tracks a wide range of financial stats for 140 telcos across the globe, from 1Q11 through 3Q24. For the annualized 3Q24 period, telcos represented $1.77 trillion (T) in revenues (0.1% growth YoY), $262.4 billion (B) in labor costs (0.8% YoY), and $294.6B in capex (-7.7% YoY). They employed approximately 4.45 million people as of September 2024, down 1.5% from the prior year.
VISUALS
Below are a few highlights from the report:
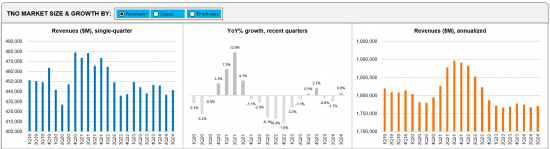
Revenues: Telco topline grew slightly by 0.8% on a YoY basis to post $441.4 B in the latest single quarter ending 3Q24. Revenues for the annualized 3Q24 period were $1,770.6B, up 0.1% YoY over the same period in the previous year. At the operator level, five of the top 20 telcos by topline growth in 3Q24 on an annualized basis include Airtel (4.6%), America Movil (4.3%), STC (Saudi Telecom) (4.2%), Deutsche Telekom (3.3%), and BT (2.5%). By the same criteria, the worst telco growth came from Vodafone (-6.8%), KDDI (-5.7%), NTT (-5.0%), SoftBank (-3.6%), and BCE (-1.6%) during the same period. Note that exchange rate volatility was NOT a major factor in 3Q24, as most major currencies were relatively stable versus 3Q23 levels.
Capex: Capex spending declined by 6.1% on a YoY basis to post $71.1B in the latest single quarter ending September 2024. Capex for the annualized 3Q24 period was $294.6B, down 7.7% YoY over the same period in the previous year. At the operator level, five of the top 20 telcos by capex growth in 3Q24 on an annualized basis include BSNL (300.6%), Telstra (52.3%), BT (4.8%), NTT (3.0%), and China Mobile (1.9%). By the same criteria, the worst capex growth came from Reliance Jio (-27.4%), Verizon (-22.5%), Vodafone (-20.0%), Deutsche Telekom (-18.1%), and KDDI (-16.3%) during the same period.
Opex and labor costs: Total opex for the telecom industry in the annualized 3Q24 period stood at $1,507.9B, a slight increase of 0.9% over the same period in the previous year. Excluding depreciation and amortization (D&A) costs, opex increased by 1.7% on YoY basis to record $1,179.4B in the annualized 3Q24 period. One significant element of telco opex is labor costs, which include salaries, wages, bonuses, benefits, and retirement/severance costs. Labor costs grew by 0.8% YoY in the annualized 3Q24 period, while labor costs as a percentage of opex (ex-D&A) was 22.2% in the same period.
Profitability margins: Both EBITDA and EBIT margins showed a slight decline in annualized 3Q24 compared to 3Q23. The annualized EBIT margin dipped from 15.5% in 3Q23 to 14.8% in 3Q24, while the EBITDA margin for the annualized 3Q24 period stood at 33.4%, down from 34.5% in annualized 3Q23.
Regional trends: The Americas retained its position as the largest revenue-generating region in 3Q24, contributing 37.2% of global telco revenues, closely followed by Asia with a 36.4% share. On a capex basis though, Asia emerged as the top spender, claiming 38.2% of global capex and outpacing the Americas; this is a change from 3Q22 and 3Q23, when Americas ranked #1 on the back of 5G spending by AT&T and Verizon. Europe retained the highest annualized capital intensity, reaching 17.8% in 3Q24, followed by MEA at 17.0%.
Important note: We have made some significant enhancements to our telco market review report in 1Q24. The changes are designed to provide a more insightful and user-friendly experience:
- 'Market Snapshot' Tab:This tab now features an interactive dashboard view of the telco market, allowing users to interact with and analyze market data more effectively. Additionally, users can export the dashboard to PDF for convenient sharing and reference.
- Two distinct sections have been created from the previous 'Company Deepdive & Benchmarking' section for greater clarity and functionality:
- 1.'Company Drilldown': Provides a comprehensive analysis of a selected company from the full set of 140 telcos. It covers various metrics including revenue, capex, employee counts, costs, profitability, cash and debt levels, and key ratios.
- 2.'Company Benchmarking': Focuses on a sample of 79 telcos, representing approximately 82% of the global market. This section allows users to select and compare up to 5 telcos across multiple metrics such as labor costs, opex, EBIT, as well as revenues, capex, and employee counts. The sample includes operators from all regions and of varying sizes.
Both new sections also feature the capability to export graphics to PDF, enhancing the flexibility and utility of the data presented.
Operator coverage:
|
|
Regional coverage:
|
|
Table of Contents
- 1. Report Highlights
- 2. Summary
- 3. Market snapshot
- 4. Analysis
- 5. Key stats through 3Q24
- 6. Labor stats
- 7. Operator rankings
- 8. Company drilldown
- 9. Company benchmarking
- 10. Country breakouts
- 11. Country breakouts by company
- 12. Regional breakouts
- 13. Raw Data
- 14. Subs & traffic
- 15. Exchange rates
- 16. Methodology & Scope
- 17. About
List of Figures and Charts:
- 1. TNO market size & growth by: Revenues, Capex, Employees - 1Q19-3Q24
- 2. Regional trends by: Revenues, Capex - 1Q19-3Q24
- 3. Opex & Cost trends
- 4. Labor cost trends: 1Q20-3Q24
- 5. Profitability margin trends: 1Q20-3Q24
- 6. Spending (opex, labor costs, capex): annual and quarterly trend
- 7. Key ratios: annual and quarterly trend
- 8. Workforce & productivity trends: 1Q14-3Q24
- 9. Operator rankings by revenue and capex: latest single-quarter and annualized periods
- 10. Top 20 TNOs by capital intensity: latest single-quarter and annualized periods
- 11. Top 20 TNOs by employee base: latest single-quarter
- 12. TNOs: YoY growth in single quarter revenues
- 13. TNOs: Annualized capital intensity, 1Q16-3Q24
- 14. TNOs: Revenue and RPE, annualized 1Q16-3Q24
- 15. TNOs: Capex and capital intensity (annualized), 1Q16-3Q24
- 16. TNOs: Total headcount trends, 1Q16-2Q24
- 17. TNOs: Revenue and RPE trends, 2011-23
- 18. TNOs: Capex and capital intensity, 2011-23 ($ Mn)
- 19. TNOs: Capex and capital intensity, 1Q16-3Q24 ($ Mn)
- 20. TNOs: Revenue and RPE trends, 1Q16-3Q24
- 21. TNOs by total opex, 3Q24
- 22. TNOs by labor costs, 3Q24
- 23. TNOs: Software as % of total capex
- 24. TNOs: Software & spectrum spend
- 25. TNOs: Total M&A, spectrum and capex (excl. spectrum)
- 26. TNOs by total debt: 2011-23
- 27. TNOs by total net debt: 2011-23
- 28. TNOs by long term debt: 2011-23
- 29. TNOs by short term debt: 2011-23
- 30. TNOs by total cash and short term investments ($M): 2011-23

