
PUBLISHER: MTN Consulting, LLC | PRODUCT CODE: 1266271

PUBLISHER: MTN Consulting, LLC | PRODUCT CODE: 1266271
Energy Costs Spike 2022 Opex for Carrier-neutral Sector: For Many Carrier-neutral Operators, Energy is Largest Operational Expense and Can Account for Up to 80% of Opex (ex-D&A), Costs Surged in 2022 for Many
This brief presents data on energy spending by operators of cell towers, data centers, and fiber networks, and discusses the implications of the data and likely future directions. Utilities represent a large portion of operating expenses for these infrastructure-focused companies, which we track as "carrier-neutral network operators" (CNNOs). CNNOs also spend more than other types of operators. Webscale spending on power is miniscule relative to their size, less than 1% of opex (ex-D&A). Telcos spend a few % of opex (ex-D&A) on utilities. But CNNOs can spend more than 30% and up to 80% of opex (ex-D&A) on utilities.
VISUALS
Coverage
Companies mentioned:
|
|
Table of Contents
- Summary
- CNNOs are more energy-intensive than other operator types
- Sustainability in networks needs to start with CNNOs
- Implications
- Appendix
List of Figures
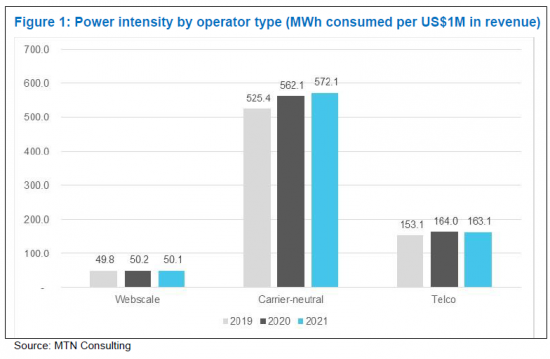
- Figure 1: Power intensity by operator type (MWh consumed per US$1M in revenue)
- Figure 2: Utilities spend as a % of opex (excluding depreciation & amortization), 2020-22
- Figure 3: Utilities vs. D&A costs as a percentage of total opex, 2022

