
PUBLISHER: MTN Consulting, LLC | PRODUCT CODE: 1309748

PUBLISHER: MTN Consulting, LLC | PRODUCT CODE: 1309748
Telco Network Energy Efficiency Rising 12% Per Year: Average Telco Carried 15.5 Terabytes of Traffic Per MWh of Energy Consumed in 2022, From 12.3 in 2020, More Efficiency is Essential to Control Costs, Emissions
For a group of 16 telcos, MTN Consulting has analyzed data on network traffic, energy consumption, carbon emissions, and revenues. This brief examines the relationship between energy consumption and network traffic in the telco market.
VISUALS
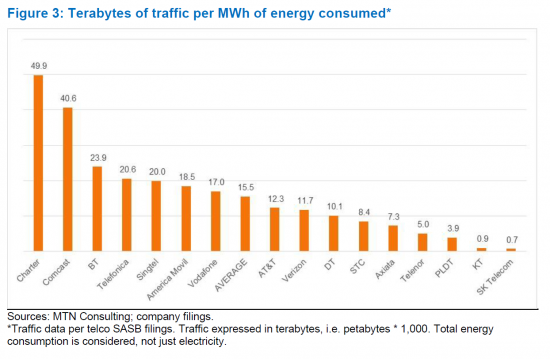
The group of 16 telcos included in this analysis represent over 40% of the global market, based on revenues. On a revenue basis, our data verify the well-known revenue-traffic conundrum: in 2022, the average telco carried 1.93 Petabytes of traffic per US$1M in revenue, up 37% from 1.41 PB/$M in 2020. In the 2020-22 timeframe, this group increased network traffic at an average annual rate (CAGR) of 13.8%, while their total energy consumption grew at a CAGR of 1.2%. As such, in 2022 the average telco consumed 64.4 MWh of energy per Petabyte of traffic, down from 81.3 MWh/PB in 2020. This improvement is in line with the stated goal of both telcos and their vendors: to improve the network's energy efficiency over time. The average telco's carbon footprint per unit of traffic also declined in the same period, from 110.8 millions of tons of CO2 equivalent (MTCO2e) per Petabyte in 2020 to 83.3 MTCO2e/PB in 2022.
Telco sustainability reports emphasize the importance of adopting energy efficient technologies and network designs. Vendors consider the energy efficiency of their solutions a crucial differentiator. As telcos attempt to lower energy costs and reduce their carbon footprints, vendors have an opportunity to support further improvements.
COVERAGE:
Organizations mentioned:
|
|
Table of Contents
Summary
Telco network energy efficiency rising 12% per year
- Overview of the dataset
- The revenue-traffic conundrum persists
- Carbon emissions rising in importance for telcos
- Traffic carried per unit of energy consumed
- Vendors have a central role in sustaining improvements
- Conclusion
Appendix
List of Tables and Figures
- Table 1: Summary metrics for the "Group of 16" telcos
- Figure 1: Petabytes of traffic on network per US$M in revenue, 2020-22*
- Figure 2: Carbon footprint (MT CO2e) per petabyte of traffic on network, 2020-22*
- Figure 3: Terabytes of traffic per MWh of energy consumed*

