
Need help finding what you are looking for?
Contact Us
PUBLISHER: MTN Consulting, LLC | PRODUCT CODE: 1856787

PUBLISHER: MTN Consulting, LLC | PRODUCT CODE: 1856787
Global Telco Market Tracker, 2Q25: Capex Pullback Persists even as Revenues Surge 4.6% - Telco Revenues Surge 4.6% in 2Q25, Capex Restraint Signals Focus on Profitability
PUBLISHED:
PAGES:
DELIVERY TIME: 1-2 business days
SELECT AN OPTION
This report delivers a detailed analysis of the global telecommunications network operator (telco) industry, drilling down into performance for 140 telcos from 1Q11 through 2Q25. It captures revenue, labor, capex, opex, and profitability data with a focus on the most recent quarter (2Q25).
VISUALS
Key findings:
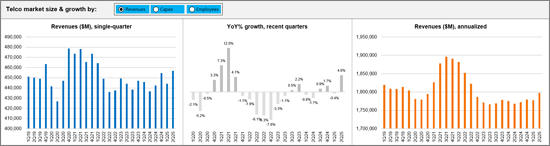
- Global telco revenues climbed 4.6% year-over-year (YoY) in 2Q25 to reach $456.8 billion (B), supported by broad-based recovery across major markets. On an annualized 2Q25 basis, revenues grew 1.7% YoY to $1.8 trillion (T). Airtel (20.0%), Etisalat (18.7%), SoftBank (7.3%), Deutsche Telekom (4.6%), and China Unicom (3.7%) led growth in the annualized 2Q25 period, while Vodafone (-11.6%) and Orange (-7.1%) declined sharply.
- Capex declined 2.1% YoY in 2Q25 to $67.5B, while the annualized total fell 2.6% to $292.9B. That's the lowest 12-month total since 2011, and the lowest capital intensity since 2013. China Mobile remained the largest investor with $24.4B in annualized capex (+7.8% YoY) in 2Q25, while America Movil (-24.5%), China Telecom (-22.9%), and China Unicom (-17.7%) made significant cutbacks. Telco tech spending continues to shift modestly towards software and services, which may be recorded as opex rather than capex, but telcos remain vigilant cost cutters across the board.
- Labor costs fell 1.3% YoY to $258.1B in the annualized 2Q25 period, with telco headcount shrinking to 4.36 million. Labor represented 21.7% of opex (excluding D&A) for the annualized 2Q25 period, down a bit from 22.2% in 2Q24.
- Profitability margin inched higher in the latest annualized period from a year ago, with EBITDA at 33.8%, suggesting stable operational efficiency despite cost pressures. EBIT margin also edged up a bit, from 14.9% in 2Q24 to 15.5% for the 12 months ended June 2025.
- Regionally, Asia maintained its lead with 36.8% of global telco revenues in 2Q25, slightly ahead of the Americas (36.3%). On the capex spending front, the Americas outspent all other regions, boosted by network spending from AT&T and Verizon.
Operator coverage:
|
|
Regional coverage:
|
|
|
|
Product Code: GNI-27102025-1
Table of Contents
1. Report Highlights
2. Summary
3. Market snapshot
4. Analysis
5. Key stats through 2Q25
6. Labor stats
7. Operator rankings
8. Company drilldown
9. Company benchmarking
10. Country breakouts
11. Country breakouts by company
12. Regional breakouts
13. Raw Data
14. Subs & traffic
15. Exchange rates
16. Methodology & Scope
17. About
Product Code: GNI-27102025-1
List of Figures and Charts
- 1. TNO market size & growth by: Revenues, Capex, Employees - 1Q19-2Q25
- 2. Regional trends by: Revenues, Capex - 1Q19-2Q25
- 3. Opex & Cost trends
- 4. Labor cost trends: 1Q20-2Q25
- 5. Profitability margin trends: 1Q20-2Q25
- 6. Spending (opex, labor costs, capex): annualized and quarterly trend
- 7. Workforce & productivity trends: 1Q14-2Q25
- 8. Operator rankings by revenue and capex: latest single-quarter and annualized periods
- 9. Top 20 TNOs by capital intensity: latest single-quarter and annualized periods
- 10. Top 20 TNOs by employee base: latest single-quarter
- 11. Company Drilldown: YoY growth in single quarter revenues
- 12. Company Drilldown: Revenue and revenue split, single quarter and annualized 1Q16-2Q25
- 13. Company Drilldown: Capex and capital intensity (annualized), 1Q16-2Q25
- 14. Company Drilldown: Revenue split by country, 2Q25
- 15. Company Drilldown: Costs and Profitability, 1Q16-2Q25 ($ Mn)
- 16. Company Drilldown: Labor costs, per employee and % opex trends, 1Q16-2Q25
- 17. Company Drilldown, Cash & debt levels (2011-24)
- 18. Company Drilldown: Software as % of total capex
- 19. Company Drilldown: Software & spectrum spend
- 20. Company Drilldown: Total M&A, spectrum and capex (excl. spectrum)
- 21. Country Breakouts: Revenue and Capex, Market Share, and Capital Intensity
Have a question?


SELECT AN OPTION
Have a question?
Questions? Please give us a call or visit the contact form.