
PUBLISHER: MTN Consulting, LLC | PRODUCT CODE: 1889066

PUBLISHER: MTN Consulting, LLC | PRODUCT CODE: 1889066
Webscale Market Tracker 3Q25 - 12 Month Capex Hits $450 Billion: Revenues up 14%, but 63% YoY Capex Surge Depresses Cash Flow and Worsens Debt, NVIDIA Races to Secure Dominance, Big Tech CEOs Hedge Bets but Continue Riding the Wave
In 2011, the year we started tracking webscale, capex totaled $28.5 billion for the year. About 7 years later, the sector's 12 month ("annualized") capex total first exceeded $100B, in 2Q18. Four years later, capex first rose above $200B, in 3Q22. The $300B mark was broken 2 years later, in 4Q24. Two quarters after that, capex hit $400B. In 3Q25, capex kept rising, to reach $450B and on the way rapidly to the $500B mark.
VISUALS
We have been calling this market a bubble for over a year-and-a-half. That's not because we dislike AI, or fail to see its massive potential to impact the planet. We see incredible upside in artificial intelligence, but we also see the downside risks. Moreover, we have lived through many technology transitions over the last 30 years, and understand that hype cycles can get out of hand. And investment bubbles can happen even without technology changes at play, as we were reminded during the financial crisis of 2008-9.
With today's webscale market, a crash is overdue, as this market is plagued by insane levels of hype but very little in the way of proven business models. AI spend has been propped up by a combination of US government subsidies, mass market consumer interest (but very little willingness to pay), a self-reinforcing loop between buyers and sellers, and AI hypemasters eager to be first - even if they have no idea what benefits this may deliver, if any.
Webscale's AI-driven infrastructure buildout keeps breaking records. In 3Q25, the 25 companies in our Webscale Tracker generated $749 billion (B) in revenue (+14.0% YoY), spent $129B on capex (+63.0%), poured $99B into R&D (+23.6%), and held $641B in cash (flat YoY) against $572B in debt (+4.0%). Net PP&E surged 41.1% YoY to $1.227 trillion. Headcount hit 4.58 million employees (+1.9% YoY).
Notes: (1) This is MTN Consulting's 32nd quarterly assessment of the webscale market, part of a series we launched in 4Q17; our data and analysis spans the 1Q11-3Q25 timeframe, i.e. 59 quarters. (2) The 25 companies in our study include several recent additions: CoreWeave (added last year), and this quarter's three new adds: Kuaishou, Nebius (Yandex spinoff), and Xiaomi.
Revenue: Topline grows at 14% YoY rate again, led by Meta, Xiaomi, and Microsoft
Webscale revenues reached $749B in 3Q25, up 14% YoY, with annualized revenues rising to $2.91T (+12.1%). The largest players remain Amazon ($180.2B), Apple ($102.5B), Alphabet ($102.3B), Microsoft ($77.7B), and Meta ($51.2B). Meta continues to deliver above 20% growth, driven by strength in the US and Canada.
The fastest growth came from Coreweave, which shifted from crypto mining to GPU rentals with early backing from NVIDIA. Its rapid rise and limited competitive defenses have raised comparisons to past cycle "tells," such as 360networks in the dot-com era. Among major players, Meta and Xiaomi both exceeded 20% growth. Xiaomi cited returns from its 2025 AI investments as well above expectations. Microsoft, Alphabet, and Tencent grew in the mid-teens. Baidu lagged, and Fujitsu declined due partly to FX and restructuring.
Advertising remains central for several firms. Meta is the most exposed, with ads still driving nearly all revenue. Alphabet's non-ad share has risen to almost 25%. Amazon is pushing into ads and is nearing 10% of revenues. Ad-dependent companies face higher risk if US consumer spending weakens in 2026. A further open question is whether scaled AI platforms will rely heavily on ads, given slow traction for paid models outside early adopters.
Capex: AI hype boosts capex to $450 billion over 12 months
Webscale technology spending continues to surge. R&D rose nearly 16% YoY, reaching a record share of revenues, driven heavily by Meta, whose quarterly R&D topped $15B (+35% YoY). Across the sector, R&D is increasingly concentrated in AI. Capex expanded even faster, rising 71% over the latest 12 months to roughly $450B, pushing net PP&E up 41% in 3Q25.
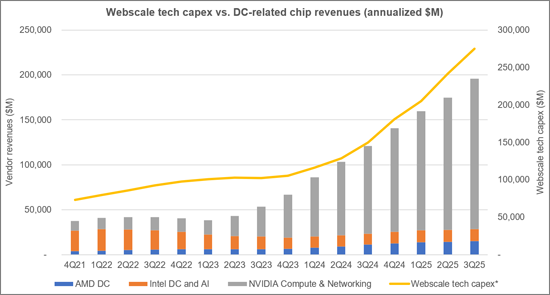
Capex has now grown more than 50% YoY for six consecutive quarters, lifting capital intensity to 15.5%. Tech-related capex exceeds 60% of the total, focused on data center buildouts, servers, power systems, and emerging investment in fiber and transport. NVIDIA's influence remains strong, fueling both demand and competitive fear, including its recent move into mobile RAN with Nokia. Oracle and Meta lead in tech capex intensity among major players; Apple and JD are lowest.
R&D intensity also climbed to an all-time high of 12.4% of revenues. Meta is the clear leader, followed by SAP and Oracle. At the opposite end, Fujitsu and JD have retreated from cloud and that's apparent in their R&D spend.
Net PP&E per employee averaged $268K in 3Q25 but exceeded $2M at Meta, reflecting automation and aggressive data center expansion. SAP, IBM, JD, and Cognizant remain asset-light as they shrink their owned footprints.
Webscale capex, negligible a decade ago, surpassed $400B annualized in 2Q25 and now exceeds telco capex by almost 50%. US deployments account for an outsized share-peaking at 66% of global capex in 2024-driven by AI-related buildouts such as the nearly 5.2 Gigawatts of capacity currently under construction in the US, per CBRE.
Profitability: Free cash flow margin falls to all-time low of 12.8%
Average net margin (net income/revenue) and FCF margin (FCF/revenue) for the webscale market rebounded after the 2022 crash, but FCF margin is now at an all-time low of 12.8%. FCF is cash from operations minus capital expenditures (capex) and is generally a more reliable profit metric than net income.
The low FCF margin is primarily due to an explosion in capex spending. While webscalers retain a large cash buffer, the gap between sector debt and cash reserves has significantly shrunk. For context, during the 2018 capex surge, FCF margins were a much higher 17% to 18%.
On a per-employee basis, Apple and Meta are leaders, each recording FCF well over $500,000 in the last 12 months. Apple's high figures are partly due to its cautious stance on AI-related capex. In terms of FCF margins by company, Tencent and Microsoft lead, closely followed by Apple and Meta.
Regulatory fines and civil lawsuits represent a persistent, though minor, risk to profitability. Webscalers consistently treat this as a "cost of doing business," often ignoring rulings, aggressively fighting them in court, and using public relations to minimize backlash, moving far from the earlier "don't be evil" philosophy.
Employment: Headcount steps up by 1.9% YoY to 4.58 million employees
Headcount ended 3Q25 at about 4.58 million employees, up 1.9% YoY. Total headcount is a tricky metric in webscale, as the sector's employee base is influenced heavily by logistics, fulfillment and delivery employees at companies like Amazon, Alibaba, and JD.Com. Among the more tech-centric webscalers, Microsoft's YoY 3% decline is notable. Meta and Alphabet saw slight increases, though.
Webscale surpassed telecom employment in the last few quarters, but headcount for both segments will likely fall going forward. Already, for webscalers, metrics like revenue per employee and net PP&E per employee have made sizable gains in the last 2-3 years.
Regional Trends: Europe leads regions with 18% YoY growth in 3Q25
Regionally, Europe had the best quarter in 3Q25, growing revenues by 18% YoY. Asia Pacific and MEA both grew by 14% YoY, the same as the overall market, while the Americas lagged with 12% growth. The Americas is easily the biggest region, though, accounting for about 46% of global revenues in 2024.
While Amazon is #1 in both the Americas and Europe by revenues, other regions differ: JD.Com leads in Asia (Amazon is #4), while in the MEA region Amazon is outpaced by Alphabet and Apple.
Companies covered:
- 25 in total: 21 active and reporting data publicly, 4 either inactive (ChinaCache), gone private (Twitter), or now part of other companies (Altaba and LinkedIn).
- The 21 active companies include: Alibaba, Alphabet, Amazon, Apple, Baidu, Cognizant, CoreWeave, eBay, Fujitsu, HPE, IBM, JD.COM, Kuaishou, Meta (FB), Microsoft, Nebius, Oracle, SAP, Tencent, Xiaomi, and Yandex
- Three new companies have been added in 2Q25: Kuaishou, Nebius, and Xiaomi. CoreWeave was added in 4Q24.
- Vendors addressed: AMD, Arista , Ciena, Cisco, HPE, Infinera, Intel, Juniper, Nokia, NVIDIA, and Wiwynn
Table of Contents
1. Report highlights
2. Outlook
3. Analysis
4. Key Stats
5. Company Drilldown
6. Company Benchmarking
7. Regional Breakouts
8. Raw Data
9. Exchange Rates
10. About
List of Figures and Charts
- 1. Capex outlook by scenario ($B)
- 2. Key Metrics: Growth rates, Annualized 3Q25/3Q24 vs. 2021-24
- 3. Webscale Revenues: Single-quarter & annualized (US$M)
- 4. Key webscaler revenues: YoY % revenue growth in 3Q25
- 5. Annualized profitability: WNOs
- 6. Free cash flow per employee, 3Q25 annualized (US$)
- 7. Key webscaler free cash flow margins: 3Q25 annualized
- 8. Advertising revenues as % total (FY2024)
- 9. Annualized capex and R&D spending: WNOs (% revenues)
- 10. WNO capex by type, Annualized: 2Q14-3Q25 (US$M)
- 11. Network & IT capex as share of revenues, 3Q25 annualized
- 12. Key webscaler R&D expenses, % revenues: 3Q25 annualized
- 13. Acquisition spending vs. capex spending, annualized (US$M)
- 14. Net PP&E per employee (US$' 000) - 3Q25
- 15. Ranking the Webscale Network Operators: Revenues; R&D; Capex; Network & IT capex - 2024 & 3Q25 (US$B)
- 16. Annualized spending for key webscalers since 2011 Capex: Network, IT and software
- 17. Share of webscale spending by company, 3Q25 and 3Q24 annualized (Capex: Network, IT and software)
- 18. Energy consumption vs. Net PP&E for key webscalers in 2024
- 19. Webscale vs. Telco Market: Annualized Capex (US$B)
- 20. Webscale vs. Telco Market: Annualized capital intensity
- 21. USA: Webscale capex total ($M) and % of global market, 2011-24
- 22. China's webscalers versus the big 4: Capex in 2024 ($B)
- 23. Chinese webscale capex on the rise again ($M)
- 24. Webscale tech capex vs. DC-related chip revenues (annualized $M)
- 25. Webscale tech capex vs. Data center-related systems revenues (annualized $M)
- 26. Revenues: annual, single-quarter, and annualized (US$M)
- 27. Profitability (Net Profit; Cash from operations; Free cash flow): annual, single-quarter, and annualized (US$M)
- 28. Spending (R&D; M&A; Capex; Network & IT capex; Lease): annual, single-quarter, and annualized (US$M)
- 29. Cash & Short-term Investments: annual and single-quarter (US$M)
- 30. Debt (Total debt; Net debt): annual and single-quarter (US$M)
- 31. Property, Plant & Equipment: annual and single-quarter (US$M)
- 32. Key Ratios: Net margin; R&D/revenues; Capex/revenues; Network & IT capex/revenues; Free cash flow/revenues; Lease costs/revenues - annual and annualized (%)
- 33. Total employees
- 34. Revenue per employee, annualized (US$K)
- 35. FCF per employee, annualized (US$K)
- 36. Net PP&E per employee, annualized (US$K)
- 37. Revenues & Spending (US$M)
- 38. Revenues (US$M) & YoY revenue growth (%), single-quarter: by company
- 39. Revenues, annualized (US$M): by company
- 40. Annualized profitability margins: by company
- 41. Annualized capex and capital intensity: by company
- 42. Annualized capex and R&D spending as % of revenues: by company
- 43. Share of WNO network & IT capex, Annualized: by company
- 44. Total employees: by company
- 45. Annualized per-employee metrics (US$000s): by company
- 46. Net debt (debt minus cash & stock) (US$M): by company
- 47. Top 10 webscale employers in 3Q25: Global market
- 48. Headcount changes in 3Q25 (YoY %): Global market
- 49. Net PP&E: USA vs. RoW (by company)
- 50. Net PP&E: total in $M and % global webscale market (by company)
- 51. Energy consumption, MWh and % webscale total (by company)
- 52. Share of webscale energy consumption, net PP&E, and capex (by company)
- 53. Energy intensity relative to webscale average and select data center-focused CNNOs (by company)
- 54. Energy intensity in webscale sector, 2024: MWh consumed per $M in revenue
- 55. Capex/revenues (annualized): Company vs. Webscale average
- 56. Revenue per employee (US$000s) (annualized): Company vs. Webscale average
- 57. 2018 vs. 2024: company benchmark by KPI (Revenues, R&D, Net profit, Cash from operations, Capex, Free cash flow, Cash & short-term investments, Net PP&E, Total debt)
- 58. 2018 vs. 2024: company benchmark by key ratio (Capex/revenues; R&D/revenues; Net margin; FCF margin)
- 59. Top 8 WNO's share vs. Rest of the market: by KPI (Revenues, R&D, Net profit, Cash from operations, Capex, Free cash flow, Cash & short-term investments, Net PP&E, Total debt)
- 60. Top 8 WNOs benchmarking by Key ratio: Capex/revenues; R&D/revenues; Net margin; FCF margin
- 61. Total WNO Market Revenues, by region: Latest CY; Latest Quarter; Annual trend (2011-24); Single quarter (3Q16-3Q25 )
- 62. WNO Market: Revenues, single-quarter (YoY % change)
- 63. Regional revenues by operator: Latest CY; Latest Quarter; Annual trend (2011-24); Single quarter (3Q16-3Q25)
- 64. Top 10 operators by region: Latest CY; Latest Quarter

