
PUBLISHER: Northern Sky Research, LLC | PRODUCT CODE: 1246781

PUBLISHER: Northern Sky Research, LLC | PRODUCT CODE: 1246781
Maritime Connectivity, 11th Edition
Report Summary:
NSR's “ Maritime Connectivity, 11th Edition” report offers valuable insights and analysis, helping industry stakeholders understand market dynamics and capitalize on growth opportunities in maritime SatCom markets.
Focusing on the impacts from Non-GEO systems such as the 'new entrants' of Starlink, OneWeb, and mPower this edition explores the role of GEO vs. Non-GEO (NGSO) connectivity in the maritime SATCOM markets. Building from a regional and segment level view, the report is broken down into 5 vessel types - Merchant, Passenger, Offshore, Fishing, and Leisure. Each segmentation provides insight into In-service units, retail revenues, capacity demand and revenue. Overall, as more capacity choices come online over the next ten years Maritime SATCOM players will need to have a carefully crafted capacity strategy in place to optimize revenues and meet customer demands.
As the impacts of COVID-19 fall away from the market, digitalization and throughput requirements remain. Passenger vessels are seeing a surge in connectivity requirements, oil and gas / Offshore demand persist on a per-vessel basis, and now might be the time for crew welfare provisioning to become a key driver of demand. Towards 2032, new terminal form factors and price points will unlock smaller and smaller vessels, new business models will help capture marginal use-cases, and overall, the demand for maritime satellite connectivity continues to expand.
Bottom line, NSR's “ Maritime Connectivity, 11th Edition” helps industry stakeholders make informed decisions about their business strategies and investments in this important evolving market.
Key questions are answered in this report?
- What are the major satellite connectivity architectures?
- Which region holds the most opportunity?
- What is the revenue outlook of the Maritime SATCOM Market?
- What is the growth rate of the Maritime SATCOM market?
- Which vessel market is in transition towards NGSO market?
Who Should Purchase this Report:
- SATCOM service providers
- Business Strategy mangers
- Maritime end-users
- Maritime Satellite Equipment manufacturers
- Satellite Operators
- Financial services and other investor community members
Key Features:
Covered in this Report:
- NEW in this Edition - Focus on the uptake and impact of NGSO Players such as Starlink and OneWeb
- 8 Regions - NAM, LAM, EU, MEA, ASIA, AOR, IOR, POR, ARC
- Forecasts for 5 vessel markets - Merchant, Passenger, Offshore, Fishing, Leisure.
- Overview of VSAT demand for each vessel market.
Key Findings:
- Merchant Vessels - VSAT adoption increasing across merchant market. IoT and Cloud-to-Vessel adoption is occurring across fleets, including more SD-WAN installations.
- Passenger Vessels - Cruise liners trialing NGSO connectivity e.g., SpaceX Starlink. Passenger vessels are optimizing their fleets network to automate data processing.
- Offshore Vessels - A market that is filled with VSAT architecture. Early trials of NGSO low latency connectivity taking place in Q1 of 2023 e.g., SpaceX Starlink.
- Fishing Vessels - Vessel optimization for HTS architecture is occurring and is a given with new builds. VSAT adoption is on the rise across the fishing market.
- Leisure Vessels - NGSO adoption is occurring across both small and super yachts. VSAT adoption is happening on small yachts due to affordable price tag.
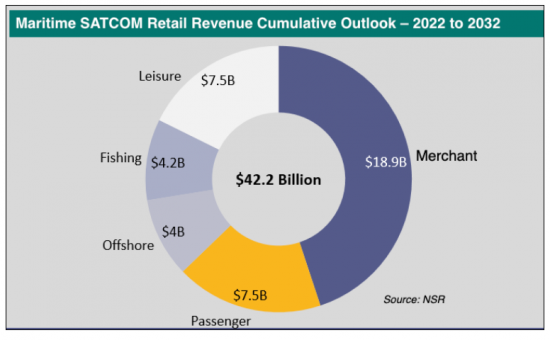
Overall cumulative revenue for the forecast period is USD$42.2 billion and a CAGR of 9.5%.
Companies included in this Report:
SpaceX Starlink, OneWeb, Telesat Lightspeed, AWS Kuiper, Inmarsat, Intellian, Speedcast, Marlink, Anuvu, SES.
Table of Contents
1. Maritime SATCOM Executive Summary
- 1.1. Overview
- 1.2. A $42 Billion Opportunity
- 1.3. A near-term Increase for Monthly ARPUs
- 1.4. The Non-GEO HTS Migration Underway
- 1.5. Major Findings
2. Key Findings
- 2.1. A LEO + MEO Pivot for SATCOM vessel markets
- 2.2. VSAT Historical Comparisons
- 2.3. Regional Outlook
- 2.4. Total Addressable Market (TAM)
- 2.5. State of Service Provider Layer
- 2.6. Merchant Outlook
- 2.7. Passenger Outlook
- 2.8. Offshore Outlook
- 2.9. Fishing Outlook
- 2.10. Leisure Outlook
3. Challenges and Recommendations
- 3.1. Monetizing beyond "Connectivity"
- 3.2. Non-GEO Improving Connectivity and Decreasing Role of SP-provided VAS?
- 3.3. Three Big Growth Opportunities in Maritime SATCOM.
4. Data Appendix
- 4.1. Global Forecast At-a-glance
- 4.2. Merchant Forecast
- 4.3. Passenger Forecast
- 4.4. Offshore Forecast
- 4.5. Fishing Forecast
- 4.6. Leisure Forecast
- 4.7. Key Definitions
- 4.8. Changelog
List of Exhibits
1. Maritime SATCOM Executive Summary
- 1.1. Maritime SATCOM Retail Revenue Cumulative Outlook - 2022 to 2032
- 1.2. Global Maritime SATCOM Market Retail Revenue ($M)
- 1.3. Global Maritime SATCOM Average BB $Month 2022-2027
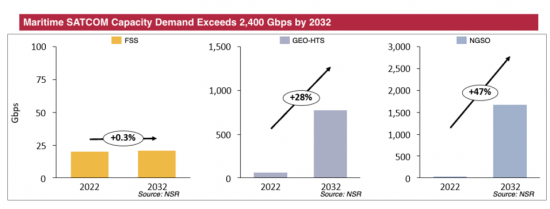
- 1.4. Maritime SATCOM Capacity Demand, FSS vs. GEO-HTS vs. NGSO
- 1.5. Maritime SATCOM Capacity Revenues
2. Key Findings
- 2.1. Maritime SATCOM Retail Revenues by Capacity Type (USD $M)
- 2.2. VSAT Vessel Comparison
- 2.3. VSAT No. of Vessels
- 2.4. Broadband SATCOM Addressable Vessels
- 2.5. Broadband Connected Vessels
- 2.6. Top Maritime Service Provider by Service Revenues (2022)
- 2.7. Top Maritime Service Provider by Connected Vessels (2022)
- 2.8. Merchant Retail ARPU 2022-2032 (USD$ per Month)
- 2.9. Merchant Service Revenues ($M) - GEO-HTS vs NGSO
- 2.10. Percentage of Addressable Merchant vessels
- 2.11. Passenger Retail ARPU 2022-2032 (USD$ per Month)
- 2.12. Passenger Service Revenues ($M) - GEO-HTS vs NGSO
- 2.13. Percentage of Addressable Passenger vessels
- 2.14. Offshore Retail ARPU 2022-2032 (USD$ per Month)
- 2.15. Offshore Service Revenues ($M) - GEO-HTS vs NGSO
- 2.16. Percentage of Addressable Offshore vessels
- 2.17. Fishing Retail ARPU 2022-2032 (USD$ per Month)
- 2.18. Fishing Service Revenues ($M) - GEO-HTS vs NGSO
- 2.19. Percentage of Addressable Fishing vessels
- 2.20. Leisure Retail ARPU 2022-2032 (USD$ per Month)
- 2.21. Leisure Service Revenues ($M) - GEO-HTS vs NGSO
- 2.22. Percentage of Addressable Leisure vessels
3. Challenges and Recommendations
- 3.1. Average VSAT Mbps Demand Per Vessel by Market
- 3.2. NGSO Maritime SATCOM Market Breakdown
- 3.3. Global Maritime SATCOM NGSO Capacity Revenues ($M)
- 3.4. Global Maritime SATCOM NGSO Capacity Demand Breakdown
4. Appendix
- 4.1. Global
- 4.1.1. Global Maritime Market Retail Revenues (USD Billions)
- 4.1.2. Global Maritime Market In-Service Units
- 4.1.3. Global Maritime Market Capacity Demand
- 4.2. Merchant Forecast
- 4.2.1. In-Service Units, 2022 to 2032
- 4.2.2. Retail Revenues (USD Million), 2022 to 2032
- 4.2.3. Capacity Demand (FSS, GEO-HTS & NGSO)
- 4.2.4. Cumulative Capacity Revenues (USD Billions), '22 to '32
- 4.2.5. Capacity Revenues (USD Millions)
- 4.2.6. Regional In-Service Units
- 4.2.7. Regional Retail Revenues (USD Billions)
- 4.2.8. Regional Capacity Demand (FSS, GEO-HTS & NGSO)
- 4.3. Passenger Forecast
- 4.3.1. In-Service Units, 2022 to 2032
- 4.3.2. Retail Revenues (USD Million), 2022 to 2032
- 4.3.3. Capacity Demand (FSS, GEO-HTS & NGSO)
- 4.3.4. Cumulative Capacity Revenues (USD Billions), '22 to '32
- 4.3.5. Capacity Revenues (USD Millions)
- 4.3.6. Regional In-Service Units
- 4.3.7. Regional Retail Revenues (USD Billions)
- 4.3.8. Regional Capacity Demand (FSS, GEO-HTS & NGSO)
- 4.4. Offshore Forecast
- 4.4.1. In-Service Units, 2022 to 2032
- 4.4.2. Retail Revenues (USD Million), 2022 to 2032
- 4.4.3. Capacity Demand (FSS, GEO-HTS & NGSO)
- 4.4.4. Cumulative Capacity Revenues (USD Billions), '22 to '32
- 4.4.5. Capacity Revenues (USD Millions)
- 4.4.6. Regional In-Service Units
- 4.4.7. Regional Retail Revenues (USD Billions)
- 4.4.8. Regional Capacity Demand (FSS, GEO-HTS & NGSO)
- 4.5. Fishing Forecast
- 4.5.1. In-Service Units, 2022 to 2032
- 4.5.2. Retail Revenues (USD Million), 2022 to 2032
- 4.5.3. Capacity Demand (FSS, GEO-HTS & NGSO)
- 4.5.4. Cumulative Capacity Revenues (USD Billions), '22 to '32
- 4.5.5. Capacity Revenues (USD Millions)
- 4.5.6. Regional In-Service Units
- 4.5.7. Regional Retail Revenues (USD Billions)
- 4.5.8. Regional Capacity Demand (FSS, GEO-HTS & NGSO)
- 4.6. Leisure Forecast
- 4.6.1. In-Service Units, 2022 to 2032
- 4.6.2. Retail Revenues (USD Million), 2022 to 2032
- 4.6.3. Capacity Demand (FSS, GEO-HTS & NGSO)
- 4.6.4. Cumulative Capacity Revenues (USD Billions), '22 to '32
- 4.6.5. Capacity Revenues (USD Millions)
- 4.6.6. Regional In-Service Units
- 4.6.7. Regional Retail Revenues (USD Billions)
- 4.6.8. Regional Capacity Demand (FSS, GEO-HTS & NGSO)

