
PUBLISHER: Roots Analysis | PRODUCT CODE: 1677742

PUBLISHER: Roots Analysis | PRODUCT CODE: 1677742
T-Cell Therapy Market by Type of Therapy, Target Indication, Target Antigen, Company Size, Geographical Regions, Leading Players and Sales Forecast of Therapies, Industry Trends and Global Forecasts, Till 2035
T-CELL THERAPY MARKET
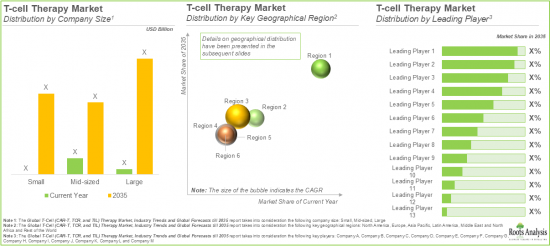
As per Roots Analysis, the global T-cell therapy market size is estimated to grow from USD 6.5 billion in the current year to USD 20.9 billion by 2035, at a CAGR of 12% during the forecast period, till 2035.
The opportunity for the T-cell therapy market has been distributed across the following segments:
Type of Therapy
- CAR-T
- TCR
- TIL
Target Indication
- Multiple Myeloma
- Large B-Cell Lymphoma
- Acute Lymphoblastic Leukemia
- Diffuse Large B-Cell Lymphoma
- Diffuse Large B-Cell Lymphoma, Primary Mediastinal Large B-Cell Lymphoma, Transformed Follicular Lymphoma and High grade B-cell lymphoma
- Acute Lymphoblastic Leukemia / B-cell Non-Hodgkin Lymphoma
- Non-Hodgkin Lymphoma
- Mantle Cell Lymphoma
- Acute Myeloid Leukemia
- Generalized Myasthenia Gravis (MG)
- Renal transplantation (HLA-A2)
- Gastric Adenocarcinoma
- Ovarian / Endometrial Cancer
- Chronic Lymphocytic Leukemia
- Follicular Lymphoma
- Renal Cell Carcinoma
- Melanoma
- Basal Cell Carcinoma
- Lung Cancer
- Sarcoma
- Head And Neck Cancer
- Cervical Cancer
- Neuro Gastro-Intestinal (GI) Cancer
- Breast Cancer
- Hepatocellular Carcinoma
- Nasopharyngeal Carcinoma
- Ovarian Cancer
Target Antigen
- BCMA
- CD19
- CD20
- CD19, CD22
- HLA
- MAGE
- PRAME
- NY-ESO-1 and LAGE
- EBV
- HBV
- Others
Company Size
- Small
- Mid-sized
- Large Research
Geographical Regions
- North America
- Europe
- Asia-Pacific
- Latin America
- Middle East and North Africa
- Rest of the World
T-CELL THERAPY MARKET: GROWTH AND TRENDS
T cells, a subset of white blood cells, are essential to the immunological system of the human body. The body's reactions to external allergens and infections are tightly controlled by these cells, which efficiently identify, target, and eliminate them while recalling the first interactions to trigger a prompt and efficient immune response. Scientists have been actively researching these cells since the 19th century with an aim to leverage them to treat a wide range of medical conditions. In fact, cell therapies (specifically T cell therapies) have attracted a lot of attention lately for managing / treating hard-to-treat diseases, like cancer, autoimmune diseases, and uncommon genetic disorders, ultimately decreasing the global disease burden.
Cancer is one of the leading causes of mortality, accounting for 0.6 million deaths in 2022, in the US alone. As per the International Agency for Research on Cancer (IARC), by 2040, there are likely to be 27.5 million new cases and 16.3 million deaths related to cancer, annually. Although cancer therapeutics continue to be one of the most active areas, in terms of drug development, there are several persistent challenges in this domain. In fact, conventional cancer treatments, such as chemotherapy, surgery and radiation therapy, have demonstrated very limited efficacy in late-stage cancers.
Amidst the ongoing efforts to develop more precise and effective anti-cancer therapeutics, T-cell therapies have evolved as a promising immunotherapy that uses the body's own immune cells to selectively eliminate tumor cells with minimal side effects. Unlike conventional therapies, immunotherapies provide several advantages, including specificity, potential reduction in off-target toxicities and improving treatment outcomes. It is worth mentioning that in 2024, the US Food and Drug Administration approved multiple T cell therapies targeting cancer (in reverse chronological order), such as Obecabtagene autoleucel / Aucatzyl (relapsed or refractory B-cell precursor acute lymphoblastic leukemia, November 2024), Afamitresgene autoleucel / TECELRA (metastatic or unresectable synovial sarcoma, August 2024) and Lifileucel / Amtagvi (unresectable or metastatic melanoma, February 2024).
Driven by the advantages offered by immunotherapies over conventional therapies, the increasing adoption of T-cell-based immunotherapies and the surge in demand for personalized cancer treatment, coupled with the expedited regulatory approvals, is expected to drive significant growth in the T cell therapeutics market. Moreover, as the global oncology landscape continues to evolve, advancements in T cell engineering and next-generation manufacturing technologies would drive innovation in this domain and position the market for steady growth in the forthcoming years.
T-CELL THERAPY MARKET: KEY INSIGHTS
The report delves into the current state of the T cell therapy market and identifies potential growth opportunities within industry. Some key findings from the report include:
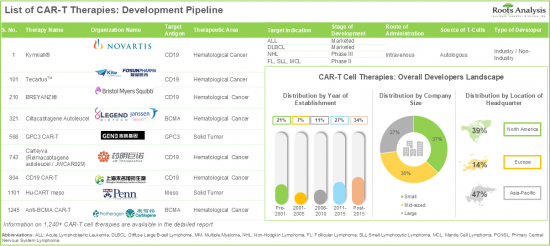
- With over 10 approved therapies and more than 1,200 preclinical / clinical therapy candidates, CAR-T immunotherapies represent one of the most active segments of the pharmaceutical domain.
- More than 75% of the therapy candidates, which are being developed to target a range of disease indications, are autologous in nature; notably, CD19 and BCMA have emerged as the most popular target antigens.
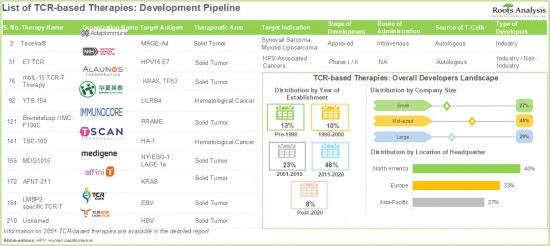
- Presently, there are over 205 TCR-based therapies that are approved / under clinical stages of development; notably, the current landscape is dominated (38%) by mid-sized players based in Europe.
- Close to 35% of the TCR immunotherapies in the clinical development pipeline are being developed to target oncological disorders in adults, children and senior citizens.
- Over 85 TIL-based immunotherapies have been either approved or are currently under development; of these, most of the immunotherapies are being developed by players based in North America to target melanoma.
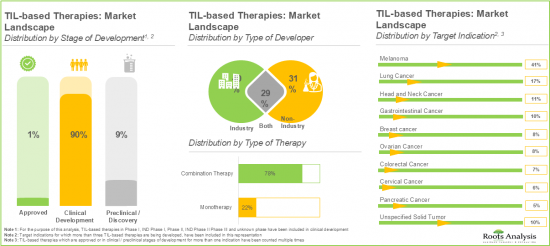
- Majority (58) of the TIL-based therapies are being used in combination with various therapeutic agents; of these, more than 45% of the immunotherapies are being developed by non-industry players.
- Extensive efforts are underway to improve the CAR constructs across successive generations, involving alterations in the scFv region and using different types of gene delivery vectors.
- In the last few years, over 970 clinical trials have been registered across different geographies for CAR-T therapies; extensive efforts are underway to improve successive generations of therapies.
- The growing interest of stakeholders is evident from the increasing partnership activity in this domain; close to 45% of the total number of partnerships have been signed between players based in North America.
- Several investors, having realized the opportunity within this upcoming segment of cancer immunotherapy, have invested more than USD 32 billion, across 370+ funding rounds in the past few years.
- More than 11,900 patents related to CAR-T cell therapies have been filed / granted to protect the intellectual property generated within this field.
- Apart from CAR-T, TCR and TIL-based products, close to 205 other T-cell immunotherapies are marketed / under development for the treatment of a myriad of oncological and non-oncological indications.
- Close to 200 players claim to have the required capabilities to manufacture different types of cell therapies; such firms also offer a wide range of services across different stages of product development.
- Given the growing prevalence of cancer, technological developments and ongoing approvals, the market for T-cell therapies is poised to witness a steady growth in the foreseen future.
- With a growing focus on the development pipeline and encouraging clinical trial outcomes, the market is expected to witness an annualized growth rate of over 12%, during the next decade.
T-CELL THERAPY MARKET: KEY SEGMENTS
CAR T-cell Therapy Market Holds the Largest Share of the T-Cell Therapy Market During the Forecast Period
Based on the type of therapy, the global market is segmented into CAR-T, TCR and TIL therapies. Currently, the CAR T-cell therapy market segment captures the majority of the overall market share and is likely to dominate and drive the overall market growth. This can be attributed to the precise targeting mechanism of CAR T cell therapies that use chimeric antigen receptors to target and kill malignant cells (while minimizing damage to healthy tissues). It is worth highlighting that the TIL therapy market segment is likely to flourish during the forecast period, owing to their versatility in targeting a wide range of cancers and encouraging clinical trial results.
Therapies Targeting Melanoma Hold the Largest Share of TCR Therapies Market
Based on the target indication, the T-cell therapy market is segmented into multiple myeloma, large B-cell lymphoma, acute lymphoblastic leukemia, diffuse large b-cell lymphoma, diffuse large b-cell lymphoma, primary mediastinal large B-Cell lymphoma, transformed follicular lymphoma and high grade B-cell lymphoma, acute lymphoblastic leukemia / B-cell Non-Hodgkin lymphoma, Non-Hodgkin lymphoma, mantle cell lymphoma, acute myeloid leukemia, generalized myasthenia gravis (MG), renal transplantation (HLA-A2), gastric adenocarcinoma, ovarian / endometrial cancer, chronic lymphocytic leukemia, follicular lymphoma, renal cell carcinoma, melanoma, basal cell carcinoma, lung cancer, sarcoma, head and neck cancer, cervical cancer, neuro gastro-intestinal (GI) Cancer, breast cancer, hepatocellular carcinoma, nasopharyngeal carcinoma and ovarian cancer.
Currently, the majority share of the TCR therapies market is captured by therapies targeting melanoma (over 95%). This can be attributed to the fact that melanoma has a high rate of genetic mutations, leading to the production of many unique neoantigens which makes it a prime target for TCR therapies. Recently, the FDA has approved a TCR therapy (Kimmtrak) which is used to treat adults with metastatic uveal melanoma (a type of intraocular melanoma).
Therapies Targeting CD19 Antigen are Likely to Dominate the CAR-T Therapy market During the Forecast Period
Based on the type of target antigens, the T-cell therapy market is segmented into BCMA, CD19, CD20, CD19 and CD22, HLA, MAGE, PRAME, NY-ESO-1 and LAGE, EBV, HBV and others. Currently, therapies targeting CD19 antigen dominate the CAR-T therapies market, accounting for more than 65% of the overall market share. This dominance is primarily driven by the essential role of CD19 as it is a highly specific antigen expressed on B-cells, making it an ideal target for treating B-cell malignancies like leukemia and lymphoma.
North America Accounts for the Largest Share of the overall TCR therapy Market
Based on geographical regions, the market is segmented into North America, Europe, Asia-Pacific, Latin America and Middle East and North Africa, and the rest of the world. In the current scenario, North America is likely to capture the largest market share owing to the robust research and development infrastructure, a strong commercial base for cell therapies, and a high number of clinical trials being conducted in the region.
However, it is worth noting that the market for TCR therapies in Asia-Pacific is expected to grow at a relatively faster pace (CAGR of more than 45%), during the forecast period. This is driven by the increasing cases of cancer in the region, supported by the demand for curative treatments. Notably, it has been highlighted by industry experts that the cell therapy industry in China has witnessed growing interest from investment firms, enabling faster clinical research for T-cell therapies.
Example Players in the T-Cell Therapy Market
- Adaptimmune Therapeutics
- AbelZeta
- Alaunos Therapeutics
- Autolus Therapeutics
- bluebird bio
- Bristol Myers Squibb
- CARsgen Therapeutics
- Cellectis
- Gilead Sciences
- Immatics
- Immunocore
- Innovative Cellular Therapeutics
- Iovance Biotherapeutics
- Kuur Therapeutics
- Lion TCR
- Noile-Immune Biotech
- Novartis
- Takara Bio
- Wellington Zhaotai Therapies
- Zelluna immunotherapy
Primary Research Overview
The opinions and insights presented in this study were influenced by discussions conducted with multiple stakeholders. The research report features detailed transcripts of interviews held with the following industry stakeholders:
- Chief Executive Officer, Mid-sized Company, China
- Chief Operating Officer and Executive Vice President, Small Company, France
- Former Co-Founder and Chief Executive Officer, Mid-sized Company, UK
- Former Chief Executive Officer, Small Company, Netherlands
- Former Chief Executive Officer, Mid-sized Company, Australia
- Former Vice President, Immuno-Oncology, Mid-sized Company, Belgium
- Director, Business Development, Small Company, US
- Former Director, Process Development, Large Company, US
- Former Research Head, Large Company, US
- Former Competitive Intelligence Manager, Strategy & Business Development, Small Company, US
- Professor of Medicine and Director, Department of Oncology, Hospital, China
- Assistant Professor of Medicine, University, US
T-CELL THERAPY MARKET: RESEARCH COVERAGE
The report on T-cell therapy market features insights into various sections, including:
- Market Sizing and Opportunity Analysis: An in-depth analysis of T-cell therapy market, focusing on key market segments, including [A] type of therapy, [B] target indication, [C] target antigen, [D] company size, [E] geographical regions, [F] leading players, and [G] sales forecast (of more than 55 T-cell therapies).
- CAR-T cell therapies Market Landscape: A comprehensive evaluation of CAR-T cell therapies, based on several relevant parameters, such as [A] type of developer, [B] stage of development, [C] therapeutic area, [D] target indication, [E] target antigen, [F] source of T-cells, [G] route of administration, [H] dosing frequency, [I] patient segment, [J] type of therapy, [K] most active industry players, and [L] most active non-industry players.
- CAR-T cell therapies Developer Landscape: The report features a list of players engaged in the development of CAR-T cell therapies offered, along with analyses based on [A] year of establishment, [B] company size, and [C] location of headquarters.
- TCR-based therapies Market Landscape: A comprehensive evaluation of TCR-based therapies, based on several relevant parameters, such as [A] stage of development, [B] therapeutic area, [C] target indication, [D] target antigen, [E] source of T-cells, [F] route of administration, [G] dosing frequency, [H] target patient segment, [I] type of therapy, [J] most active industry players, and [K] most active non-industry players.
- TCR-based therapies Developer Landscape: The report features a list of players engaged in the development of TCR-based therapies offered, along with analyses based on [A] year of establishment, [B] company size, and [C] location of headquarters.
- TIL-based therapies Market Landscape: A comprehensive evaluation of TIL-based therapies, based on several relevant parameters, such as [A] type of developer, [B] stage of development, [C] route of administration, [D] dosing frequency, [E] patient segment, [F] type of therapy, [G] most active industry players, and [H] most active non-industry players.
- TIL-based therapies Developer Landscape: The report features a list of players engaged in the development of TIL-based therapies offered, along with analyses based on [A] year of establishment, [B] company size, and [C] location of headquarters.
- Key Insights Analysis: An in-depth analysis of key insights derived from the study featuring a competitive analysis, highlighting the popular target antigens related to hematological malignancies and solid tumors. Additionally, it includes CAR construct analysis of clinical-stage CAR-T therapies, based on various relevant parameters, such as [A] generation of CAR, [B] type of binding domain, [C] type of virus used, [D] type of gene transfer method used, and [E] type of co-stimulatory domain used.
- Clinical Trial Analysis: A detailed analysis of completed, ongoing, and planned clinical studies related to CAR-Ts, TCRs, and TIL, based on several relevant parameters, such as [A] trial registration year, [B] enrolled patient population, [C] trial recruitment status, [D] trial phase, [E] target patient segment, [F] type of sponsor/collaborator, [G] most active players, and [H] regional distribution of trials.
- Key Opinion Leaders (KOLs) Analysis: A comprehensive evaluation of various principal investigators (considered as key opinion leaders in this domain) involved in clinical trials related to CAR-Ts, TCRs and TILs. The section presents detailed analyses, comparing the relative expertise of KOLs based on a proprietary scoring criterion and that of a third party.
- Therapy Profiles: Elaborate profiles of marketed and mid- to late-stage clinical therapies (phase I / II or above) related to CAR-Ts, TCRs and TILs, providing insights on [A] overview of the therapy, [B] mechanism of action of therapy, [C] dosage information, [D] details on the cost, and sales information (wherever available), [E] clinical development plan, and [F] key clinical trial results.
- Emerging Technologies: A detailed discussion on innovative technology platforms that are being used for the development of T-cell therapies, along with profiles of key technology providers, and a relative competitiveness analysis of different gene editing platforms (used for the development of T-cell therapies), based on various parameters, such as [A] ease of system design, [B] cost of technology, [C] level of toxicity, and [D] efficiency of technology.
- Partnerships and Collaborations: An insightful analysis of the deals inked by stakeholders in T-Cell therapy market, based on several parameters, such as [A] year of partnership, [B] type of product, [D] type of partner, [E] most popular products, [F] most active industry players, [G] most active non-industry players and [H] geographical distribution of partnership activity.
- Funding and Investment Analysis: An in-depth analysis of the fundings raised by companies that have proprietary T-cell based products/technologies, based on relevant parameters, such as [A] year of funding, [B] type of funding, [C] amount invested (USD million), [D] type of therapy, [E] type of investor, [F] most active players, [G] most active investors, and [H] geography.
- Patents Analysis: An in-depth analysis of patents filed / granted till 2022 related to CAR-Ts, TCRs and TILs, based on various relevant parameters, such as [A] type of patent, [B] publication year, [C] geographical distribution, [D] Cooperative Patent Classification (CPC) symbols, [E] emerging focus areas, [F] type of applicant, [G] leading players, [H] patent benchmarking, and [I] patent valuation analysis.
- Other T-Cell Immunotherapies: An overview on other T-cell-based therapies, apart from CAR-Ts, TCRs and TILs, including a detailed analysis of approved / pipeline products, which are analyzed based on various parameters, such as [A] phase of development, [B] target therapeutic area(s), [C] type of T-cells used, [D] and source of T-cells.
- Case Study: A detailed assessment of manufacturing cell therapy products, highlighting the key challenges, and a detailed list of contract service providers and in-house manufacturers involved in this space. It provides information about these manufacturers, focusing on details of [A] scale of operation, [B] compliance with cGMP standards, [C] location of the manufacturing facility, and [D] products being manufactured.
- Cost-Price Analysis: A detailed analysis of various factors that form the basis for the pricing of cell-based therapies. It features different models / approaches that a pharmaceutical company may choose to adopt to decide the price of a T-cell based immunotherapy that is likely to be marketed in the coming years.
- Promotional Analysis: A review of the key promotional strategies being adopted by the developers of the approved CAR-T cell therapies, namely Kymriah(R), Yescarta(R), Tecartus(TM), Breyanzi(R), Abecma(TM), Carvykti(TM) and TCR-based therapy (Kimmtrak(R)).
- Company Profiles: In-depth profiles of several developers evaluating T-cell immunotherapy therapies for the treatment of various oncological and non-oncological indications, focusing on [A] company overviews, [B] financial information (if available), [C] T-cell therapy (CAR-T, TCR and TIL) specific portfolio, [D] technology portfolio (if available), [E] manufacturing capabilities (if available), [F] recent collaborations , and [G] funding and investments received by the company related to T-cell immunotherapies.
KEY QUESTIONS ANSWERED IN THIS REPORT
- How many companies are currently engaged in this market?
- Which are the leading companies in this market?
- What factors are likely to influence the evolution of this market?
- What is the current and future market size?
- What is the CAGR of this market?
- How is the current and future market opportunity likely to be distributed across key market segments?
- What kind of partnership models are commonly adopted by industry stakeholders?
- What is the ongoing investment trend in this market?
- What is the patent filing activity trend in the market?
REASONS TO BUY THIS REPORT
- The report provides a comprehensive market analysis, offering detailed revenue projections of the overall market and its specific sub-segments. This information is valuable to both established market leaders and emerging entrants.
- Stakeholders can leverage the report to gain a deeper understanding of the competitive dynamics within the market. By analyzing the competitive landscape, businesses can make informed decisions to optimize their market positioning and develop effective go-to-market strategies.
- The report offers stakeholders a comprehensive overview of the market, including key drivers, barriers, opportunities, and challenges. This information empowers stakeholders to stay abreast of market trends and make data-driven decisions to capitalize on growth prospects.
ADDITIONAL BENEFITS
- Complimentary PPT Insights Packs
- Complimentary Excel Data Packs for all Analytical Modules in the Report
- 10% Free Content Customization
- Detailed Report Walkthrough Session with Research Team
- Free Updated report if the report is 6-12 months old or older
TABLE OF CONTENTS
1. PREFACE
- 1.1. Introduction
- 1.2. Market Share Insights
- 1.3. Key Market Insights
- 1.4. Report Coverage
- 1.5. Key Questions Answered
- 1.6. Chapter Outlines
2. RESEARCH METHODOLOGY
- 2.1. Chapter Overview
- 2.2. Research Assumptions
- 2.2.1. Market Landscape and Market Trends
- 2.2.2. Market Forecast and Opportunity Analysis
- 2.2.3. Comparative Analysis
- 2.3. Database Building
- 2.3.1. Data Collection
- 2.3.2. Data Validation
- 2.3.3. Data Analysis
- 2.4. Project Methodology
- 2.4.1. Secondary Research
- 2.4.1.1. Annual Reports
- 2.4.1.2. Academic Research Papers
- 2.4.1.3. Company Websites
- 2.4.1.4. Investor Presentations
- 2.4.1.5. Regulatory Filings
- 2.4.1.6. White Papers
- 2.4.1.7. Industry Publications
- 2.4.1.8. Conferences and Seminars
- 2.4.1.9. Government Portals
- 2.4.1.10. Media and Press Releases
- 2.4.1.11. Newsletters
- 2.4.1.12. Industry Databases
- 2.4.1.13. Roots Proprietary Databases
- 2.4.1.14. Paid Databases and Sources
- 2.4.1.15. Social Media Portals
- 2.4.1.16. Other Secondary Sources
- 2.4.2. Primary Research
- 2.4.2.1. Types of Primary Research
- 2.4.2.1.1. Qualitative Research
- 2.4.2.1.2. Quantitative Research
- 2.4.2.1.3. Hybrid Approach
- 2.4.2.2. Advantages of Primary Research
- 2.4.2.3. Techniques for Primary Research
- 2.4.2.3.1. Interviews
- 2.4.2.3.2. Surveys
- 2.4.2.3.3. Focus Groups
- 2.4.2.3.4. Observational Research
- 2.4.2.3.5. Social Media Interactions
- 2.4.2.4. Key Opinion Leaders Considered in Primary Research
- 2.4.2.4.1. Company Executives (CXOs)
- 2.4.2.4.2. Board of Directors
- 2.4.2.4.3. Company Presidents and Vice Presidents
- 2.4.2.4.4. Research and Development Heads
- 2.4.2.4.5. Technical Experts
- 2.4.2.4.6. Subject Matter Experts
- 2.4.2.4.7. Scientists
- 2.4.2.4.8. Doctors and Other Healthcare Providers
- 2.4.2.5. Ethics and Integrity
- 2.4.2.5.1. Research Ethics
- 2.4.2.5.2. Data Integrity
- 2.4.2.1. Types of Primary Research
- 2.4.3. Analytical Tools and Databases
- 2.4.1. Secondary Research
- 2.5. Robust Quality Control
3. MARKET DYNAMICS
- 3.1. Chapter Overview
- 3.2. Forecast Methodology
- 3.2.1. Top-down Approach
- 3.2.2. Bottom-up Approach
- 3.2.3. Hybrid Approach
- 3.3. Market Assessment Framework
- 3.3.1. Total Addressable Market (TAM)
- 3.3.2. Serviceable Addressable Market (SAM)
- 3.3.3. Serviceable Obtainable Market (SOM)
- 3.3.4. Currently Acquired Market (CAM)
- 3.4. Forecasting Tools and Techniques
- 3.4.1. Qualitative Forecasting
- 3.4.2. Correlation
- 3.4.3. Regression
- 3.4.4. Extrapolation
- 3.4.5. Convergence
- 3.4.6. Sensitivity Analysis
- 3.4.7. Scenario Planning
- 3.4.8. Data Visualization
- 3.4.9. Time Series Analysis
- 3.4.10. Forecast Error Analysis
- 3.5. Key Considerations
- 3.5.1. Demographics
- 3.5.2. Government Regulations
- 3.5.3. Reimbursement Scenarios
- 3.5.4. Market Access
- 3.5.5. Supply Chain
- 3.5.6. Industry Consolidation
- 3.5.7. Pandemic / Unforeseen Disruptions Impact
- 3.6. Limitations
4. MACRO-ECONOMIC INDICATORS
- 4.1. Chapter Overview
- 4.2. Market Dynamics
- 4.2.1. Time Period
- 4.2.1.1. Historical Trends
- 4.2.1.2. Current and Forecasted Estimates
- 4.2.2. Currency Coverage
- 4.2.2.1. Major Currencies Affecting the Market
- 4.2.2.2. Factors Affecting Currency Fluctuations on the Industry
- 4.2.2.3. Impact of Currency Fluctuations on the Industry
- 4.2.3. Foreign Currency Exchange Rate
- 4.2.3.1. Impact of Foreign Exchange Rate Volatility on the Market
- 4.2.3.2. Strategies for Mitigating Foreign Exchange Risk
- 4.2.4. Recession
- 4.2.4.1. Assessment of Current Economic Conditions and Potential Impact on the Market
- 4.2.4.2. Historical Analysis of Past Recessions and Lessons Learnt
- 4.2.5. Inflation
- 4.2.5.1. Measurement and Analysis of Inflationary Pressures in the Economy
- 4.2.5.2. Potential Impact of Inflation on the Market Evolution
- 4.2.6. Interest Rates
- 4.2.6.1. Interest Rates and Their Impact on the Market
- 4.2.6.2. Strategies for Managing Interest Rate Risk
- 4.2.7. Commodity Flow Analysis
- 4.2.7.1. Type of Commodity
- 4.2.7.2. Origins and Destinations
- 4.2.7.3. Values and Weights
- 4.2.7.4. Modes of Transportation
- 4.2.8. Global Trade Dynamics
- 4.2.8.1. Import Scenario
- 4.2.8.2. Export Scenario
- 4.2.8.3. Trade Policies
- 4.2.8.4. Strategies for Mitigating the Risks Associated with Trade Barriers
- 4.2.8.5. Impact of Trade Barriers on the Market
- 4.2.9. War Impact Analysis
- 4.2.9.1. Russian-Ukraine War
- 4.2.9.2. Israel-Hamas War
- 4.2.10. COVID Impact / Related Factors
- 4.2.10.1. Global Economic Impact
- 4.2.10.2. Industry-specific Impact
- 4.2.10.3. Government Response and Stimulus Measures
- 4.2.10.4. Future Outlook and Adaptation Strategies
- 4.2.11. Other Indicators
- 4.2.11.1. Fiscal Policy
- 4.2.11.2. Consumer Spending
- 4.2.11.3. Gross Domestic Product
- 4.2.11.4. Employment
- 4.2.11.5. Taxes
- 4.2.11.6. Stock Market Performance
- 4.2.11.7. Cross Border Dynamics
- 4.2.1. Time Period
- 4.3. Conclusion
5. EXECUTIVE SUMMARY
6. INTRODUCTION
- 6.1. Chapter Overview
- 6.2. Pillars of Cancer Therapy
- 6.3. Overview of Immunotherapies
- 6.4. Fundamentals of Cancer Immunotherapy
- 6.5. Classification of Cancer Immunotherapies
- 6.5.1. By Mechanism of Action
- 6.5.1.1. Active Immunotherapy
- 6.5.1.2. Passive Immunotherapy
- 6.5.2. By Type of Target
- 6.5.3. By Approach
- 6.5.3.1. Activation and Suppression Immunotherapy
- 6.5.4. By Product Class
- 6.5.4.1. Monoclonal Antibodies
- 6.5.4.2. Bispecific Antibodies
- 6.5.4.3. Cytokines
- 6.5.4.4. Oncolytic Virus Therapy
- 6.5.4.5. Therapeutic Cancer Vaccines
- 6.5.4.6. Cell-based Therapies
- 6.5.1. By Mechanism of Action
- 6.6. T-Cell Immunotherapies
- 6.6.1. Historical Evolution
- 6.6.2. Key Considerations for Developing T-Cell Immunotherapies
- 6.6.3. Strategies Employed for the Redirection of T-Cells
- 6.6.4. Manufacturing of Engineered T-Cells
- 6.6.5. T-Cell Transduction and Transfection Methods
- 6.6.5.1. Retroviral Vectors
- 6.6.5.2. Lentiviral Vectors
- 6.6.5.3. Non-viral Transfection Methods
- 6.7. Chimeric Antigen Receptor T-Cell (CAR-T) Therapy
- 6.7.1. Development History
- 6.7.2. Anatomical Layout of CAR
- 6.7.2.1. Ectodomain
- 6.7.2.2. Transmembrane (TM) Domain
- 6.7.2.3. Endodomain
- 6.7.3. Development of CAR-T Cells
- 6.7.4. Universal CAR-T Cells
- 6.7.5. Route of Administration
- 6.7.6. Case Study on CD19 CAR-T Therapies
- 6.7.6.1. Other Important Biological Targets for CAR Development
- 6.7.7. Challenges Associated with Use of CAR-T Therapies
- 6.7.7.1. Competitive Risks
- 6.7.7.2. Clinical Risks
- 6.7.7.3. Regulatory Risks
- 6.7.3.4. Commercial Risks
- 6.8. T-Cell Receptor (TCR)-based Cell Therapy
- 6.8.1. Development History
- 6.8.2. Anatomical Layout of TCR
- 6.8.3. Development of TCR Therapy
- 6.8.4. Comparison of CAR-T and TCR-based Therapies
- 6.9. Tumor Infiltrating Lymphocyte (TIL)-based Cell Therapy
- 6.9.1. Development History
- 6.9.2. Development of TILs Therapy
- 6.10. Key Benefits and Roadblocks
- 6.11. Concluding Remarks
7. CAR-T THERAPIES: MARKET LANDSCAPE
- 7.1. Chapter Overview
- 7.2. CAR-T Therapies: Overall Market Landscape
- 7.2.1. Analysis by Stage of Development
- 7.2.2. Analysis by Type of Therapy
- 7.2.3. Analysis by Target Antigen
- 7.2.4. Analysis by Target Indication
- 7.2.5. Analysis by Therapeutic Area
- 7.2.6. Analysis by Stage of Development and Therapeutic Area
- 7.2.7. Analysis by Source of T-cells
- 7.2.8. Analysis by Stage of Development and Source of T-cells
- 7.2.9. Analysis by Route of Administration
- 7.2.10. Analysis by Dosing Frequency
- 7.2.11. Analysis by Target Patient Segment
- 7.2.12. Most Active Industry Players: Analysis by Number of CAR-T Therapies Developed
- 7.2.13. Most Active Non-Industry Players: Analysis by Number of CAR-T Therapies Developed
- 7.3. CAR-T Therapies: Overall Developer Landscape
- 7.3.1. Analysis by Year of Establishment
- 7.3.2. Analysis by Company Size
- 7.3.3. Analysis by Location of Headquarters
8. TCR-BASED THERAPIES: MARKET LANDSCAPE
- 8.1. Chapter Overview
- 8.2. TCR-based Therapies: Approved and Clinical Pipeline
- 8.3. TCR-based Therapies: Preclinical Pipeline
- 8.4. TCR-based Therapies: Overall Market Landscape
- 8.4.1. Analysis by Stage of Development
- 8.4.2. Analysis by Therapeutic Area
- 8.4.3. Analysis by Stage of Development and Therapeutic Area
- 8.4.4. Analysis by Target Indication
- 8.4.5. Analysis by Target Antigen
- 8.4.6. Analysis by Source of T-Cells
- 8.4.7. Analysis by Route of Administration
- 8.4.8. Analysis by Dosing Frequency
- 8.4.9. Analysis by Target Patient Segment
- 8.4.10. Analysis by Type of Therapy
- 8.4.11. Analysis by Stage of Development and Type of Therapy
- 8.4.11. Most Active Industry Players: Analysis by Number of TCR-based Therapies Developed
- 8.4.13. Most Active Non-Industry Players: Analysis by Number of TCR-based Therapies Developed
- 8.5. TCR-based Therapies: Overall Developer Landscape
- 8.5.1. Analysis by Year of Establishment
- 8.5.2. Analysis by Company Size
- 8.5.3. Analysis by Location of Headquarters
9. TIL-BASED THERAPIES: MARKET LANDSCAPE
- 9.1. Chapter Overview
- 9.2. TIL-based Therapies: Approved and Clinical Pipeline
- 9.3. TIL-based Therapies: Preclinical Pipeline
- 9.4. TIL-based Therapies: Overall Market Landscape
- 9.4.1. Analysis by Type of Developer
- 9.4.2. Analysis by Stage of Development
- 9.4.3. Analysis by Route of Administration
- 9.4.4. Analysis by Dosing Frequency
- 9.4.5. Analysis by Target Patient Segment
- 9.4.6. Analysis by Type of Therapy
- 9.4.7. Analysis by Target Indication
- 9.4.8. Most Active Industry Players: Analysis by Number of TIL-based Therapies Developed
- 9.4.9. Most Active Non-Industry Players: Analysis by Number of TIL-based Therapies Developed
- 9.5. TIL-based Therapies: Overall Developer Landscape
- 9.5.1. Analysis by Year of Establishment
- 9.5.2. Analysis by Company Size
- 9.3.3. Analysis by Location of Headquarters
10. KEY INSIGHTS
- 10.1. Chapter Overview
- 10.2. CAR-T Therapies: Popular Target Antigens
- 10.2.1. Popular Target Antigens for Hematological Malignancies
- 10.2.2. Popular Targets Antigens for Solid Tumors
- 10.3. CAR-T Therapies: CAR Construct Analysis
- 10.3.1. Analysis by Generation of CAR
- 10.3.2. Analysis by Type of scFv Antibody Used
- 10.3.3. Analysis by Type of Virus Used
- 10.3.4. Analysis by Type of Gene Transfer Method Used
- 10.3.5. Analysis by Type of Co-Stimulatory Domain
11. CLINICAL TRIAL ANALYSIS
- 11.1. Chapter Overview
- 11.2. Scope and Methodology
- 11.3. CAR-T Therapies: Clinical Trial Analysis
- 11.3.1. Analysis by Trial Registration Year
- 11.3.2. Analysis of Number of Patient Enrolled by Trial Registration Year
- 11.3.3. Analysis by Trial Phase
- 11.3.4. Analysis of Number of Patient Enrolled by Trial Phase
- 11.3.5. Analysis by Trial Registration Year and Trial Phase
- 11.3.6. Analysis by Trial Status
- 11.3.7. Analysis by Patient Gender
- 11.3.8. Analysis by Therapeutic Area
- 11.3.9. Analysis by Study Design
- 11.3.9.1. Analysis by Type of Trial Masking
- 11.3.9.2. Analysis by Type of Intervention Model
- 11.3.9.3. Analysis by Type of Trial Purpose
- 11.3.9.4. Analysis by Type of Design Allocation
- 11.3.10. Most Active Sponsor / Collaborator: Analysis by Number of Registered Trials
- 11.3.10.1. Analysis by Leading Industry Players
- 11.3.10.2. Analysis by Leading Non-Industry Players
- 11.3.11. Analysis by Geography
- 11.3.11.1. Analysis of Clinical Trials by Trial Status and Geography
- 11.3.11.2. Analysis of Patients Enrolled by Trail Status and Geography
- 11.4. TCR-based Therapies: Clinical Trial Analysis
- 11.4.1. Analysis by Trial Registration Year
- 11.4.2. Analysis by Trial Registration Year and Patient Enrolled
- 11.4.3. Analysis by Trial Status
- 11.4.4. Analysis by Trial Registration Year and Trial Status
- 11.4.5. Analysis by Trial Phase
- 11.4.6. Analysis of Patient Enrolled by Trial Phase
- 11.4.7. Analysis by Target Patient Segment
- 11.4.8. Analysis by Type of Sponsor / Collaborator
- 11.4.9. Analysis by Study Design
- 11.4.10. Most Active Industry Players: Analysis by Number of Registered Trials
- 11.4.11. Most Active Non-Industry Players: Analysis by Number of Registered Trials
- 11.4.12. Analysis by Key Focus Areas (Word Cloud Representation)
- 11.4.13. Analysis of Clinical Trials by Geography
- 11.4.14. Analysis of Patient Enrolled by Geography
- 11.5. TIL-based Therapies: Clinical Trial Analysis
- 11.5.1. Analysis by Trial Registration Year
- 11.5.2. Analysis by Trial Registration Year and Patient Enrolled
- 11.5.3. Analysis by Trial Status
- 11.5.4. Analysis by Trial Registration Year and Trial Status
- 11.5.5. Analysis by Trial Phase
- 11.5.6. Analysis of Patient Enrolled by Trial Phase
- 11.5.7. Analysis by Target Patient Segment
- 11.5.8. Analysis by Type of Sponsor / Collaborator
- 11.5.9. Analysis by Study Design
- 11.5.10. Most Active Industry Players: Analysis by Number of Registered Trials
- 11.5.11. Most Active Non-Industry Players: Analysis by Number of Registered Trials
- 11.5.12. Analysis by Key Focus Areas (Word Cloud Representation)
- 11.5.13. Analysis of Clinical Trials by Geography
- 11.5.14. Analysis of Patient Enrolled by Geography
12. KEY OPINION LEADERS
- 12.1. Chapter Overview
- 12.2. Assumptions and Key Parameters
- 12.3. Methodology
- 12.4. CAR-T Therapies: Key Opinion Leaders
- 12.4.1. Analysis by Type of Organization
- 12.4.2. Analysis by Affiliated Organization
- 12.4.3. Analysis by Qualification
- 12.4.4. Analysis by Geographical Location of KOLs
- 12.4.5. KOL Activeness versus KOL Strength
- 12.4.6. Most Prominent KOLs: Analysis by RA score
- 12.4.7. Most Prominent KOLs: Comparison of RA Score and Third-Party Score
- 12.5. TCR-based Therapies: Key Opinion Leaders
- 12.5.1. Analysis by Type of Organization
- 12.5.2. Analysis by Affiliated Organization
- 12.5.3. Analysis by Qualification
- 12.5.4. Analysis by Geographical Location of KOLs
- 12.5.5. KOL Activeness versus KOL Strength
- 12.5.6. Most Prominent KOLs: Analysis by RA score
- 12.5.7. Most Prominent KOLs: Comparison of RA Score and Third-Party Score
- 12.6. TIL-based Therapies: Key Opinion Leaders
- 12.6.1. Analysis by Type of Organization
- 12.6.2. Analysis by Affiliated Organization
- 12.6.3. Analysis by Qualification
- 12.6.4. Analysis by Geographical Location of KOLs
- 12.6.5. KOL Activeness versus KOL Strength
- 12.6.6. Most Prominent KOLs: Analysis by RA score
- 12.6.7. Most Prominent KOLs: Comparison of RA Score and Third-Party Score
13. CAR-T THERAPY PROFILES
- 13.1. Chapter Overview
- 13.2. Kymriah / Tisagenlecleucel / CTL019 (Novartis)
- 13.2.1. Therapy Overview
- 13.2.2. Clinical Trial Information
- 13.2.3. Clinical Trial Endpoints
- 13.2.4. Clinical Trial Results
- 13.2.5. Estimated Sales Revenues
- 13.3. Yescarta / Axiscabtagene Ciloleucel / KTE-C19 (Gilead Sciences)
- 13.3.1. Therapy Overview
- 13.3.2. Clinical Trial Information
- 13.3.3. Clinical Trial Endpoints
- 13.3.4. Clinical Trial Results
- 13.3.5. Estimated Sales Revenues
- 13.4. Tecartus / Brexucabtagene Autoleucel (Gilead Sciences)
- 13.4.1. Therapy Overview
- 13.4.2. Clinical Trial Information
- 13.4.3. Clinical Trial Endpoints
- 13.4.4. Clinical Trial Results
- 13.4.5. Estimated Sales Revenues
- 13.5. Breyanzi / Lisocabtagene Maraleucel / JCAR017 (Bristol Myers Squibb)
- 13.5.1. Therapy Overview
- 13.5.2. Clinical Trial Information
- 13.5.3. Clinical Trial Endpoints
- 13.5.4. Clinical Trial Results
- 13.5.5. Estimated Sales Revenues
- 13.6. Abecma / BB2121 / Idecabtagene Vicleucel (Bristol Myers Squibb)
- 13.6.1. Therapy Overview
- 13.6.2. Clinical Trial Information
- 13.6.3. Clinical Trial Endpoints
- 13.6.4. Clinical Trial Results
- 13.6.5. Estimated Sales Revenues
- 13.7. Carvykti / Ciltacabtagene Autoleucel / LCAR-B38M CAR-T / JNJ-68284528 (Janssen)
- 13.7.1. Therapy Overview
- 13.7.2. Clinical Trial Information
- 13.7.3. Clinical Trial Endpoints
- 13.7.4. Clinical Trial Results
- 13.7.5. Estimated Sales Revenues
- 13.8. Carteyva / Relmacabtagene Autoleucel / JWCAR029 (JW Therapeutics)
- 13.8.1. Therapy Overview
- 13.8.2. Clinical Trial Information
- 13.8.3. Clinical Trial Endpoints
- 13.8.4. Clinical Trial Results
- 13.8.5. Estimated Sales Revenues
- 13.9. TBI-1501 / CD19 CAR-T Cell Therapy (Takara Bio)
- 13.9.1. Therapy Overview
- 13.9.2. Clinical Trial Information
- 13.9.3. Clinical Trial Endpoints
- 13.10. AUTO1 / Obecabtagene Autoleucel / obe-cel (Autolus)
- 13.10.1. Therapy Overview
- 13.10.2. Clinical Trial Information
- 13.10.3. Clinical Trial Endpoints
- 13.10.4. Clinical Trial Results
- 13.10.5. Estimated Sales Revenues
- 13.11. AUTO3 / CD19/22 CAR-T (Autolus)
- 13.11.1. Therapy Overview
- 13.11.2. Clinical Trial Information
- 13.11.3. Clinical Trial Endpoints
- 13.11.4. Clinical Trial Results
- 13.11.5. Estimated Sales Revenues
14. TCR-BASED THERAPY PROFILES
- 14.1. Chapter Overview
- 14.2. Kimmtrak / IMCgp100 / Tebentafusp (Immunocore)
- 14.2.1. Therapy Overview
- 14.2.2. Clinical Trial Information
- 14.2.3. Clinical Trial Endpoints
- 14.2.4. Clinical Trial Results
- 14.2.5. Estimated Sales Revenues
- 14.3. GSK3377794 / NY-ESO-1C259 T-Cells / Letetresgene Autoleucel (GlaxoSmithKline)
- 14.3.1. Therapy Overview
- 14.3.2. Clinical Trial Information
- 14.3.3. Clinical Trial Endpoints
- 14.3.4. Clinical Trial Results
- 14.3.5. Estimated Sales Revenues
- 14.4. ADP-A2M4 / Afamitresgene Autoleucel / Afami-cel (Adaptimmune Therapeutics)
- 14.4.1. Therapy Overview
- 14.4.2. Clinical Trial Information
- 14.4.3. Clinical Trial Endpoints
- 14.4.4. Clinical Trial Results
- 14.4.5. Estimated Sales Revenues
- 14.5. JTCR016 (Juno Therapeutics)
- 14.5.1. Therapy Overview
- 14.5.2. Clinical Trial Information
- 14.5.3. Clinical Trial Endpoints
- 14.6. TBI-1301 (Takara Bio)
- 14.6.1. Therapy Overview
- 14.6.2. Clinical Trial Information
- 14.6.3. Clinical Trial Endpoints
- 14.6.4. Clinical Trial Results
- 14.6.5. Estimated Sales Revenues
- 14.7. MDG1011 (Medigene)
- 14.7.1. Therapy Overview
- 14.7.2. Clinical Trial Information
- 14.7.3. Clinical Trial Endpoints
- 14.7.4. Clinical Trial Results
15. TIL-BASED THERAPY PROFILES
- 15.1. Chapter Overview
- 15.2. LN-144 / Lifileucel (Iovance Biotherapeutics)
- 15.2.1. Therapy Overview
- 15.2.2. Clinical Trial Information
- 15.2.3. Clinical Trial Endpoints
- 15.2.4. Clinical Trial Results
- 15.2.5. Estimated Sales Revenues
- 15.3. LN-145 (Iovance Biotherapeutics)
- 15.3.1. Therapy Overview
- 15.3.2. Clinical Trial Information
- 15.3.3. Clinical Trial Endpoints
- 15.3.4. Clinical Trial Results
- 15.3.5. Estimated Sales Revenues
- 15.4. ITIL-168 (Instil Bio)
- 15.4.1. Therapy Overview
- 15.4.2. Clinical Trial Information
- 15.4.3. Clinical Trial Endpoints
- 15.4.4. Clinical Trial Results
- 15.4.5. Estimated Sales Revenues
- 15.5. LTX-315 (Lytix Biopharma)
- 15.5.1. Therapy Overview
- 15.5.2. Clinical Trial Information
- 15.5.3. Clinical Trial Endpoints
- 15.5.4. Clinical Trial Results
- 15.5.5. Estimated Sales Revenues
16. EMERGING TECHNOLOGIES
- 16.1. Chapter Overview
- 16.2. Genome Editing Technologies
- 16.2.1. Technology Overview
- 16.2.2. Applications of Genome Editing Technologies
- 16.2.3. Emerging Technology Platforms for T-Cell Therapies
- 16.2.3.1. CRISPR / CAS9 System
- 16.2.3.1.1. Key Components
- 16.2.3.1.2. Mechanism of Action
- 16.2.3.1.3. Targeting Efficiency and Challenges
- 16.2.3.1.4. Next-Gen CRISPR Technology
- 16.2.3.1.5. Technology Providers
- 16.2.3.1.5.1. Intellia Therapeutics
- 16.2.3.1.5.2. Editas Medicine
- 16.2.3.1.5.3. CRISPR Therapeutics
- 16.2.3.1.5.4. Beam Therapeutics
- 16.2.3.1.5.5. Gracell Technologies
- 16.2.3.1.5.6. Caribou Biosciences
- 16.2.3.1.5.7. Nanjing Bioheng Biotech
- 16.2.3.1.5.8. Intima Biosciences
- 16.2.3.1.5.9. KSQ Therapeutics
- 16.2.3.1.5.10. Refuge Biotechnologies
- 16.2.3.2. TALENS
- 16.2.3.2.1. Key Components and Function
- 16.2.3.2.2. Mechanism of Action
- 16.2.3.2.3. Advantages and Challenges
- 16.2.3.2.4. Technology Providers
- 16.2.3.2.4.1. Cellectis
- 16.2.3.2.4.2. Editas Medicine
- 16.2.3.3. MegaTAL
- 16.2.3.3.1. Mechanism of Action
- 16.2.3.3.2. Technology Providers
- 16.2.3.3.2.1. bluebird bio
- 16.2.3.3.2.2. Precision Biosciences
- 16.2.3.4. Zinc Finger Nuclease
- 16.2.3.4.1. Mechanism of Action
- 16.2.3.4.2. Technology Providers
- 16.2.3.4.2.1. Sangamo Therapeutics
- 16.2.3.1. CRISPR / CAS9 System
- 16.2.4. Competitive Analysis: Gene Editing Platforms
- 16.3. Designing T-Cell Therapies with Improved Characteristics
- 16.3.1. Technologies for Targeting Multiple Cancers
- 16.3.1.1. Antibody Coupled T-Cell Receptor
- 16.3.1.1.1. Cogent Biosciences
- 16.3.1.2. NKR-T Platform
- 16.3.1.2.1. Celyad
- 16.3.1.2.2. Glycostem
- 16.3.1.2.3. CatamaranBio
- 16.3.1.1. Antibody Coupled T-Cell Receptor
- 16.3.2. Technologies for Improved Safety
- 16.3.2.1. Armored CAR and EGFRt Technology
- 16.3.2.1.1. Juno Therapeutics
- 16.3.2.2. Rheoswitch Therapeutic System
- 16.3.2.2.1. Intrexon
- 16.3.2.2.2. Precigen
- 16.3.2.3. Inducible Caspase 9 Safety Switch
- 16.3.2.3.1. Bellicum Pharmaceuticals
- 16.3.2.3.1.1. CaspaCIDe Technology
- 16.3.2.3.1.2. CIDeCAR Technology
- 16.3.2.3.1.3. GoCAR-T Technology
- 16.3.2.3.1. Bellicum Pharmaceuticals
- 16.3.2.4. On-OFF Switch, Multiple Companies
- 16.3.2.4.1. Inhibitory CAR (iCAR) (Juno Therapeutics)
- 16.3.2.4.2. On-OFF Switch (Theravectys)
- 16.3.2.5. Other Technologies to Improve CAR-T Safety
- 16.3.2.1. Armored CAR and EGFRt Technology
- 16.3.3. Allogeneic Technologies
- 16.3.3.1. CIK CAR-T Cells (Formula Pharmaceuticals)
- 16.3.3.2. Allogeneic Platform (CELYAD)
- 16.3.3.3. Allogeneic Platform (Cellectis)
- 16.3.3.4. AlloCAR T (Allogene Therapeutics)
- 16.3.1. Technologies for Targeting Multiple Cancers
- 16.4. Future Perspectives
17. PARTNERSHIPS AND COLLABORATIONS
- 17.1. Chapter Overview
- 17.2. Partnership Models
- 17.3. T-Cell Immunotherapies Market: Partnerships and Collaborations
- 17.3.1. Analysis by Year of Partnership
- 17.3.2. Analysis by Type of Partnership
- 17.3.3. Analysis by Type of Product
- 17.3.4. Analysis by Year of Partnership and Type of Product
- 17.3.5. Analysis by Type of Partnership and Type of Product
- 17.3.6. Analysis by Type of Partner
- 17.3.7. Analysis by Type of Product and Type of Partner
- 17.3.8. Most Popular Products: Analysis by Number of Partnerships
- 17.3.9. Most Active Industry Players: Analysis by Number of Partnerships
- 17.3.10. Most Active Non-Industry Players: Analysis by Number of Partnerships
- 17.3.11. Analysis by Geography
- 17.3.11.1. Intercontinental and Intracontinental Agreements
- 17.3.11.2. International and Local Deals
18. FUNDING AND INVESTMENT ANALYSIS
- 18.1. Chapter Overview
- 18.2. Type of Funding
- 18.3. T-Cell Immunotherapy Market: Funding and Investment Analysis
- 18.3.1. Analysis of Instances by Year
- 18.3.2. Analysis of Amount Invested by Year
- 18.3.3. Analysis by Type of Funding
- 18.3.4. Analysis of Amount Invested across Different Types of Therapies
- 18.3.5. Analysis by Type of Investor
- 18.3.6. Most Active Players: Analysis by Number of Instances
- 18.3.7. Most Active Investors: Analysis by Amount Invested
- 18.3.8. Analysis of Amount Invested by Geography
- 18.3.9. Most Active Investors: Distribution by Number of Funding Instances
19. PATENT ANALYSIS
- 19.1. Chapter Overview
- 19.2. Scope and Methodology
- 19.3. Patent Analysis: Distribution by Type of Patent
- 19.4. CAR-T Therapies: Patent Analysis
- 19.4.1. Analysis by Patent Publication Year
- 19.4.2. Analysis by Patent Application Year
- 19.4.3. Analysis of Granted Patents and Patent Applications by Publication Year
- 19.4.4. Analysis by Patent Jurisdiction
- 19.4.5. Analysis by CPC Symbols
- 19.4.6. Analysis by Type of Applicant
- 19.4.7. Leading Industry Players: Analysis by Number of Patents
- 19.4.8. Leading Non-Industry Players: Analysis by Number of Patents
- 19.4.9. Leading Patent Assignees: Analysis by Number of Patents
- 19.4.10. CAR-T Therapies: Patent Benchmarking
- 19.4.11. Analysis of Patent Characteristics
- 19.4.12. CAR-T Therapies: Patent Valuation
- 19.4.13. Leading Patents by Number of Citations
- 19.5. TCR-based Therapies: Patent Analysis
- 19.5.1. Analysis by Patent Publication Year
- 19.5.2. Analysis by Patent Application Year
- 19.5.3. Analysis by Geography
- 19.5.4. Analysis by Type of Player
- 19.5.5. Analysis by CPC Symbols
- 19.5.6. Analysis by Key Focus Areas
- 19.5.7. Leading Players: Analysis by Number of Patents
- 19.5.8. TCR-based Therapies: Patent Benchmarking
- 19.5.9 Analysis by Patent Characteristics
- 19.5.10. TCR-based Therapies: Patent Valuation
- 19.6. TIL-based Therapies: Patent Analysis
- 19.6.1. Analysis by Patent Publication Year
- 19.6.2. Analysis by Patent Application Year
- 19.6.3. Analysis by Geography
- 19.6.4. Analysis by Type of Player
- 19.6.5. Analysis by CPC Symbols
- 19.6.6. Analysis by Key Focus Areas
- 19.6.7. Leading Players: Analysis by Number of Patents
- 19.6.8. TIL-based Therapies: Patent Benchmarking
- 19.6.9. Analysis by Patent Characteristics
- 19.6.10. TIL-based Therapies: Patent Valuation
20. OTHER T-CELL IMMUNOTHERAPIES
- 20.1. Chapter Overview
- 20.2. Other T-Cell Immunotherapies
- 20.2.1. Fucosylated T-Cell Therapies
- 20.2.2. Gamma Delta T-Cell Therapies
- 20.2.3. PD-1 Knockout Engineered T-Cell Therapies
- 20.2.4. TAC T-Cell Therapies
- 20.2.5. T-Cell Vaccines
- 20.2.6. Treg Cell Therapies
- 20.2.7. Virus-Driven T-Cell Therapies
- 20.3. Other T-Cell Immunotherapies: Market Landscape
- 20.3.1. Analysis by Type of T-Cell
- 20.3.2. Analysis by Source of T-Cell
- 20.3.3. Analysis by Stage of Development
- 20.3.4. Analysis by Therapeutic Area
- 20.4. Key Considerations for Developing T-Cell Immunotherapies
- 20.5. Concluding Remarks
21. CASE STUDY: CELL THERAPY MANUFACTURING
- 21.1. Chapter Overview
- 21.2. Overview of Cell Therapy Manufacturing
- 21.3. Cell Therapy Manufacturing Models
- 21.3.1. Centralized Manufacturing Model
- 21.3.2. Decentralized Manufacturing Model
- 21.4. Scalability of Cell Therapy Manufacturing Processes
- 21.4.1. Scale-Up
- 21.4.2. Scale-Out
- 21.5. Types of Cell Therapy Manufacturers
- 21.6. Key Challenges Related to Manufacturing of Cell Therapies
- 21.7. Important Factors for Cell Therapy Manufacturing
- 21.7.1. Characterization
- 21.7.2. Cost of Goods
- 21.8. Automation of Cell Therapy Manufacturing Process
- 21.9. Cell Therapy Manufacturing Supply Chain
- 21.10. Comparison of Player Having In-House Capabilities and Contract Manufacturers
- 21.11. Regulatory Landscape
- 21.12. Future Perspectives
22. COST PRICE ANALYSIS
- 22.1. Chapter Overview
- 22.2. Factors Contributing to the High Price of Cell / Gene Therapies
- 22.3. Pricing Models for T-Cell Immunotherapies
- 22.3.1. Based on Associated Costs
- 22.3.2. Based on Availability of Competing Products
- 22.3.3. Based on Patient Segment
- 22.3.4. Based on Opinions of Industry Experts
- 22.4. Reimbursement related Considerations for T-Cell Immunotherapies
- 22.4.1. Case Study: The National Institute for Health and Care Excellence (NICE) Appraisal of CAR-T therapies
23. GLOBAL T-CELL THERAPIES MARKET
- 23.1. Chapter Overview
- 23.2. Key Assumptions and Methodology
- 23.3. Global T-Cell Therapies Market, Historical Trends (since 2018) and Future Estimates (till 2035)
- 23.4. Scenario Analysis
- 23.4.1. Conservative Scenario
- 23.4.2. Optimistic Scenario
- 23.5. Key Market Segmentations
24. T-CELL THERAPIES MARKET, BY TYPE OF THERAPY
- 24.1. Chapter Overview
- 24.2. Key Assumptions and Methodology
- 24.3. T-Cell Therapies Market: Distribution by Type of Therapy
- 24.3.1. T-Cell Therapies Market for CAR-T: Historical Trends (since 2018) and Forecasted Estimates (till 2035)
- 24.3.2. T-Cell Therapies Market for TCR: Historical Trends (since 2022) and Forecasted Estimates (till 2035)
- 24.3.3. T-Cell Therapies Market for TIL: Forecasted Estimates (till 2035)
- 24.4. Data Triangulation and Validation
25. T-CELL THERAPIES MARKET, BY TARGET INDICATION
- 25.1. Chapter Overview
- 25.2. Key Assumptions and Methodology
- 25.3. CAR-T Therapies Market: Distribution by Target Indication
- 25.3.1. CAR-T Therapies Market for Multiple Myeloma: Forecasted Estimates (till 2035)
- 25.3.2. CAR-T Therapies Market for Large B-Cell Lymphoma: Forecasted Estimates (till 2035)
- 25.3.3. CAR-T Therapies Market for Acute Lymphoblastic Leukemia: Forecasted Estimates (till 2035)
- 25.3.4. CAR-T Therapies Market for Diffuse Large B-Cell Lymphoma: Forecasted Estimates (till 2035)
- 25.3.5. CAR-T Therapies Market for Diffuse Large B-Cell Lymphoma, Primary Mediastinal Large B-Cell Lymphoma, Transformed Follicular Lymphoma and High grade B-cell lymphoma: Forecasted Estimates (till 2035)
- 25.3.6. CAR-T Therapies Market for Acute Lymphoblastic Leukemia/ B-cell Non-Hodgkin Lymphoma: Forecasted Estimates (till 2035)
- 25.3.7. CAR-T Therapies Market for Non-Hodgkin Lymphoma: Forecasted Estimates (till 2035)
- 25.3.8. CAR-T Therapies Market for Mantle Cell Lymphoma: Forecasted Estimates (till 2035)
- 25.3.9. CAR-T Therapies Market for Acute Myeloid Leukemia: Forecasted Estimates (till 2035)
- 25.3.10. CAR-T Therapies Market for Generalized Myasthenia Gravis: Forecasted Estimates (till 2035)
- 25.3.11. CAR-T Therapies Market for Renal transplantation (HLA-A2): Forecasted Estimates (till 2035)
- 25.3.12. CAR-T Therapies Market for Gastric Adenocarcinoma: Forecasted Estimates (till 2035)
- 25.3.13. CAR-T Therapies Market for Ovarian / Endometrial cancer: Forecasted Estimates (till 2035)
- 25.3.14. CAR-T Therapies Market for Chronic Lymphocytic Leukemia: Forecasted Estimates (till 2035)
- 25.3.15. CAR-T Therapies Market for Follicular Lymphoma: Forecasted Estimates (till 2035)
- 25.3.16. CAR-T Therapies Market for Renal Cell Carcinoma: Forecasted Estimates (till 2035)
- 25.4. TCR Therapies Market: Distribution by Target Indication
- 25.4.1. TCR Therapies Market for Melanoma: Forecasted Estimates (till 2035)
- 25.4.2. TCR Therapies Market for Sarcoma: Forecasted Estimates (till 2035)
- 25.4.3. TCR Therapies Market for Head and Neck Cancer: Forecasted Estimates (till 2035)
- 25.4.4. TCR Therapies Market for Hepatocellular Carcinoma: Forecasted Estimates (till 2035)
- 25.4.5. TCR Therapies Market for Nasopharyngeal Carcinoma: Forecasted Estimates (till 2035)
- 25.4.6. TCR Therapies Market for Ovarian Cancer: Forecasted Estimates (till 2035)
- 25.4.7. TCR Therapies Market for Acute Myeloid Leukemia: Forecasted Estimates (till 2035)
- 25.5. TIL Therapies Market: Distribution by Target Indication
- 25.5.1. TIL Therapies Market for Melanoma: Forecasted Estimates (till 2035)
- 25.5.2. TIL Therapies Market for Basal Cell Carcinoma: Forecasted Estimates (till 2035)
- 25.5.3. TIL Therapies Market for Lung Cancer: Forecasted Estimates (till 2035)
- 25.5.4. TIL Therapies Market for Sarcoma: Forecasted Estimates (till 2035)
- 25.5.5. TIL Therapies Market for Head and Neck Cancer: Forecasted Estimates (till 2035)
- 25.5.6. TIL Therapies Market for Cervical Cancer: Forecasted Estimates (till 2035)
- 25.5.7. TIL Therapies Market for Neuro Gastro-Intestinal (GI) Cancer: Forecasted Estimates (till 2035)
- 25.5.8. TIL Therapies Market for Breast Cancer: Forecasted Estimates (till 2035)
- 25.6. Data Triangulation and Validation
26. T-CELL THERAPIES MARKET, BY TARGET ANTIGEN
- 26.1. Chapter Overview
- 26.2. Key Assumptions and Methodology
- 26.3. CAR-T Therapies Market: Distribution by Type Target Antigen
- 26.3.1. CAR-T Therapies Market for BCMA: Forecasted Estimates (till 2035)
- 26.3.2. CAR-T Therapies Market for CD19: Forecasted Estimates (till 2035)
- 26.3.3. CAR-T Therapies Market for CD20: Forecasted Estimates (till 2035)
- 26.3.4. CAR-T Therapies Market for CD19 / CD22: Forecasted Estimates (till 2035)
- 26.3.5. CAR-T Therapies Market for Other Target Antigens: Forecasted Estimates (till 2035)
- 26.4. TCR Therapies Market: Distribution by Type Target Antigen
- 26.4.1. TCR Therapies Market for HLA: Forecasted Estimates (till 2035)
- 26.4.2. TCR Therapies Market for MAGE: Forecasted Estimates (till 2035)
- 26.4.3. TCR Therapies Market for PRAME: Forecasted Estimates (till 2035)
- 26.4.4. TCR Therapies Market for NY-ESO-1 and LAGE: Forecasted Estimates (till 2035)
- 26.4.5. TCR Therapies Market for EBV: Forecasted Estimates (till 2035)
- 26.4.6. TCR Therapies Market for HBV: Forecasted Estimates (till 2035)
- 26.5. Data Triangulation and Validation
27. T-CELL THERAPIES MARKET, BY COMPANY SIZE
- 27.1. Chapter Overview
- 27.2. Key Assumptions and Methodology
- 27.3. TCR Therapies Market: Distribution by Company Size
- 27.3.1. TCR Therapies Market for Mid-sized Companies: Forecasted Estimates (till 2035)
- 27.3.2. TCR Therapies Market for Large Companies: Forecasted Estimates (till 2035)
- 27.4. TIL Therapies Market: Distribution by Company Size
- 27.4.1. TIL Therapies Market for Small Companies: Forecasted Estimates (till 2035)
- 27.4.2. TIL Therapies Market for Large Companies: Forecasted Estimates (till 2035)
- 27.5. Data Triangulation and Validation
28. T-CELL THERAPIES MARKET, BY GEOGRAPHICAL REGIONS
- 28.1. Chapter Overview
- 28.2. Key Assumptions and Methodology
- 28.3. CAR-T Therapies Market: Distribution by Geographical Regions
- 28.3.1. CAR-T Therapies Market in North America: Forecasted Estimates (till 2035)
- 28.3.2. CAR-T Therapies Market in Europe: Forecasted Estimates (till 2035)
- 28.3.3. CAR-T Therapies Market in Asia-Pacific: Forecasted Estimates (till 2035)
- 28.3.4. CAR-T Therapies Market in Latin America: Forecasted Estimates (till 2035)
- 28.3.5. CAR-T Therapies Market in Middle East and North Africa: Forecasted Estimates (till 2035)
- 28.3.6. CAR-T Therapies Market in Rest of the World: Forecasted Estimates (till 2035)
- 28.4. CAR-T Therapies Market, by Geographical Regions: Market Dynamics Assessment
- 28.4.1. Penetration Growth (P-G) Matrix
- 28.4.2. Market Movement Analysis
- 28.5. TCR Therapies Market: Distribution by Geographical Regions
- 28.5.1. TCR Therapies Market in North America: Forecasted Estimates (till 2035)
- 28.5.2. TCR Therapies Market in Europe: Forecasted Estimates (till 2035)
- 28.5.3. TCR Therapies Market in Asia-Pacific: Forecasted Estimates (till 2035)
- 28.5.4. TCR Therapies Market in Rest of the World: Forecasted Estimates (till 2035)
- 28.6. TCR Therapies Market, by Geographical Regions: Market Dynamics Assessment
- 28.6.1. Penetration Growth (P-G) Matrix
- 28.6.2. Market Movement Analysis
- 28.7. TIL Therapies Market: Distribution by Geographical Regions
- 28.7.1. TIL Therapies Market in North America: Forecasted Estimates (till 2035)
- 28.7.2. TIL Therapies Market in Europe: Forecasted Estimates (till 2035)
- 28.7.3. TIL Therapies Market in Rest of the World: Forecasted Estimates (till 2035)
- 28.8. TIL Therapies Market, by Geographical Regions: Market Dynamics Assessment
- 28.8.1. Penetration Growth (P-G) Matrix
- 28.8.2. Market Movement Analysis
- 28.9. Data Triangulation and Validation
29. T-CELL THERAPY MARKET, BY LEADING PLAYERS
- 29.1. Chapter Overview
- 29.2. Key Assumptions and Methodology
- 29.3. CAR-T Therapies: Sales Forecast of Leading Players
- 29.3.1. Gilead Sciences Sales Forecast
- 29.3.2. Bristol Myers Squibb Sales Forecast
- 29.3.3. Novartis Sales Forecast
- 29.3.4. Janssen Sales Forecast
- 29.3.5. JW Therapeutics Sales Forecast
- 29.4. TCR Therapies: Sales Forecast of Leading Players
- 29.4.1. Immunocore Sales Forecast
- 29.4.2. Adaptimmune Therapeutics Sales Forecast
- 29.4.3. TCRCure Biopharma Sales Forecast
- 29.4.4. Lion TCR Sales Forecast
- 29.4.5. Miltenyi Biomedicine Sales Forecast
- 29.5. TIL Therapies: Sales Forecast of Leading Players
- 29.5.1. Iovance Biotherapeutics Sales Forecast
- 29.5.2. Lytix Biopharma Sales Forecast
- 29.5.3. Bristol-Myers Squibb Sales Forecast
- 29.5.4. Intima Bioscience Sales Forecast
- 29.6. Data Triangulation and Validation
30. T-CELL THERAPIES MARKET, SALES FORECAST OF THERAPIES
- 30.1. Chapter Overview
- 30.2. Key Assumptions and Methodology
- 30.3. Commercialized CAR-T Therapies: Sales Forecast
- 30.3.1. Kymriah (Tisagenlecleucel-T) Sales Forecast
- 30.3.2. Yescarta (axicabtagene ciloleucel) Sales Forecast
- 30.3.3. Tecartus (Brexucabtagene Autoleucel) Sales Forecast
- 30.3.4. Abecma (Idecabtagene Vicleucel / bb211211) Sales Forecast
- 30.3.5. CARVYKTI (LCAR-B38M CAR-T / JNJ-6821845218 / Ciltacabtagene Autoleucel) Sales Forecast
- 30.3.6. BREYANZI (Lisocabtagene maraleucel, JCAR017) Sales Forecast
- 30.3.7. Carteyva (Relmacabtagene autoleucel / JWCAR0219) Sales Forecast
- 30.3.8. NexCART Sales Forecast
- 30.3.9. Fucaso (Equecabtagene Autoleucel) Sales Forecast
- 30.3.10. Inaticabtagene Autoleucel CNCT19 / HY001Sales Forecast
- 30.3.11. Zevorcabtagene autoleucel (CT053) Sales Forecast
- 30.4. Clinical CAR-T Therapies: Sales Forecast
- 30.4.1. CAR-BCMA T cells Sales Forecast
- 30.4.2. CAR-T-CD19 Cells Sales Forecast
- 30.4.3. Descartes-08 Sales Forecast
- 30.4.4. Zamtocabtagene Autoleucel (MB-CART21019.1) Sales Forecast
- 30.4.5. CAR-T ddBCMA Sales Forecast
- 30.4.6. CRG-02121 cells Sales Forecast
- 30.4.7. CT041 Sales Forecast
- 30.4.8. ALLO-501A / ALLO-501 Sales Forecast
- 30.4.9. ALLO-605 Sales Forecast
- 30.4.10. Descartes-25 Sales Forecast
- 30.4.11. AUTO1 Sales Forecast
- 30.4.12. AUTO3 (CD19/2121 CAR-T) Sales Forecast
- 30.4.13. AUTO4 (CD19/2121 CAR-T) Sales Forecast
- 30.4.14. CD19-CAR-T Sales Forecast
- 30.4.15. Humanized CD19-CAR-T Sales Forecast
- 30.4.16. IM19 CAR-T Sales Forecast
- 30.4.17. CCT301 CAR-T Sales Forecast
- 30.4.18. CARCIK-CD19 Sales Forecast
- 30.4.19. CD123 CAR-T cells Sales Forecast
- 30.4.20. BCMA CAR-T Sales Forecast
- 30.4.21. CD19/CD22-CAR-T Sales Forecast
- 30.4.22. GC012F (Dual CAR-BCMA-19) Sales Forecast
- 30.4.23. CD19/CD210-CART Sales Forecast
- 30.4.24. CD7 CAR-T Sales Forecast
- 30.4.25. Anti-FLT3 CAR-T / TAA05 Sales Forecast
- 30.4.26. Anti-ALPP CAR-T Cells Sales Forecast
- 30.4.27. WU CART 007 Sales Forecast
- 30.4.28. CTX110 Sales Forecast
- 30.4.29. TX2100-TR101 Sales Forecast
- 30.4.30. ALETA-001 Sales Forecast
- 30.4.31. PBCAR0191 Sales Forecast
- 30.5. Commercialized TCR Therapies: Sales Forecast
- 30.5.1. Kimmtrak (IMCgp100 / Tebentafusp) Sales Forecast
- 30.5.2. TECELRA(R) (Afamitresgene Autoleucel) Sales Forecast
- 30.6. Clinical TCR Therapies: Sales Forecast
- 30.6.1. Brenetafusp (IMC-F106C) Sales Forecast
- 30.6.2. lete-cel Sales Forecast
- 30.6.3. ADP-A2M4CD8 Sales Forecast
- 30.6.4. EBV-specific TCR-T cell with anti-PD1 auto-secreted element Sales Forecast
- 30.6.5. Unnamed TCR therapy Sales Forecast
- 30.6.6. MB-dNPM1 Sales Forecast
- 30.7. Commercialized TIL Therapies: Sales Forecast
- 30.7.1. AMTAGVI Sales Forecast
- 30.8. Clinical TIL Therapies: Sales Forecast
- 30.8.1. LN-145 Sales Forecast
- 30.8.2. IOV-4001 Sales Forecast
- 30.8.3. LTX-315 and TILs Sales Forecast
- 30.8.4. TILs Sales Forecast
- 30.8.5. TIL (Cyclophosphamide) Sales Forecast
- 30.9. Data Triangulation and Validation
31. PROMOTIONAL ANALYSIS
- 31.1. Chapter Overview
- 31.2. Channels Used for Promotional Campaigns
- 31.3. Summary of Product Website Analysis
- 31.4. Summary of Patient Support Services and Informative Downloads
- 31.5. Kymriah: Promotional Analysis
- 31.5.1. Drug Overview
- 31.5.2. Product Website Analysis
- 31.5.2.1. Message for Healthcare Professionals
- 31.5.2.2. Message for Patients
- 31.5.2.3. Informative Downloads
- 31.5.3. Patient Support Services
- 31.6. Yescarta: Promotional Analysis
- 31.6.1. Drug Overview
- 31.6.2. Product Website Analysis
- 31.6.2.1. Message for Healthcare Professionals
- 31.6.2.2. Message for Patients
- 31.6.2.3. Informative Downloads
- 31.6.3. Patient Support Services
- 31.7. Tecartus: Promotional Analysis
- 31.7.1. Drug Overview
- 31.7.2. Product Website Analysis
- 31.7.2.1. Message for Healthcare Professionals
- 31.7.2.2. Message for Patients
- 31.7.2.3. Informative Downloads
- 31.7.3. Patient Support Services
- 31.8. Breyanzi: Promotional Analysis
- 31.8.1. Drug Overview
- 31.8.2. Product Website Analysis
- 31.8.2.1. Message for Healthcare Professionals
- 31.8.2.2. Message for Patients
- 31.8.2.3. Informative Downloads
- 31.8.3. Patient Support Services
- 31.9. Abecma: Promotional Analysis
- 31.9.1. Drug Overview
- 31.9.2. Product Website Analysis
- 31.9.2.1. Message for Healthcare Professionals
- 31.9.2.2. Message for Patients
- 31.9.2.3. Informative Downloads
- 31.9.3. Patient Support Services
- 31.10. Carvykti: Promotional Analysis
- 31.10.1. Drug Overview
- 31.10.2. Product Website Analysis
- 31.10.2.1. Message for Healthcare Professionals
- 31.10.2.2. Message for Patients
- 31.10.2.3. Informative Downloads
- 31.10.3. Patient Support Services
- 31.11. Kimmtrak: Promotional Analysis
- 31.11.1. Drug Overview
- 31.11.2. Product Website Analysis
- 31.11.2.1. Message for Healthcare Professionals
- 31.11.2.2. Message for Patients
- 31.11.2.3. Informative Downloads
- 31.11.3. Patient Support Services
32. COMPANY PROFILES
- 32.1. Chapter Overview
- 32.2. Adaptimmune Therapeutics
- 32.3. AbelZeta
- 32.4. Alaunos Therapeutics
- 32.5. Autolus Therapeutics
- 32.6. bluebird Bio
- 32.7. Bristol Myers Squibb
- 32.8. Carsgen Therapeutics
- 32.9. Cellectis
- 32.10. Gilead Sciences
- 32.11. Immatics
- 32.12. Immunocore
- 32.13. Innovative Cellular Therapeutics
- 32.14. Iovance Biotherapeutics
- 32.15. Kuur Therapeutics
- 32.16. Lion TCR
- 32.17. Noile-Immune Biotech
- 32.18. Novartis
- 32.19. Takara Bio
- 32.20. Wellington Zhaotai Therapies
- 32.21. Zelluna immunotherapy
33. CONCLUDING REMARKS
34. EXECUTIVE INSIGHTS
- 34.1. Chapter Overview
- 34.2. Mid-sized Company, China
- 34.2.1. Interview Transcript: Chief Executive Officer
- 34.3. Small Company, France
- 34.3.1. Interview Transcript: Chief Operating Officer and Executive Vice President
- 34.4. Mid-sized, UK
- 34.4.1. Interview Transcript: Former Co-Founder and Chief Executive Officer
- 34.5. Small Company, Netherlands
- 34.5.1. Interview Transcript: Former Chief Executive Officer
- 34.6. Mid-sized Company, Australia
- 34.6.1. Interview Transcript: Former Chief Executive Officer
- 34.7. Mid-sized Company, Belgium
- 34.7.1. Interview Transcript: Former Vice President, Immuno-Oncology
- 34.8. Small Company, US
- 34.8.1. Interview Transcript: Director, Business Development
- 34.9. Large Company, US
- 34.9.1. Interview Transcript: Former Director, Process Development
- 34.10. Large Company, US
- 34.10.1. Interview Transcript: Former Research Head
- 34.11. Small Company, US
- 34.11.1. Interview Transcript: Former Competitive Intelligence Manager, Strategy and Business Development
- 34.12. Hospital, China
- 34.12.1. Interview Transcript: Professor of Medicine and Director, Department of Oncology
- 34.13. University, US
- 34.13.1. Interview Transcript: Enkhtsetseg Purev, Assistant Professor of Medicine
35. APPENDIX 1: TABULATED DATA
36. APPENDIX 2: LIST OF COMPANIES AND ORGANIZATIONS
List of Tables
- Table 6.1 Types of Immunotherapies and Affiliated Mechanisms of Action
- Table 6.2 FDA Approved Antibody based Cancer Therapeutics
- Table 6.3 Retroviral Vectors: Salient Features
- Table 6.4 Lentiviral Vectors: Salient Features
- Table 6.5 Key Characteristics of CAR-T Cells
- Table 6.6 Comparison of First and Second-Generation CAR-Ts
- Table 6.7 CD19 CAR-T Cells: Preclinical Results
- Table 6.8 Other Targets under Clinical / Preclinical Studies for CAR-T Therapies
- Table 6.9 CAR-T and TCR-based Therapies: Key Differences
- Table 7.1 CAR-T Therapies: Approved and Clinical Pipeline
- Table 7.2 CAR-T Therapies: Information on Route of Administration, Source of T-cell, Dosing Frequency, and Target Patient Segment
- Table 7.3 CAR-T Therapy: Preclinical Pipeline
- Table 7.4 List of CAR-T Therapy Developers
- Table 8.1 TCR-based Therapies: Approved and Clinical Pipeline
- Table 8.2 TCR-based Therapies: Information on Sponsor, Stage of Development, Route of Administration, Dosing Frequency, Target Patient Segment and Type of Therapy
- Table 8.3 TCR-based Therapies: Preclinical Pipeline
- Table 8.4 List of TCR-based Therapies: List of Developers
- Table 9.1 TIL-based Therapies: Approved and Clinical Pipeline
- Table 9.2 TIL-based Therapies: Information on Sponsor, Stage of Development, Route of Administration, Dosing Frequency, Target Patient Segment and Type of Therapy
- Table 9.3 TIL-based Therapies: Preclinical Pipeline
- Table 9.4 TIL-based Therapies: List of Developers
- Table 10.1 CAR-T Therapies: Information on CAR-Constructs of Clinical Candidates
- Table 12.1 CAR-T Therapies: List of Principal Investigators
- Table 12.2 TCR-based Therapies: List Principal Investigators
- Table 12.3 TIL-based Therapies: List of Principal Investigators
- Table 13.1 CAR-T Therapies: List of Therapies Profiled
- Table 13.2 Therapy Profile: Kymriah(R) (Novartis)
- Table 13.3 Kymriah(R): Clinical Trial Information
- Table 13.4 Kymriah(R): Clinical Trial Endpoints
- Table 13.5 Kymriah(R): Clinical Trial Results
- Table 13.6 Therapy Profile: Yescarta(R) (Gilead Sciences)
- Table 13.7 Yescarta(R): Clinical Trial Information
- Table 13.8 Yescarta(R): Clinical Trial Endpoints
- Table 13.9 Yescarta(R): Clinical Trial Results
- Table 13.10 Therapy Profile: Tecartus(TM) (Gilead Sciences)
- Table 13.11 Tecartus(TM): Clinical Trial Information
- Table 13.12 Tecartus(TM): Clinical Trial Endpoints
- Table 13.13 Tecartus(TM): Clinical Trial Results
- Table 13.14 Therapy Profile: Breyanzi(R) (Bristol Myers Squibb)
- Table 13.15 Breyanzi(R): Clinical Trial Information
- Table 13.16 Breyanzi(R): Clinical Trial Endpoints
- Table 13.17 Breyanzi(R): Clinical Trial Results
- Table 13.18 Therapy Profile: Abecma (Bristol Myers Squibb)
- Table 13.19 Abecma: Clinical Trial Information
- Table 13.20 Abecma: Clinical Trial Endpoints
- Table 13.21 Abecma: Clinical Trial Results
- Table 13.22 Therapy Profile: Carvykti (Janssen)
- Table 13.23 Carvykti: Clinical Trial Information
- Table 13.24 Carvykti: Clinical Trial Endpoints
- Table 13.25 Carvykti: Clinical Trial Results
- Table 13.26 Therapy Profile: Carteyva (JW Therapeutics)
- Table 13.27 Carteyva: Clinical Trial Information
- Table 13.28 Carteyva: Clinical Trial Endpoints
- Table 13.29 Carteyva: Clinical Trial Results
- Table 13.30 Therapy Profile: TBI-1501 (Takara Bio)
- Table 13.31 TBI-1501: Clinical Trial Information
- Table 13.32 TBI-1501: Clinical Trial Endpoints
- Table 13.33 Therapy Profile: AUTO1 (Autolus)
- Table 13.34 AUTO1: Clinical Trial Information
- Table 13.35 AUTO1: Clinical Trial Endpoints
- Table 13.36 AUTO1: Clinical Trial Results
- Table 13.37 Therapy Profile: AUTO3 (Autolus)
- Table 13.38 AUTO3: Clinical Trial Information
- Table 13.39 AUTO3: Clinical Trial Endpoints
- Table 13.40 AUTO3: Clinical Trial Results
- Table 14.1 TCR Therapies: List of Therapies Profiled
- Table 14.2 Therapy Profile: Kimmtrak (Immunocore)
- Table 14.3 Kimmtrak: Clinical Trial Information
- Table 14.4 Kimmtrak: Clinical Trial Endpoints
- Table 14.5 Kimmtrak: Clinical Trial Results
- Table 14.6 Therapy Profile: GSK3377794 (GlaxoSmithKline)
- Table 14.7 GSK3377794: Clinical Trial Information
- Table 14.8 GSK3377794: Clinical Trial Endpoints
- Table 14.9 GSK3377794: Clinical Trial Results
- Table 14.10 Therapy Profile: ADP-A2M4 (Adaptimmune Therapeutics)
- Table 14.11 ADP-A2M4: Clinical Trial Information
- Table 14.12 ADP-A2M4: Clinical Trial Endpoints
- Table 14.13 ADP-A2M4: Clinical Trial Results
- Table 14.14 Therapy Profile: JTCR016 (Juno Therapeutics (Bristol Myers Squibb))
- Table 14.15 JTCR016: Clinical Trial Information
- Table 14.16 JTCR016: Clinical Trial Endpoints
- Table 14.17 Therapy Profile: TBI-1301 (Takara Bio)
- Table 14.18 TBI-1301: Clinical Trial Information
- Table 14.19 TBI-1301: Clinical Trial Endpoints
- Table 14.20 TBI-1301: Clinical Trial Results
- Table 14.21 Therapy Profile: MDG1011 (Medigene)
- Table 14.22 MDG1011: Clinical Trial Information
- Table 14.23 MDG1011: Clinical Trial Endpoints
- Table 14.24 MDG1011: Clinical Trial Results
- Table 15.1 TIL Therapies: List of Therapies Profiled
- Table 15.2 Therapy Profile: LN-144 (Iovance Biotherapeutics)
- Table 15.3 LN-144: Clinical Trial Information
- Table 15.4 LN-144: Clinical Trial Endpoints
- Table 15.5 LN-144: Clinical Trial Results
- Table 15.6 Therapy Profile: LN-145 (Iovance Biotherapeutics)
- Table 15.7 LN-145: Clinical Trial Information
- Table 15.8 LN-145: Clinical Trial Endpoints
- Table 15.9 LN-145: Clinical Trial Results
- Table 15.10 Therapy Profile: ITIL-168 (Instil Bio)
- Table 15.11 ITIL-168: Clinical Trial Information
- Table 15.12 ITIL-168: Clinical Trial Endpoints
- Table 15.13 ITIL-168: Clinical Trial Results
- Table 15.14 Therapy Profile: LTX-315 (Lytix Biopharma)
- Table 15.15 LTX-315: Clinical Trial Information
- Table 15.16 LTX-315: Clinical Trial Endpoints
- Table 15.17 LTX-315: Clinical Trial Results
- Table 16.1 Bellicum Pharmaceuticals: Key Switch Technologies
- Table 16.2 Technologies For CAR-T Safety Enhancement
- Table 17.1 T-Cell Immunotherapies Market: List of Partnerships and Collaborations, 2005-2022
- Table 18.1 T-Cell Immunotherapies: Funding and Investments, 2000-2022
- Table 18.2 T-Cell Immunotherapies: Summary of Investments
- Table 19.1 CAR-T Therapies Patent Analysis: Top CPC Sections
- Table 19.2 CAR-T Therapies Patent Analysis: Top CPC Symbols
- Table 19.3 CAR-T Therapies Patent Analysis: Top CPC Codes
- Table 19.4 CAR-T Therapies Patent Analysis: Summary of Benchmarking Analysis
- Table 19.5 CAR-T Therapies Patent Analysis: Categorization based on Weighted Valuation Scores
- Table 19.6 CAR-T Therapies Patent Portfolio: List of Leading Patents (by Highest Relative Valuation)
- Table 19.7 CAR-T Therapies Patent Portfolio: List of Leading Patents (By Number of Citations)
- Table 19.8 TCR-based Therapies Patent Analysis: Prominent CPC Symbols
- Table 19.9 TCR-based Therapies Patent Analysis: Most Popular CPC Symbols
- Table 19.10 TCR-based Therapies Patent Analysis: List of Top CPC Symbols
- Table 19.11 TCR-based Therapies Patent Analysis: Summary of Benchmarking Analysis
- Table 19.12 TCR-based Therapies Patent Analysis: Categorization based on Weighted Valuation Scores
- Table 19.13 TIL-based Therapies Patent Analysis: Prominent CPC Symbols
- Table 19.14 TIL-based Therapies Patent Analysis: Most Popular CPC Symbols
- Table 19.15 TIL-based Therapies Patent Analysis: List of Top CPC Symbols
- Table 19.16 TIL-based Therapies Patent Analysis: Summary of Benchmarking Analysis
- Table 19.17 TIL-based Therapies Patent Analysis: Categorization based on Weighted Valuation Scores
- Table 20.1 Characteristic Properties of Treg Cells
- Table 20.2 Other T-Cell Immunotherapies: Therapy Candidate Pipeline
- Table 21.1 Assessment Strategies for Different Manufacturing Processes
- Table 21.2 Advantages and Disadvantages of Centralized and Decentralized Manufacturing Models
- Table 21.3 Cell Therapy Manufacturing: Companies with In-House Capabilities and Contract Manufacturers
- Table 22.1 Price of Marketed Gene / Cell Therapies
- Table 22.2 Price of Marketed Targeted Drugs
- Table 22.3 T-Cell Immunotherapies: Expert Opinions on Pricing
- Table 22.4 CAR-T Therapies: Reimbursement Landscape
- Table 23.1 T-Cell Therapies Market: List of Forecasted Therapies
- Table 31.1 Promotional / Marketing Strategy: Patient Support Services and Informative Downloads
- Table 31.2 Kymriah(R): Drug Overview
- Table 31.3 Yescarta(R): Drug Overview
- Table 31.4 Tecartus(TM): Drug Overview
- Table 31.5 Breyanzi(R): Drug Overview
- Table 31.6 Abecma: Drug Overview
- Table 31.7 Carvykti: Drug Overview
- Table 31.8 Kimmtrak: Drug Overview
- Table 32.1 Global T-cell (CAR-T, TCR and TIL) Therapies Market: List of Developers Profiled
- Table 32.2 Adaptimmune Therapeutics: Company Profile
- Table 32.3 AbelZeta: Company Profile
- Table 32.4 Alaunos Therapeutics: Company Profile
- Table 32.5 Autolus Therapeutics: Company Profile
- Table 32.6 bluebird bio: Company Profile
- Table 32.7 Bristol Myers Squibb: Company Profile
- Table 32.8 CARsgen Therapeutics: Company Profile
- Table 32.9 Cellectis: Company Profile
- Table 32.10 Gilead Sciences: Company Profile
- Table 32.11 Immatics: Company Profile
- Table 32.12 Immunocore: Company Profile
- Table 32.13 Innovative Cellular Therapeutics: Company Profile
- Table 32.14 Iovance Biotherapeutics: Company Profile
- Table 32.15 Kuur Therapeutics: Company Profile
- Table 32.16 Lion TCR: Company Profile
- Table 32.17 Noile-Immune Biotech: Company Profile
- Table 32.18 Novartis: Company Profile
- Table 32.19 Takara Bio: Company Profile
- Table 32.20 Wellington Zhaotai Therapies: Company Profile
- Table 32.21 Zelluna Immunotherapy: Company Profile
- Table 35.1 CAR-T Therapies: Distribution by Stage of Development
- Table 35.2 CAR-T Therapies: Distribution by Type of Therapy
- Table 35.3 CAR-T Therapies: Distribution by Target Antigen
- Table 35.4 CAR-T Therapies: Distribution by Target Indication
- Table 35.5 CAR-T Therapies: Distribution by Therapeutic Area
- Table 35.6 CAR-T Therapies: Distribution by Stage of Development and Therapeutic Area
- Table 35.7 CAR-T Therapies: Distribution by Source of T-cells
- Table 35.8 CAR-T Therapies: Distribution by Stage of Development and Source of T-cells
- Table 35.9 CAR-T Therapies: Distribution by Route of Administration
- Table 35.10 CAR-T Therapies: Distribution by Dosing Frequency
- Table 35.11 CAR-T Therapies: Distribution by Target Patient Segment
- Table 35.12 Most Active Industry Players: Distribution by Number of CAR-T Therapies Developed
- Table 35.13 Most Active Non-Industry Players: Distribution by Number of CAR-T Therapies Developed
- Table 35.14 CAR-T Therapy Developers: Distribution by Year of Establishment
- Table 35.15 CAR-T Therapy Developers: Distribution by Company Size
- Table 35.16 CAR-T Therapy Developers: Distribution by Location of Headquarters (Region)
- Table 35.17 CAR-T Therapy Developers: Distribution by Location of Headquarters (Country)
- Table 35.18 TCR-based Therapies: Distribution by Stage of Development
- Table 35.19 TCR-based Therapies: Distribution by Therapeutic Area
- Table 35.20 TCR-based Therapies: Distribution by Stage of Development and Therapeutic Area
- Table 35.21 TCR-based Therapies: Distribution by Target Indication
- Table 35.22 TCR-based Therapies: Distribution by Target Antigen
- Table 35.23 TCR-based Therapies: Distribution by Source of T-Cells
- Table 35.24 TCR-based Therapies: Distribution by Route of Administration
- Table 35.25 TCR-based Therapies: Distribution by Dosing Frequency
- Table 35.26 TCR-based Therapies: Distribution by Target Patient Segment
- Table 35.27 TCR-based Therapies: Distribution by Type of Therapy
- Table 35.28 TCR-based Therapies: Distribution by Stage of Development and Type of Therapy
- Table 35.29 Most Active Industry Players: Distribution by Number of TCR-based Therapies Developed
- Table 35.30 Most Active Non-Industry Players: Distribution by Number of TCR-based Therapies Developed
- Table 35.31 TCR-based Therapy Developers: Distribution by Year of Establishment
- Table 35.32 TCR-based Therapy Developers: Distribution by Company Size
- Table 35.33 TCR-based Therapy Developers: Distribution by Location of Headquarters
- Table 35.34 TIL-based Therapies: Distribution by Type of Developer
- Table 35.35 TIL-based Therapies: Distribution by Stage of Development
- Table 35.36 TIL-based Therapies: Distribution by Route of Administration
- Table 35.37 TIL-based Therapies: Distribution by Dosing Frequency
- Table 35.38 TIL-based Therapies: Distribution by Target Patient Segment
- Table 35.39 TIL-based Therapies: Distribution by Type of Therapy
- Table 35.40 TIL-based Therapies: Distribution by Target Indication
- Table 35.41 Most Active Industry Players: Distribution by Number of TIL-based Therapies Developed
- Table 35.42 Most Active Non-Industry Players: Distribution by Number of TIL-based Therapies Developed
- Table 35.43 TIL-based Therapy Developers: Distribution by Year of Establishment
- Table 35.44 TIL-based Therapy Developers: Distribution by Company Size
- Table 35.45 TIL-based Therapy Developers: Distribution by Location of Headquarters
- Table 35.46 CAR-Construction: Distribution by Generation of CAR
- Table 35.47 CAR-Construction: Distribution by Type of scFv Antibody Used
- Table 35.48 CAR-Construction: Distribution by Type of Virus Used
- Table 35.49 CAR-Construction: Distribution by Type of Gene Transfer Method Used
- Table 35.50 CAR-Construction: Distribution by Type of Co-Stimulatory Domain
- Table 35.51 Clinical Trial Analysis: Cumulative Year-wise Trend, Since 2017
- Table 35.52 Clinical Trial Analysis: Year-wise Trend of Patients Enrolled by Trial Registration Year, Since 2017
- Table 35.53 Clinical Trial Analysis: Distribution by Trial Phase
- Table 35.54 Clinical Trial Analysis: Distribution by Number of Patients Enrolled by Trial Phase
- Table 35.55 Clinical Trial Analysis: Distribution by Trial Registration Year and Trial Phase, Since 2017
- Table 35.56 Clinical Trial Analysis: Distribution by Trial Status
- Table 35.57 Clinical Trial Analysis: Distribution by Patient Gender
- Table 35.58 Clinical Trial Analysis: Distribution by Therapeutic Area
- Table 35.59 Clinical Trial Analysis: Distribution by Type of Trial Masking
- Table 35.60 Clinical Trial Analysis: Distribution by Type of Intervention Model
- Table 35.61 Clinical Trial Analysis: Distribution by Trial Purpose
- Table 35.62 Clinical Trial Analysis: Distribution by Design Allocation
- Table 35.63 Leading Industry Players: Distribution by Number of Registered Trials
- Table 35.64 Leading Non-Industry Players: Distribution by Number of Registered Trials
- Table 35.65 Clinical Trial Analysis: Distribution of Clinical Trials by Trial Status and Geography
- Table 35.66 Clinical Trial Analysis: Distribution of Patients Enrolled by Trial Status and Geography
- Table 35.67 TCR-based Therapies Clinical Trial Analysis: Cumulative Distribution by Trial Registration Year, Since 2017
- Table 35.68 TCR-based Therapies Clinical Trial Analysis: Distribution by Trial Registration Year and Patient Enrolled, Since 2017
- Table 35.69 TCR-based Therapies Clinical Trial Analysis: Distribution by Trial Status
- Table 35.70 TCR-based Therapies Clinical Trial Analysis: Distribution by Trial Registration Year and Trial Status, Since 2017
- Table 35.71 TCR-based Therapies Clinical Trial Analysis: Distribution of Number of Trials by Trial Phase
- Table 35.72 TCR-based Therapies Clinical Trial Analysis: Distribution of Patient Enrolled by Trial Phase
- Table 35.73 TCR-based Therapies Clinical Trial Analysis: Distribution by Target Patient Segment
- Table 35.74 TCR-based Therapies Clinical Trial Analysis: Distribution by Type of Sponsor / Collaborator
- Table 35.75 TCR-based Therapies Clinical Trial Analysis: Distribution by Study Design
- Table 35.76 Most Active Industry Players: Distribution by Number of Registered Trials
- Table 35.77 Most Active Non-Industry Players: Distribution by Number of Registered Trials
- Table 35.78 TCR-based Therapies Clinical Trial Analysis: Distribution of Clinical Trials by Geography
- Table 35.79 TCR-based Therapies Clinical Trial Analysis: Distribution of Completed Clinical Trials by Geography
- Table 35.80 TCR-based Therapies Clinical Trial Analysis: Distribution of Active Clinical Trials by Geography
- Table 35.81 TCR-based Therapies Clinical Trial Analysis: Distribution of Patients Enrolled by Geography
- Table 35.82 TIL-based Therapies Clinical Trial Analysis: Cumulative Distribution by Trial Registration Year, Since 2017
- Table 35.83 TIL-based Therapies Clinical Trial Analysis: Distribution by Trial Registration Year and Patient Enrolled, Since 2017
- Table 35.84 TIL-based Therapies Clinical Trial Analysis: Distribution by Trial Status
- Table 35.85 TIL-based Therapies Clinical Trial Analysis: Distribution by Trial Registration Year and Trial Status, Since 2017
- Table 35.86 TIL-based Therapies Clinical Trial Analysis: Distribution of Number of Trials by Trial Phase
- Table 35.87 TIL-based Therapies Clinical Trial Analysis: Distribution of Patient Enrolled by Trial Phase
- Table 35.88 TIL-based Therapies Clinical Trial Analysis: Distribution by Target Patient Segment
- Table 35.89 TIL-based Therapies Clinical Trial Analysis: Distribution by Type of Sponsor / Collaborator
- Table 35.90 TIL-based Therapies Clinical Trial Analysis: Distribution by Study Design
- Table 35.91 Most Active Players: Distribution by Number of Registered Trials
- Table 35.92 Most Active Non-Industry Players: Distribution by Number of Registered Trials
- Table 35.93 TIL-based Therapies Clinical Trial Analysis: Distribution of Clinical Trials by Geography
- Table 35.94 TIL-based Therapies Clinical Trial Analysis: Distribution of Completed Clinical Trials by Geography
- Table 35.95 TIL-based Therapies Clinical Trial Analysis: Distribution of Active Clinical Trials by Geography
- Table 35.96 TIL-based Therapies Clinical Trial Analysis: Distribution of Patients Enrolled by Geography
- Table 35.97 CAR-T Therapies KOL Analysis: Distribution by Type of Organization
- Table 35.98 CAR-T Therapies KOL Analysis: Distribution by Affiliated Organization
- Table 35.99 CAR-T Therapies KOL Analysis: Distribution by Qualification
- Table 35.100 CAR-T Therapies KOL Analysis: Distribution by Geography
- Table 35.101 CAR-T Therapies Most Prominent KOLs: Distribution by RA Score
- Table 35.102 CAR-T Therapies Most Prominent KOLs: Comparison of RA Score with Third-Party Score
- Table 35.103 TCR-based Therapies KOL Analysis: Distribution by Type of Organization
- Table 35.104 TCR-based Therapies KOL Analysis: Distribution by Affiliated Organization
- Table 35.105 TCR-based Therapies KOL Analysis: Distribution by Qualification
- Table 35.106 TCR-based Therapies KOL Analysis: Distribution by Geography
- Table 35.107 TCR-based Therapies Most Prominent KOLs: Distribution by RA Score
- Table 35.108 TCR-based Therapies Most Prominent KOLs: Comparison of RA Score with Third-Party Score
- Table 35.109 TIL-based Therapies KOL Analysis: Distribution by Type of Organization
- Table 35.110 TIL-based Therapies KOL Analysis: Distribution by Affiliated Organization
- Table 35.111 TIL-based Therapies KOL Analysis: Distribution by Qualification
- Table 35.112 TIL-based Therapies KOL Analysis: Distribution by Geography
- Table 35.113 TIL-based Therapies Most Prominent KOLs: Distribution by RA Score
- Table 35.114 TIL-based Therapies Most Prominent KOLs: Comparison of RA Score with Third-Party Score
- Table 35.115 Kymriah(R): Estimated Sales Revenues
- Table 35.116 Yescarta(R): Estimated Sales Revenues
- Table 35.117 Tecartus(TM): Estimated Sales Revenues
- Table 35.118 Breyanzi(R): Estimated Sales Revenues
- Table 35.119 Abecma(R): Estimated Sales Revenues
- Table 35.120 Carvykti(R): Estimated Sales Revenues
- Table 35.121 Carteyva(R): Estimated Sales Revenues
- Table 35.122 AUTO1: Estimated Sales Revenues
- Table 35.123 AUTO3: Estimated Sales Revenues
- Table 35.124 Kimmtrak(R): Estimated Sales Revenues
- Table 35.125 GSK3377794: Estimated Sales Revenues
- Table 35.126 ADP-A2M4: Estimated Sales Revenues
- Table 35.127 TBI-1301: Estimated Sales Revenues
- Table 35.128 LN-144: Estimated Sales Revenues
- Table 35.129 LN-145: Estimated Sales Revenues
- Table 35.130 ITIL-168: Estimated Sales Revenues
- Table 35.131 LTX-315: Estimated Sales Revenues
- Table 35.132 Partnerships and Collaborations: Cumulative Year-Wise Trend, Since 2015
- Table 35.133 Partnerships and Collaborations: Distribution by Type of Partnership
- Table 35.134 Partnerships and Collaborations: Distribution by Type of Partnership, Since 2015
- Table 35.135 Partnerships and Collaborations: Distribution by Type of Product
- Table 35.136 Partnerships and Collaborations: Distribution by Year of Partnership and Type of Product
- Table 35.137 Partnerships and Collaborations: Distribution by Type of Partnership and Type of Product
- Table 35.138 Partnerships and Collaborations: Distribution by Type of Partner
- Table 35.139 Partnerships and Collaborations: Year-Wise Distribution by Type of Partner
- Table 35.140 Partnerships and Collaborations: Distribution by Type of Product and Type of Partner
- Table 35.141 Most Popular Products: Distribution by Number of Partnerships
- Table 35.142 Most Active Industry Players: Distribution by Number of Partnerships
- Table 35.143 Most Active Non-Industry Players: Distribution by Number of Partnerships
- Table 35.144 Partnerships and Collaborations: Distribution of Intercontinental and Intracontinental Deals
- Table 35.145 Partnerships and Collaborations: Distribution of International and Local Agreements
- Table 35.146 Funding and Investment Analysis: Cumulative Distribution of Instances by Year, Since 2018
- Table 35.147 Funding and Investment Analysis: Cumulative Distribution of Amount Invested by Year, Since 2018 (USD Million)
- Table 35.148 Funding and Investment Analysis: Distribution of Instances by Type of Funding
- Table 35.149 Funding and Investment Analysis: Distribution of Total Amount Invested by Type of Funding (USD Million)
- Table 35.150 Funding and Investments: Distribution of Amount Invested by Type of Therapy, Since 2018 (USD Million)
- Table 35.151 Funding and Investments: Distribution by Type of Investors
- Table 35.152 Funding and Investments: Distribution of Amount Invested by Type of Investor (USD Million)
- Table 35.153 Most Active Players: Distribution by Number of Instances
- Table 35.154 Most Active Players: Distribution by Amount Invested (USD Million)
- Table 35.155 Funding and Investment Analysis: Distribution of Amount Invested by Geography
- Table 35.156 Most Active Investors: Distribution by Number of Funding Instances
- Table 35.157 Patent Analysis: Distribution by Type of Patent
- Table 35.158 CAR-T Therapies Patent Analysis: Distribution by Patent Publication Year, Since 2017
- Table 35.159 CAR-T Therapies Patent Analysis: Distribution by Patent Application Year, Since 2017
- Table 35.160 CAR-T Therapies Patent Analysis: Year-wise Distribution of Granted Patents and Patent Applications, Since 2017
- Table 35.161 CAR-T Therapies Patent Analysis: Distribution by Patent Jurisdiction
- Table 35.162 CAR-T Therapies Patent Analysis: Cumulative Year-wise Distribution by Type of Applicant
- Table 35.163 Leading Industry Players: Distribution by Number of Patents
- Table 35.164 Leading Non-Industry Players: Distribution by Number of Patents
- Table 35.165 Leading Individual Assignees: Distribution by Number of Patents
- Table 35.166 Patent Benchmarking Analysis: Distribution of Patent Characteristics (CPC Codes) by Leading Industry Players
- Table 35.167 Patent Benchmarking Analysis: Distribution of Leading Industry Players by Patent Characteristics (CPC Codes)
- Table 35.168 CAR-T Therapies Patent Analysis: Distribution by Patent Age
- Table 35.169 CAR-T Therapy: Patent Valuation
- Table 35.170 TCR-based Therapies Patent Analysis: Cumulative Distribution by Patent Publication Year
- Table 35.171 CR-based Therapies Patent Analysis: Cumulative Distribution by Patent Application Year
- Table 35.172 TCR-based Therapies Patent Analysis: Cumulative Distribution by Annual Granted Patents
- Table 35.173 TCR-based Therapies Patent Analysis: Cumulative Distribution of Year-wise Filed Patent Applications
- Table 35.174 TCR-based Therapies Patent Analysis: Distribution by Year-wise filed Patents Application and Granted Patents
- Table 35.175 TCR-based Therapies Patent Analysis: Distribution by Geography
- Table 35.176 TCR-based Therapies Patent Analysis: Distribution by Type of Player
- Table 35.177 TCR-based Therapies Patent Analysis: Distribution by CPC Symbols
- Table 35.178 Leading Industry Players: Distribution by Number of Patents
- Table 35.179 Leading Non-Industry Players: Distribution by Number of Patents
- Table 35.180 Leading Patent Assignees: Distribution by Number of Patents
- Table 35.181 Patent Analysis: Distribution by Patent Age
- Table 35.182 TCR-based Therapies: Patent Valuation Analysis
- Table 35.183 TIL-based Therapies Patent Analysis: Cumulative Distribution by Patent Publication Year
- Table 35.184 IL-based Therapies Patent Analysis: Cumulative Distribution by Patent Application Year
- Table 35.185 TIL-based Therapies Patent Analysis: Cumulative Distribution by Annual Granted Patents
- Table 35.186 TIL-based Therapies Patent Analysis: Cumulative Distribution of Year-wise Filed Patent Applications
- Table 35.187 TIL-based Therapies Patent Analysis: Distribution by Year-wise filed Patent Applications and Granted patents
- Table 35.188 IL-based Therapies Patent Analysis: Distribution by Geography
- Table 35.189 TIL-based Therapies Patent Analysis: Distribution by Type of Player
- Table 35.190 TIL-based Therapies Patent Analysis: Distribution by CPC Symbols
- Table 35.191 Leading Industry Players: Distribution by Number of Patents
- Table 35.192 Leading Non-Industry Players: Distribution by Number of Patents
- Table 35.193 Leading Patent Assignees: Distribution by Number of Patents
- Table 35.194 atent Analysis: Distribution by Patent Age
- Table 35.195 Other T-Cell Immunotherapies: Analysis by Type of T-Cell
- Table 35.196 Other T-Cell Immunotherapies: Analysis by Source of T-Cells
- Table 35.197 Other T-Cell Immunotherapies: Distribution by Stage of Development
- Table 35.198 Other T-Cell Immunotherapies: Distribution by Therapeutic Area
- Table 35.199 Global T-Cell Therapies Market, Historical Trends (since 2018) and Forecasted Estimates (till 2035) (USD Billion)
- Table 35.200 Global T-Cell Therapies Market, (till 2035): Conservative Scenario (USD Billion)
- Table 35.201 Global T-Cell Therapies Market, (till 2035): Optimistic Scenario (USD Billion)
- Table 35.202 T-Cell Therapies Market for CAR-T: Historical Trends (since 2018) and Forecasted Estimates (till 2035), Conservative, Base and Optimistic Scenarios (USD Billion)
- Table 35.203 T-Cell Therapies Market for TCR: Historical Trends (since 2022) and Forecasted Estimates (till 2035), Conservative, Base and Optimistic Scenarios (USD Billion)
- Table 35.204 T-Cell Therapies Market for TIL: Forecasted Estimates (till 2035), Conservative, Base and Optimistic Scenarios (USD Billion)
- Table 35.205 CAR-T Therapies Market for Multiple Myeloma: Forecasted Estimates (till 2035), Conservative, Base and Optimistic Scenarios (USD Million)
- Table 35.206 CAR-T Therapies Market for Large B-cell Lymphoma: Forecasted Estimates (till 2035), Conservative, Base and Optimistic Scenarios (USD Million)
- Table 35.207 CAR-T Therapies Market for Acute Lymphoblastic Leukemia: Forecasted Estimates (till 2035), Conservative, Base and Optimistic Scenarios (USD Million)
- Table 35.208 CAR-T Therapies Market for Diffuse Large B-cell Lymphoma: Forecasted Estimates (till 2035), Conservative, Base and Optimistic Scenarios (USD Million)
- Table 35.209 CAR-T Therapies Market for Diffuse Large B-cell Lymphoma, Large B-cell Lymphoma: Forecasted Estimates (till 2035), Conservative, Base and Optimistic Scenarios (USD Million)
- Table 35.210 CAR-T Therapies Market for Acute Lymphoblastic Leukemia/ B-cell Non-Hodgkin Lymphoma: Forecasted Estimates (2029-2035) Conservative, Base and Optimistic Scenarios (USD Million)
- Table 35.211 CAR-T Therapies Market for Non-Hodgkin Lymphoma: Forecasted Estimates (till 2035) Conservative, Base and Optimistic Scenarios (USD Million)
- Table 35.212 CAR-T Therapies Market for Mantle Cell Lymphoma: Forecasted Estimates (till 2035) Conservative, Base and Optimistic Scenarios (USD Million)
- Table 35.213 CAR-T Therapies Market for Acute Myeloid Leukemia: Forecasted Estimates (till 2035) Conservative, Base and Optimistic Scenarios (USD Million)
- Table 35.214 CAR-T Therapies Market for Generalized Myasthenia Gravis: Forecasted Estimates (till 2035) Conservative, Base and Optimistic Scenarios (USD Million)
- Table 35.215 CAR-T Therapies Market for Renal transplantation: Forecasted Estimates (till 2035) Conservative, Base and Optimistic Scenarios (USD Million)
- Table 35.216 CAR-T Therapies Market for Gastric Adenocarcinoma: Forecasted Estimates (till 2035) Conservative, Base and Optimistic Scenarios (USD Million)
- Table 35.217 CAR-T Therapies Market for Ovarian and endometrial cancer: Forecasted Estimates (till 2035) Conservative, Base and Optimistic Scenarios (USD Million)
- Table 35.218 CAR-T Therapies Market for Chronic Lymphocytic Leukemia: Forecasted Estimates (2027-2035) Conservative, Base and Optimistic Scenarios (USD Million)
- Table 35.219 CAR-T Therapies Market for Follicular Lymphoma: Forecasted Estimates (till 2035) Conservative, Base and Optimistic Scenarios (USD Million)
- Table 35.220 CAR-T Therapies Market for Renal Cell Carcinoma: Forecasted Estimates (till 2035) Conservative, Base and Optimistic Scenarios (USD Million)
- Table 35.221 TCR Therapies Market for Melanoma: Forecasted Estimates (till 2035) Conservative, Base and Optimistic Scenarios (USD Million)
- Table 35.222 TCR Therapies Market for Sarcoma: Forecasted Estimates (till 2035) Conservative, Base and Optimistic Scenarios (USD Million)
- Table 35.223 TCR Therapies Market for Head and Neck Cancer: Forecasted Estimates (till 2035) Conservative, Base and Optimistic Scenarios (USD Million)
- Table 35.224 TCR Therapies Market for Hepatocellular Carcinoma: Forecasted Estimates (till 2035) Conservative, Base and Optimistic Scenarios (USD Million)
- Table 35.225 TCR Therapies Market for Nasopharyngeal Carcinoma: Forecasted Estimates (till 2035) Conservative, Base and Optimistic Scenarios (USD Million)
- Table 35.226 TCR Therapies Market for Ovarian Cancer: Forecasted Estimates (till 2035) Conservative, Base and Optimistic Scenarios (USD Million)
- Table 35.227 TCR Therapies Market for Acute Myeloid Leukemia: Forecasted Estimates (till 2035) Conservative, Base and Optimistic Scenarios (USD Million)
- Table 35.228 TIL Therapies Market for Melanoma: Forecasted Estimates (till 2035) Conservative, Base and Optimistic Scenarios (USD Million)
- Table 35.229 TIL Ther Therapies apy Market for Basal Cell Carcinoma: Forecasted Estimates (till 2035) Conservative, Base and Optimistic Scenarios (USD Million)
- Table 35.230 TIL Therapies Market for Lung Cancer: Forecasted Estimates (till 2035) Conservative, Base and Optimistic Scenarios (USD Million)
- Table 35.231 TIL Therapies Market for Sarcoma: Forecasted Estimates (till 2035) Conservative, Base and Optimistic Scenarios (USD Million)
- Table 35.232 TIL Therapies Market for Head and Neck Cancer: Forecasted Estimates (till 2035) Conservative, Base and Optimistic Scenarios (USD Million)
- Table 35.233 TIL Therapies Market for Cervical Cancer: Forecasted Estimates (till 2035) Conservative, Base and Optimistic Scenarios (USD Million)
- Table 35.234 TIL Therapies Market for Neuro Gastro-Intestinal (GI) Cancer: Forecasted Estimates (till 2035) Conservative, Base and Optimistic Scenarios (USD Million)
- Table 35.235 TIL Therapies Market for Breast Cancer: Forecasted Estimates (till 2035) Conservative, Base and Optimistic Scenarios (USD Million)
- Table 35.236 CAR-T Therapies Market for BCMA: Forecasted Estimates (till 2035), Conservative, Base and Optimistic Scenarios (USD Million)
- Table 35.237 CAR-T Therapies Market for CD19: Forecasted Estimates (till 2035), Conservative, Base and Optimistic Scenarios (USD Million)
- Table 35.238 CAR-T Therapies Market for CD20: Forecasted Estimates (till 2035), Conservative, Base and Optimistic Scenarios (USD Million)
- Table 35.239 CAR-T Therapies Market for CD19 / CD22: Forecasted Estimates (till 2035), Conservative, Base and Optimistic Scenarios (USD Million)
- Table 35.240 CAR-T Therapies Market for Other Antigens: Forecasted Estimates (till 2035), Conservative, Base and Optimistic Scenarios (USD Million)
- Table 35.241 TCR Therapies Market for HLA: Forecasted Estimates (till 2035), Conservative, Base and Optimistic Scenarios (USD Million)
- Table 35.242 TCR Therapies Market for MAGE: Forecasted Estimates (till 2035), Conservative, Base and Optimistic Scenarios (USD Million)
- Table 35.243 TCR Therapies Market for PRAME: Forecasted Estimates (till 2035), Conservative, Base and Optimistic Scenarios (USD Million)
- Table 35.244 TCR Therapies Market for NY-ESO-1 and LAGE: Forecasted Estimates (till 2035), Conservative, Base and Optimistic Scenarios (USD Million)
- Table 35.245 TCR Therapies Market for EBV: Forecasted Estimates (till 2035), Conservative, Base and Optimistic Scenarios (USD Million)
- Table 35.246 TCR Therapies Market for HBV: Forecasted Estimates (till 2035), Conservative, Base and Optimistic Scenarios (USD Million)
- Table 35.247 TCR Therapies Market for Mid-Sized Companies: Forecasted Estimates (till 2035) Conservative, Base and Optimistic Scenarios (USD Million)
- Table 35.248 TCR Therapies Market for Large Companies: Forecasted Estimates (till 2035) Conservative, Base and Optimistic Scenarios (USD Million)
- Table 35.249 TIL Therapies Market for Small Companies: Forecasted Estimates (till 2035) Conservative, Base and Optimistic Scenarios (USD Million)
- Table 35.250 TIL Therapies Market for Large Companies: Forecasted Estimates (till 2035) Conservative, Base and Optimistic Scenarios (USD Million)
- Table 35.251 CAR-T Therapies Market in North America: Forecasted Estimates (till 2035), Conservative, Base and Optimistic Scenarios (USD Million)
- Table 35.252 CAR-T Therapies Market in Europe: Forecasted Estimates (till 2035), Conservative, Base and Optimistic Scenarios (USD Million)
- Table 35.253 CAR-T Therapies Market in Asia Pacific: Forecasted Estimates (till 2035), Conservative, Base and Optimistic Scenarios (USD Million)
- Table 35.254 CAR-T Therapies Market in Latin America: Forecasted Estimates (till 2035), Conservative, Base and Optimistic Scenarios (USD Million)
- Table 35.255 CAR-T Therapies Market in Middle East and North Africa: Forecasted Estimates (till 2035), Conservative, Base and Optimistic Scenarios (USD Million)
- Table 35.256 CAR-T Therapies Market in Rest of the World: Forecasted Estimates (till 2035), Conservative, Base and Optimistic Scenarios (USD Million)
- Table 35.257 TCR Therapies Market in North America: Forecasted Estimates (till 2035), Conservative, Base and Optimistic Scenarios (USD Million)
- Table 35.258 TCR Therapies Market in Europe: Forecasted Estimates (till 2035), Conservative, Base and Optimistic Scenarios (USD Million)
- Table 35.259 TCR Therapies Market in Asia-Pacific: Forecasted Estimates (till 2035), Conservative, Base and Optimistic Scenarios (USD Million)
- Table 35.260 TCR Therapies Market in Rest of the World: Forecasted Estimates (till 2035), Conservative, Base and Optimistic Scenarios (USD Million)
- Table 35.261 TIL Therapies Market in North America: Forecasted Estimates (till 2035), Conservative, Base and Optimistic Scenarios (USD Million)
- Table 35.262 TIL Therapies Market in Europe: Forecasted Estimates (till 2035), Conservative, Base and Optimistic Scenarios (USD Million)
- Table 35.263 TIL Therapies Market in Rest of the World: Forecasted Estimates (till 2035), Conservative, Base and Optimistic Scenarios (USD Million)
- Table 35.264 CAR-T Therapies Market: Gilead Sciences Sales Forecast (till 2035), Conservative, Base and Optimistic Scenarios (USD Million)
- Table 35.265 CAR-T Therapies Market: Bristol Myers Squibb Sales Forecast (till 2035), Conservative, Base and Optimistic Scenarios (USD Million)
- Table 35.266 CAR-T Therapies Market: Novartis Sales Forecast (till 2035), Conservative, Base and Optimistic Scenarios (USD Million)
- Table 35.267 CAR-T Therapies Market: Janssen Sales Forecast (till 2035), Conservative, Base and Optimistic Scenarios (USD Million)
- Table 35.268 CAR-T Therapies Market: JW Therapeutics Sales Forecast (till 2035), Conservative, Base and Optimistic Scenarios (USD Million)
- Table 35.269 TCR Therapies Market: Immunocore Sales Forecast (till 2035), Conservative, Base and Optimistic Scenarios (USD Million)
- Table 35.270 TCR Therapies Market: Adaptimmune Therapeutics Sales Forecast (till 2035), Conservative, Base and Optimistic Scenarios (USD Million)
- Table 35.271 TCR Therapies Market: TCRCure Biopharma Sales Forecast (till 2035), Conservative, Base and Optimistic Scenarios (USD Million)
- Table 35.272 TCR Therapies Market: Lion TCR Sales Forecast (till 2035), Conservative, Base and Optimistic Scenarios (USD Million)
- Table 35.273 TCR Therapies Market: Miltenyi Biomedicine Sales Forecast (till 2035), Conservative, Base and Optimistic Scenarios (USD Million)
- Table 35.274 TIL Therapies Market: Iovance Biotherapeutics Sales Forecast (till 2035), Conservative, Base and Optimistic Scenarios (USD Million)
- Table 35.275 TIL Therapies Market: Lytix Biopharma Sales Forecast (till 2035), Conservative, Base and Optimistic Scenarios (USD Million)
- Table 35.276 TIL Therapies Market: Bristol-Myers Squibb Sales Forecast (till 2035), Conservative, Base and Optimistic Scenarios (USD Million)
- Table 35.277 TIL Therapies Market: Intima Bioscience Sales Forecast (till 2035), Conservative, Base and Optimistic Scenarios (USD Million)
- Table 35.278 CAR-T Therapies Market: Kymriah (Tisagenlecleucel-T) Sales Forecast (till 2035), Conservative, Base and Optimistic Scenarios (USD Million)
- Table 35.279 CAR-T Therapies Market: Yescarta (axicabtagene ciloleucel) Sales Forecast (till 2035), Conservative, Base and Optimistic Scenarios (USD Million)
- Table 35.280 CAR-T Therapies Market: Tecartus (Brexucabtagene Autoleucel) Sales Forecast (till 2035), Conservative, Base and Optimistic Scenarios (USD Million)
- Table 35.281 CAR-T Therapies Market: Abecma (Idecabtagene Vicleucel / bb2121) Sales Forecast (till 2035), Conservative, Base and Optimistic Scenarios (USD Million)
- Table 35.282 CAR-T Therapies Market: CARVYKTI (LCAR-B38M CAR-T / JNJ-68284528 / Ciltacabtagene Autoleucel) Sales Forecast (till 2035), Conservative, Base and Optimistic Scenarios (USD Million)
- Table 35.283 CAR-T Therapies Market: BREYANZI (Lisocabtagene maraleucel, JCAR017) Sales Forecast (till 2035), Conservative, Base and Optimistic Scenarios (USD Million)
- Table 35.284 CAR-T Therapies Market: Carteyva (Relmacabtagene autoleucel / JWCAR029) Sales Forecast (till 2035), Conservative, Base and Optimistic Scenarios (USD Million)
- Table 35.285 CAR-T Therapies Market: NexCART Sales Forecast (till 2035), Conservative, Base and Optimistic Scenarios (USD Million)
- Table 35.286 CAR-T Therapies Market: Fucaso (Equecabtagene Autoleucel) Sales Forecast (till 2035), Conservative, Base and Optimistic Scenarios (USD Million)
- Table 35.287 CAR-T Therapies Market: Inaticabtagene Autoleucel CNCT19 / HY001 Sales Forecast (till 2035), Conservative, Base and Optimistic Scenarios (USD Million)
- Table 35.288 CAR-T Therapies Market: Zevorcabtagene autoleucel (CT053) Sales Forecast (till 2035), Conservative, Base and Optimistic Scenarios (USD Million)
- Table 35.289 CAR-T Therapies Market: CAR-BCMA T cells Sales Forecast (till 2035), Conservative, Base and Optimistic Scenarios (USD Million)
- Table 35.290 CAR-T Therapies Market: CAR-T-CD19 Cells Sales Forecast (till 2035), Conservative, Base and Optimistic Scenarios (USD Million)
- Table 35.291 CAR-T Therapies Market: Descartes-08 Sales Forecast (till 2035), Conservative, Base and Optimistic Scenarios (USD Million)
- Table 35.292 CAR-T Therapies Market: Zamtocabtagene Autoleucel (MB-CART2019.1) Sales Forecast (till 2035), Conservative, Base and Optimistic Scenarios (USD Million)
- Table 35.293 CAR-T Therapies Market: CAR-T ddBCMA Sales Forecast (till 2035), Conservative, Base and Optimistic Scenarios (USD Million)
- Table 35.294 CAR-T Therapies Market: CRG-022 cells Sales Forecast (till 2035), Conservative, Base and Optimistic Scenarios (USD Million)
- Table 35.295 CAR-T Therapies Market: CT041 Sales Forecast (till 2035), Conservative, Base and Optimistic Scenarios (USD Million)
- Table 35.296 CAR-T Therapies Market: ALLO-501A / ALLO-501 Sales Forecast (till 2035), Conservative, Base and Optimistic Scenarios (USD Million)
- Table 35.297 CAR-T Therapies Market: ALLO-605 Sales Forecast (till 2035), Conservative, Base and Optimistic Scenarios (USD Million)
- Table 35.298 CAR-T Therapies Market: Descartes-25 Sales Forecast (till 2035), Conservative, Base and Optimistic Scenarios (USD Million)
- Table 35.299 CAR-T Therapies Market: AUTO1 Sales Forecast (till 2035), Conservative, Base and Optimistic Scenarios (USD Million)
- Table 35.300 CAR-T Therapies Market: AUTO3 (CD19/22 CAR-T) Sales Forecast (till 2035), Conservative, Base and Optimistic Scenarios (USD Million)
- Table 35.301 CAR-T Therapies Market: AUTO4 (CD19/22 CAR-T) Sales Forecast (till 2035), Conservative, Base and Optimistic Scenarios (USD Million)
- Table 35.302 CAR-T Therapies Market: CD19-CAR-T Sales Forecast (till 2035), Conservative, Base and Optimistic Scenarios (USD Million)
- Table 35.303 CAR-T Therapies Market: Humanized CD19-CAR-T Sales Forecast (till 2035), Conservative, Base and Optimistic Scenarios (USD Million)
- Table 35.304 CAR-T Therapies Market: IM19 CAR-T Sales Forecast (till 2035), Conservative, Base and Optimistic Scenarios (USD Million)
- Table 35.305 CAR-T Therapies Market: CCT301 CAR-T Sales Forecast (till 2035), Conservative, Base and Optimistic Scenarios (USD Million)
- Table 35.306 CAR-T Therapies Market: CARCIK-CD19 Sales Forecast (till 2035), Conservative, Base and Optimistic Scenarios (USD Million)
- Table 35.307 CAR-T Therapies Market: CD123 CAR-Ts Sales Forecast (till 2035), Conservative, Base and Optimistic Scenarios (USD Million)
- Table 35.308 CAR-T Therapies Market: BCMA CAR-T Sales Forecast (till 2035), Conservative, Base and Optimistic Scenarios (USD Million)
- Table 35.309 CAR-T Therapies Market: CD19/CD22-CAR-T Sales Forecast (till 2035), Conservative, Base and Optimistic Scenarios (USD Million)
- Table 35.310 AR-T Therapies Market: GC012F (Dual CAR-BCMA-19) Sales Forecast (till 2035), Conservative, Base and Optimistic Scenarios (USD Million)
- Table 35.311 TCR Therapies Market: Kimmtrak (IMCgp100 / Tebentafusp) Sales Forecast (till 2035), Conservative, Base and Optimistic Scenarios (USD Million)
- Table 35.312 TCR Therapies Market: TECELRA(R) (Afamitresgene Autoleucel) Sales Forecast (till 2035), Conservative, Base and Optimistic Scenarios (USD Million)
- Table 35.313 TCR Therapies Market: Brenetafusp (IMC-F106C) Sales Forecast (till 2035), Conservative, Base and Optimistic Scenarios (USD Million)
- Table 35.314 TCR Therapies Market: lete-cel Sales Forecast (till 2035), Conservative, Base and Optimistic Scenarios (USD Million)
- Table 35.315 TCR Therapies Market: ADP-A2M4CD8 Sales Forecast (till 2035), Conservative, Base and Optimistic Scenarios (USD Million)
- Table 35.316 TCR Therapies Market: EBV-specific TCR-T cell with anti-PD1 auto-secreted element Sales Forecast (till 2035), Conservative, Base and Optimistic Scenarios (USD Million)
- Table 35.317 TCR Therapies Market: Unnamed TCR Therapy Sales Forecast (till 2035), Conservative, Base and Optimistic Scenarios (USD Million)
- Table 35.318 TCR Therapies Market: MB-dNPM1 Sales Forecast (till 2035), Conservative, Base and Optimistic Scenarios (USD Million)
- Table 35.319 TIL Therapies Market: AMTAGVI Sales Forecast (till 2035), Conservative, Base and Optimistic Scenarios (USD Million)
- Table 35.320 TIL Therapies Market: LN-145 Sales Forecast (till 2035), Conservative, Base and Optimistic Scenarios (USD Million)
- Table 35.321 TIL Therapies Market: IOV-4001 Sales Forecast (till 2035), Conservative, Base and Optimistic Scenarios (USD Million)
- Table 35.322 TIL Therapies Market: LTX-315 and TILs Sales Forecast (till 2035), Conservative, Base and Optimistic Scenarios (USD Million)
- Table 35.223 TIL Therapies Market: TILs Sales Forecast (till 2035), Conservative, Base and Optimistic Scenarios (USD Million)
- Table 35.324 TIL Therapies Market: TIL (Cyclophosphamide) Sales Forecast (till 2035), Conservative, Base and Optimistic Scenarios (USD Million)
List of Figures
- Figure 2.1 Research Methodology: Project Methodology
- Figure 2.2 Research Methodology: Data Sources for Secondary Research
- Figure 2.3 Research Methodology: Robust Quality Control
- Figure 3.1 Market Dynamics: Forecast Methodology
- Figure 3.2 Market Dynamics: Market Assessment Framework
- Figure 4.1 Lessons Learnt from Past Recessions
- Figure 5.1 Executive Summary: Overall Market Landscape
- Figure 5.2 Executive Summary: Recent Trends Analysis
- Figure 5.3 Executive Summary: Market Sizing and Opportunity Analysis
- Figure 6.1 Pillars of Cancer Therapy
- Figure 6.2 Differences between Active and Passive Immunotherapies
- Figure 6.3 Differences between Specific and Non-Specific Immunotherapies
- Figure 6.4 Strategies Employed for the Redirection of T-Cells
- Figure 6.5 T-Cell Manufacturing: General Procedure
- Figure 6.6 Development History of CAR-T cells
- Figure 6.7 Structure of Chimeric Antigen Receptor
- Figure 6.8 Chimeric Antigen Receptors: Structural Variations across Different Generations
- Figure 6.9 CAR-T Therapies: Development Process
- Figure 6.10 Challenges Associated with CAR-T Therapies
- Figure 6.11 TCR-based Therapies: Development Process
- Figure 6.12 TIL-based Therapies: Development Process
- Figure 6.13 T-Cell Immunotherapies: Benefits and Roadblocks
- Figure 7.1 CAR-T Therapies: Distribution by Stage of Development
- Figure 7.2 CAR-T Therapies: Distribution by Type of Therapy
- Figure 7.3 CAR-T Therapies: Distribution by Target Antigen
- Figure 7.4 CAR-T Therapies: Distribution by Target Indication
- Figure 7.5 CAR-T Therapies: Distribution by Therapeutic Area
- Figure 7.6 CAR-T Therapies: Distribution by Stage of Development and Therapeutic Area
- Figure 7.7 CAR-T Therapies: Distribution by Source of T-cells
- Figure 7.8 CAR-T Therapies: Distribution by Stage of Development and Source of T-cells
- Figure 7.9 CAR-T Therapies: Distribution by Route of Administration
- Figure 7.10 CAR-T Therapies: Distribution by Dosing Frequency
- Figure 7.11 CAR-T Therapies: Distribution by Target Patient Segment
- Figure 7.12 Most Active Industry Players: Distribution by Number of CAR-T Therapies Developed
- Figure 7.13 Most Active Non-Industry Players: Distribution by Number of CAR-T Therapies Developed
- Figure 7.14 CAR-T Therapies Developers: Distribution by Year of Establishment
- Figure 7.15 CAR-T Therapies Developers: Distribution by Company Size
- Figure 7.16 CAR-T Therapies Developers: Distribution by Location of Headquarters (Region)
- Figure 7.17 CAR-T Therapies Developers: Distribution by Location of Headquarters (Country)
- Figure 8.1 TCR-based Therapies: Distribution by Stage of Development
- Figure 8.2 TCR-based Therapies: Distribution by Therapeutic Area
- Figure 8.3 TCR-based Therapies: Distribution by Stage of Development and Therapeutic Area
- Figure 8.4 TCR-based Therapies: Distribution by Target Indication
- Figure 8.5 TCR-based Therapies: Distribution by Target Antigen
- Figure 8.6 TCR-based Therapies: Distribution by Source of T-Cells
- Figure 8.7 TCR-based Therapies: Distribution by Route of Administration
- Figure 8.8 TCR-based Therapies: Distribution by Dosing Frequency
- Figure 8.9 TCR-based Therapies: Distribution by Target Patient Segment
- Figure 8.10 TCR-based Therapies: Distribution by Type of Therapy
- Figure 8.11 TCR-based Therapies: Distribution by Stage of Development and Type of Therapy
- Figure 8.12 Most Active Industry Players: Distribution by Number of TCR-based Therapies Developed
- Figure 8.13 Most Active Non-Industry Players: Distribution by Number of TCR-based Therapies Developed
- Figure 8.14 TCR-based Therapy Developers: Distribution by Year of Establishment
- Figure 8.15 TCR-based Therapy Developers: Distribution by Company Size
- Figure 8.16 TCR-based Therapy Developers: Distribution by Location of Headquarters
- Figure 9.1 TIL-based Therapies: Distribution by Type of Developer
- Figure 9.2 TIL-based Therapies: Distribution by Stage of Development
- Figure 9.3 TIL-based Therapies: Distribution by Route of Administration
- Figure 9.4 TIL-based Therapies: Distribution by Dosing Frequency
- Figure 9.5 TIL-based Therapies: Distribution by Target Patient Segment
- Figure 9.6 TIL-based Therapies: Distribution by Type of Therapy
- Figure 9.7 TIL-based Therapies: Distribution by Target Indications
- Figure 9.8 Most Active Industry Players: Distribution by Number of TIL-based Therapies Developed
- Figure 9.9 Most Active Non-Industry Players: Distribution by Number of TIL-based Therapies Developed
- Figure 9.10 TIL-based Therapy Developers: Distribution by Year of Establishment
- Figure 9.11 TIL-based Therapy Developers: Distribution by Company Size
- Figure 9.12 TIL-based Therapy Developers: Distribution by Location of Headquarters
- Figure 10.1 CAR-T Therapies: Popular Targets in Hematological Malignancies
- Figure 10.2 CAR-T Therapies: Popular Targets in Solid Tumors
- Figure 10.3 CAR-Construction: Distribution by Generation of CAR-T Therapies
- Figure 10.4 CAR-Construction: Distribution by Type of scFv Antibody Used
- Figure 10.5 CAR-Construction: Distribution by Type of Virus Used
- Figure 10.6 CAR-Construction: Distribution by Type of Gene Transfer Method Used
- Figure 10.7 CAR-Construction: Distribution by Type of Co-Stimulatory Domain
- Figure 11.1 Clinical Trial Analysis: Scope and Methodology
- Figure 11.2 Clinical Trial Analysis: Cumulative Year-wise Trend, Since 2017
- Figure 11.3 Clinical Trial Analysis: Year-wise Trend of Patients Enrolled by Trial Registration Year, Since 2017
- Figure 11.4 Clinical Trial Analysis: Distribution by Trial Phase
- Figure 11.5 Clinical Trial Analysis: Distribution of Number of Patients Enrolled by Trial Phase
- Figure 11.6 Clinical Trial Analysis: Distribution by Trial Registration Year and Trial Phase, Since 2017
- Figure 11.7 Clinical Trial Analysis: Distribution by Trial Status
- Figure 11.8 Clinical Trial Analysis: Distribution by Patient Gender
- Figure 11.9 Clinical Trial Analysis: Distribution by Therapeutic Area
- Figure 11.10 Clinical Trial Analysis: Distribution by Type of Trial Masking
- Figure 11.11 Clinical Trial Analysis: Distribution by Type of Intervention Model
- Figure 11.12 Clinical Trial Analysis: Distribution by Trial Purpose
- Figure 11.13 Clinical Trial Analysis: Distribution by Design Allocation
- Figure 11.14 Leading Industry Players: Distribution by Number of Registered Trials
- Figure 11.15 Leading Non-Industry Players: Distribution by Number of Registered Trials
- Figure 11.16 Clinical Trial Analysis: Distribution of Clinical Trials by Trial Status and Geography
- Figure 11.17 Clinical Trial Analysis: Distribution of Patients Enrolled by Trial Status and Geography
- Figure 11.18 TCR-based Therapies Clinical Trial Analysis: Cumulative Distribution by Trial Registration Year, Since 2017
- Figure 11.19 TCR-based Therapies Clinical Trial Analysis: Distribution by Trial Registration Year and Patient Enrolled, Since 2017
- Figure 11.20 TCR-based Therapies Clinical Trial Analysis: Distribution by Trial Status
- Figure 11.21 TCR-based Therapies Clinical Trial Analysis: Distribution by Trial Registration Year and Trial Status, Since 2017
- Figure 11.22 TCR-based Therapies Clinical Trial Analysis: Distribution of Number of Trials by Trial Phase
- Figure 11.23 TCR-based Therapies Clinical Trial Analysis: Distribution of Patient Enrolled by Trial Phase
- Figure 11.24 TCR-based Therapies Clinical Trial Analysis: Distribution by Target Patient Segment
- Figure 11.25 TCR-based Therapies Clinical Trial Analysis: Distribution by Type of Sponsor / Collaborator
- Figure 11.26 TCR-based Therapies Clinical Trial Analysis: Distribution by Study Design
- Figure 11.27 Most Active Industry Players: Distribution by Number of Registered Trials
- Figure 11.28 Most Active Non-Industry Players: Distribution by Number of Registered Trials
- Figure 11.29 TCR-based Therapies Clinical Trial Analysis: Emerging Focus Areas
- Figure 11.30 TCR-based Therapies Clinical Trial Analysis: Distribution of Clinical Trials by Geography
- Figure 11.31 TCR-based Therapies Clinical Trial Analysis: Distribution of Completed Clinical Trials by Geography
- Figure 11.32 TCR-based Therapies Clinical Trial Analysis: Distribution of Active Clinical Trials by Geography
- Figure 11.33 TCR-based Therapies Clinical Trial Analysis: Distribution of Patients Enrolled by Geography
- Figure 11.34 TIL-based Therapies Clinical Trial Analysis: Cumulative Distribution by Trial Registration Year, Since 2017
- Figure 11.35 TIL-based Therapies Clinical Trial Analysis: Distribution by Trial Registration Year and Patient Enrolled, Since 2017
- Figure 11.36 TIL-based Therapies Clinical Trial Analysis: Distribution by Trial Status
- Figure 11.37 TIL-based Therapies Clinical Trial Analysis: Distribution by Trial Registration Year and Trial Status, Since 2017
- Figure 11.38 TIL-based Therapies Clinical Trial Analysis: Distribution of Number of Trials by Trial Phase
- Figure 11.39 TIL-based Therapies Clinical Trial Analysis: Distribution of Patient Enrolled by Trial Phase
- Figure 11.40 TIL-based Therapies Clinical Trial Analysis: Distribution by Target Patient Segment
- Figure 11.41 TIL-based Therapies Clinical Trial Analysis: Distribution by Type of Sponsor / Collaborator
- Figure 11.42 TIL-based Therapies Clinical Trial Analysis: Distribution by Study Design
- Figure 11.43 Most Active Industry Players: Distribution by Number of Registered Trials
- Figure 11.44 Most Active Non-Industry Players: Distribution by Number of Registered Trials
- Figure 11.45 TIL-based Therapies Clinical Trial Analysis: Emerging Focus Areas
- Figure 11.46 TIL-based Therapies Clinical Trial Analysis: Distribution of Clinical Trials by Geography
- Figure 11.47 TIL-based Therapies Clinical Trial Analysis: Distribution of Completed Clinical Trials by Geography
- Figure 11.48 TIL-based Therapies Clinical Trial Analysis: Distribution of Active Clinical Trials by Geography
- Figure 11.49 TIL-based Therapies Clinical Trial Analysis: Distribution of Patients Enrolled by Geography
- Figure 12.1 CAR-T Therapies KOL Analysis: Distribution by Type of Organization
- Figure 12.2 CAR-T Therapies KOL Analysis: Distribution by Affiliated Organization
- Figure 12.3 CAR-T Therapies KOL Analysis: Distribution by Qualification
- Figure 12.4 CAR-T Therapies KOL Analysis: Distribution by Geography
- Figure 12.5 CAR-T Therapies Scatter Plot: KOL Activeness versus KOL Strength
- Figure 12.6 CAR-T Therapies Most Prominent KOLs: KOL Activeness versus KOL Strength
- Figure 12.7 CAR-T Therapies Most Prominent KOLs: Distribution by RA Score
- Figure 12.8 CAR-T Therapies Most Prominent KOLs: Comparison of RA Score with Third-Party Score
- Figure 12.9 CAR-T Therapies Most Prominent KOLs: Comparison of RA Score with Third-Party Score (Scatter Plot)
- Figure 12.10 TCR-based Therapies KOL Analysis: Distribution by Type of Organization
- Figure 12.11 TCR-based Therapies KOL Analysis: Distribution by Affiliated Organization
- Figure 12.12 TCR-based Therapies KOL Analysis: Distribution by Qualification
- Figure 12.13 TCR-based Therapies KOL Analysis: Distribution by Geography
- Figure 12.14 TCR-based Therapies Scatter Plot: KOL Activeness versus KOL Strength
- Figure 12.15 TCR-based Therapies Most Prominent KOLs: KOL Activeness versus KOL Strength
- Figure 12.16 TCR-based Therapies Most Prominent KOLs: Distribution by RA Score
- Figure 12.17 TCR-based Therapies Most Prominent KOLs: Comparison of RA Score with Third-Party Score
- Figure 12.18 TCR-based Therapies Most Prominent KOLs: Comparison of RA Score with Third-Party Score (Scatter Plot)
- Figure 12.19 TIL-based Therapies KOL Analysis: Distribution by Type of Organization
- Figure 12.20 TIL-based Therapies KOL Analysis: Distribution by Affiliated Organization
- Figure 12.21 TIL-based Therapies KOL Analysis: Distribution by Qualification
- Figure 12.22 TIL-based Therapies KOL Analysis: Distribution by Geography
- Figure 12.23 TIL-based Therapies Scatter Plot: KOL Activeness versus KOL Strength
- Figure 12.24 TIL-based Therapies Most Prominent KOLs: KOL Activeness versus KOL Strength
- Figure 12.25 TIL-based Therapies Most Prominent KOLs: Distribution by RA Score
- Figure 12.26 TIL-based Therapies Most Prominent KOLs: Comparison of RA Score with Third-Party Score
- Figure 12.27 TIL-based Therapies Most Prominent KOLs: Comparison of RA Score with Third-Party Score (Scatter Plot)
- Figure 13.1 Kymriah: Estimated Sales Revenues
- Figure 13.2 Yescarta: Estimated Sales Revenues
- Figure 13.3 Tecartus: Estimated Sales Revenues
- Figure 13.4 Breyanzi: Estimated Sales Revenues
- Figure 13.5 Abecma: Estimated Sales Revenues
- Figure 13.6 Carvykti: Estimated Sales Revenues
- Figure 13.7 Carteyva: Estimated Sales Revenues
- Figure 13.8 AUTO1: Estimated Sales Revenues
- Figure 13.9 AUTO3: Estimated Sales Revenues
- Figure 14.1 Kimmtrak: Estimated Sales Revenues
- Figure 14.2 GSK3377794: Estimated Sales Revenues
- Figure 14.3 ADP-A2M4: Estimated Sales Revenues
- Figure 14.4 TBI-1301: Estimated Sales Revenues
- Figure 15.1 LN-144: Estimated Sales Revenues
- Figure 15.2 LN-145: Estimated Sales Revenues
- Figure 15.3 ITIL-168: Estimated Sales Revenues
- Figure 15.4 LTX-315: Estimated Sales Revenues
- Figure 16.1 Genome Editing Technologies: Applications
- Figure 16.2 Genome Editing: Emerging Technology Platforms Used in T-Cell Therapies
- Figure 16.3 TALEN: Mechanism of Action
- Figure 16.4 MegaTAL: Mechanism of Action
- Figure 16.5 Zinc Finger Nuclease: Mechanism of Action
- Figure 16.6 Competitiveness Analysis: Gene Editing Platforms
- Figure 16.7 T-Cell Therapy: Key Technologies to Enhance Features / Characteristics
- Figure 16.8 Cellectis: Properties of Enhanced T-Cell Platform
- Figure 16.9 Cellectis: Allogeneic CAR-T Platform, Comparison with Autologous CAR-T Platform
- Figure 17.1 Partnerships and Collaborations: Cumulative Year-Wise Trend, Since 2015
- Figure 17.2 Partnerships and Collaborations: Distribution by Type of Partnership
- Figure 17.3 Partnerships and Collaborations: Distribution by Type of Partnership, Since 2015
- Figure 17.4 Partnerships and Collaborations: Distribution by Type of Product
- Figure 17.5 Partnerships and Collaborations: Distribution by Year of Partnership and Type of Product
- Figure 17.6 Partnerships and Collaborations: Distribution by Type of Partnership and Type of Product
- Figure 17.7 Partnerships and Collaborations: Distribution by Type of Partner
- Figure 17.8 Partnerships and Collaborations: Year-Wise Distribution by Type of Partner, Since 2015
- Figure 17.9 Partnerships and Collaborations: Distribution by Type of Product and Type of Partner
- Figure 17.10 Most Popular Products: Distribution by Number of Partnerships
- Figure 17.11 Most Active Industry Players: Distribution by Number of Partnerships
- Figure 17.12 Most Active Non-Industry Players: Distribution by Number of Partnerships
- Figure 17.13 Partnerships and Collaborations: Distribution of Intercontinental and Intracontinental Deals
- Figure 17.14 Partnerships and Collaborations: Distribution of International and Local Deals
- Figure 18.1 Funding and Investment Analysis: Cumulative Distribution of Instances by Year, Since 2018
- Figure 18.2 Funding and Investment Analysis: Cumulative Distribution of Amount Invested by Year, Since 2018 (USD Million)
- Figure 18.3 Funding and Investment Analysis: Distribution of Instances by Type of Funding
- Figure 18.4 Funding and Investment Analysis: Distribution of Total Amount Invested by Type of Funding (USD Million)
- Figure 18.5 Funding and Investments: Distribution of Amount Invested by Type of Therapy, Since 2018
- Figure 18.6 Funding and Investments: Distribution by Types of Investors
- Figure 18.7 Funding and Investments: Distribution of Amount Invested by Type of Investor (USD Million)
- Figure 18.8 Most Active Players: Distribution by Number of Instances
- Figure 18.9 Most Active Players: Distribution by Amount Invested
- Figure 18.10 Funding and Investment Analysis: Distribution of Amount Invested by Geography
- Figure 18.11 Most Active Investors: Distribution by Number of Amount Invested
- Figure 19.1 Patent Analysis: Distribution by Type of Patent
- Figure 19.2 CAR-T Therapies Patent Analysis: Cumulative Year-wise Trend by Patent Publication Year, Since 2017
- Figure 19.3 CAR-T Therapies Patent Analysis: Cumulative Year-wise Trend by Patent Application Year, Since 2017
- Figure 19.4 CAR-T Therapies Patent Analysis: Year-wise Distribution of Granted Patents and Patent Applications, Since 2017
- Figure 19.5 CAR-T Therapies Patent Analysis: Distribution by Patent Jurisdiction
- Figure 19.6 CAR-T Therapies Patent Analysis: Distribution by CPC Symbols
- Figure 19.7 CAR-T Therapies Patent Analysis: Cumulative Year-wise Distribution by Type of Applicant
- Figure 19.8 Leading Industry Players: Distribution by Number of Patents
- Figure 19.9 Leading Non-Industry Players: Distribution by Number of Patents
- Figure 19.10 Leading Individual Assignees: Distribution by Number of Patents
- Figure 19.11 Patent Benchmarking Analysis: Distribution of Patent Characteristics (CPC Codes) by Leading Industry Players
- Figure 19.12 Patent Benchmarking Analysis: Distribution of Leading Industry Players by Patent Characteristics (CPC Codes)
- Figure 19.13 CAR-T Therapies Patent Analysis: Distribution by Patent Age
- Figure 19.14 CAR-T Therapies: Patent Valuation
- Figure 19.15 TCR-based Therapies Patent Analysis: Cumulative Distribution by Patent Publication Year
- Figure 19.16 TCR-based Therapies Patent Analysis: Cumulative Distribution by Patent Application Year
- Figure 19.17 TCR-based Therapies Patent Analysis: Cumulative Distribution by Annual Granted Patents
- Figure 19.18 TCR-based Therapies Patent Analysis: Cumulative Distribution of Year-wise Filed Patent Applications
- Figure 19.19 TCR-based Therapies Patent Analysis: Distribution by Year-wise filed Patents Application and Granted Patents
- Figure 19.20 TCR-based Therapies Patent Analysis: Distribution by Geography
- Figure 19.21 TCR-based Therapies Patent Analysis: Distribution by Type of Player
- Figure 19.22 TCR-based Therapies Patent Analysis: Distribution by CPC Symbol
- Figure 19.23 TCR-based Therapies Patent Analysis: Key Focus Area
- Figure 19.24 Leading Industry Players: Distribution by Number of Patents
- Figure 19.25 Leading Non-Industry Players: Distribution by Number of Patents
- Figure 19.26 Leading Patent Assignees: Distribution by Number of Patents
- Figure 19.27 Patent Analysis (Top 10 CPC Symbols): Benchmarking by Leading Players
- Figure 19.28 TCR-based Therapies Patent Analysis: Distribution by Patent Age
- Figure 19.29 TCR-based Therapies: Patent Valuation Analysis
- Figure 19.30 TIL-based Therapies Patent Analysis: Cumulative Distribution by Patent Publication Year
- Figure 19.31 TIL-based Therapies Patent Analysis: Cumulative Distribution by Patent Application Year
- Figure 19.32 TIL-based Therapies Patent Analysis: Cumulative Distribution by Annual Granted Patents
- Figure 19.33 TIL-based Therapies Patent Analysis: Cumulative Distribution of Year-wise Filed Patent Applications
- Figure 19.34 TIL-based Therapies Patent Analysis: Distribution by Year-wise filed Patents Application and Granted Patents
- Figure 19.35 TIL-based Therapies Patent Analysis: Distribution by Geography
- Figure 19.36 TIL-based Therapies Patent Analysis: Distribution by Type of Player
- Figure 19.37 TIL-based Therapies Patent Analysis: Distribution by CPC Symbols
- Figure 19.38 TIL-based Therapies Patent Analysis: Key Focus Area
- Figure 19.39 Leading Industry Players: Distribution by Number of Patents
- Figure 19.40 Leading Non-Industry Players: Distribution by Number of Patents
- Figure 19.41 Leading Patent Assignees: Distribution by Number of Patents
- Figure 19.42 Patent Analysis (Top 10 CPC Symbols): Benchmarking by Leading
- Figure 19.43 TIL-based Therapies Patent Analysis: Distribution by Patent Age
- Figure 19.44 TIL-based Therapies: Patent Valuation Analysis
- Figure 20.1 Mechanism of Action of Gamma Delta T-Cells
- Figure 20.2 Mechanism of Action of PD-1 Knockout Engineered T-Cell Therapies
- Figure 20.3 Functions of Treg Cells
- Figure 20.4 Other T-Cell Immunotherapies: Distribution by Type of T-Cell
- Figure 20.5 Other T-Cell Immunotherapies: Distribution by Stage of Development
- Figure 20.6 Other T-Cell Immunotherapies: Distribution by Therapeutic Area
- Figure 20.7 Other T-Cell Immunotherapies: Distribution by Source of T-Cells
- Figure 21.1 Steps for Manufacturing Cell Therapies
- Figure 21.2 Centralized Manufacturing: Process Model
- Figure 21.3 Decentralized Manufacturing: Process Model
- Figure 21.4 Cell Therapy Manufacturing: Types of Manufacturers
- Figure 21.5 Cell Therapy: Challenges and Drivers
- Figure 21.6 Cell Therapies: Potency as Critical Quality Attribute
- Figure 21.7 Cell Therapy Manufacturing: Supply Chain Model
- Figure 21.8 Cell Therapy Manufacturing: Supply Chain Risk Assessment Considerations
- Figure 22.1 Approved T-Cell Therapies: Pricing Model based on Patient Segment
- Figure 23.1 Global T-Cell Therapies Market, Historical Trends (since 2018) and Forecasted Estimates (till 2035) (USD Billion)
- Figure 23.2 Global T-Cell Therapies Market, Forecasted Estimates (till 2035): Conservative Scenario (USD Billion)
- Figure 23.3 Global T-Cell Therapies Market, Forecasted Estimates (till 2035): Optimistic Scenario (USD Billion)
- Figure 24.1 T-Cell Therapies Market: Distribution by Type of Therapy (USD Billion)
- Figure 24.2 T-Cell Therapies Market for CAR-T: Historical Trends (since 2018) and Forecasted Estimates (till 2035) (USD Billion)
- Figure 24.3 T-Cell Therapies Market for TCR: Historical Trends (since 2022) and Forecasted Estimates (till 2035) (USD Billion)
- Figure 24.4 T-Cell Therapies Market for TIL: Forecasted Estimates (till 2035) (USD Billion)
- Figure 25.1 CAR-T Therapies Market: Distribution by Target Indication
- Figure 25.2 CAR-T Therapies Market for Multiple Myeloma: Forecasted Estimates (till 2035) (USD Million)
- Figure 25.3 CAR-T Therapies Market for Large B-Cell Lymphoma: Forecasted Estimates (till 2035) (USD Million)
- Figure 25.4 CAR-T Therapies Market for Acute Lymphoblastic Leukemia: Forecasted Estimates (till 2035) (USD Million)
- Figure 25.5 CAR-T Therapies Market for Diffuse Large B-Cell Lymphoma: Forecasted Estimates (till 2035) (USD Million)
- Figure 25.6 CAR-T Therapies Market for Diffuse Large B-Cell Lymphoma, Primary Mediastinal Large B-Cell Lymphoma, Transformed Follicular Lymphoma and High grade B-cell lymphoma: Forecasted Estimates (till 2035) (USD Million)
- Figure 25.7 CAR-T Therapies Market for Acute Lymphoblastic Leukemia / B-cell Non-Hodgkin Lymphoma: Forecasted Estimates (till 2035) (USD Million)
- Figure 25.8 CAR-T Therapies Market for Non-Hodgkin Lymphoma: Forecasted Estimates (till 2035) (USD Million)
- Figure 25.9 CAR-T Therapies Market for Mantle Cell Lymphoma: Forecasted Estimates (till 2035) (USD Million)
- Figure 25.10 CAR-T Therapies Market for Acute Myeloid Leukemia: Forecasted Estimates (till 2035) (USD Million)
- Figure 25.11 CAR-T Therapies Market for Generalized Myasthenia Gravis: Forecasted Estimates (till 2035) (USD Million)
- Figure 25.12 CAR-T Therapies Market for Renal Transplantation (HLA-A2): Forecasted Estimates (till 2035) (USD Million)
- Figure 25.13 CAR-T Therapies Market for Gastric Adenocarcinoma: Forecasted Estimates (till 2035) (USD Million)
- Figure 25.14 CAR-T Therapies Market for Ovarian / Endometrial Cancer: Forecasted Estimates (till 2035) (USD Million)
- Figure 25.15 CAR-T Therapies Market for Chronic Lymphocytic Leukemia: Forecasted Estimates (till 2035) (USD Million)
- Figure 25.16 CAR-T Therapies Market for Follicular Lymphoma: Forecasted Estimates (till 2035) (USD Million)
- Figure 25.17 CAR-T Therapies Market for Renal Cell Carcinoma: Forecasted Estimates (till 2035) (USD Million)
- Figure 25.18 TCR Therapies Market: Distribution by Target Indication
- Figure 25.19 TCR Therapies Market for Melanoma: Forecasted Estimates (till 2035) (USD Million)
- Figure 25.20 TCR Therapies Market for Sarcoma: Forecasted Estimates (till 2035) (USD Million)
- Figure 25.21 TCR Therapies Market for Head and Neck Cancer: Forecasted Estimates (till 2035) (USD Million)
- Figure 25.22 TCR Therapies Market for Hepatocellular Carcinoma: Forecasted Estimates (till 2035) (USD Million)
- Figure 25.23 TCR Therapies Market for Nasopharyngeal Carcinoma: Forecasted Estimates (till 2035) (USD Million)
- Figure 25.24 TCR Therapies Market for Ovarian Cancer: Forecasted Estimates (till 2035) (USD Million)
- Figure 25.25 TCR Therapies Market for Acute Myeloid Leukemia: Forecasted Estimates (till 2035) (USD Million)
- Figure 25.26 TIL Therapies Market: Distribution by Target Indication
- Figure 25.28 TIL Therapies Market for Melanoma: Forecasted Estimates (till 2035) (USD Million)
- Figure 25.29 TIL Therapies Market for Basal Cell Carcinoma: Forecasted Estimates (till 2035) (USD Million)
- Figure 25.30 TIL Therapies Market for Lung Cancer: Forecasted Estimates (till 2035) (USD Million)
- Figure 25.31 TIL Therapies Market for Sarcoma: Forecasted Estimates (till 2035) (USD Million)
- Figure 25.32 TIL Therapies Market for Head and Neck Cancer: Forecasted Estimates (till 2035) (USD Million)
- Figure 25.33 TIL Therapies Market for Cervical Cancer: Forecasted Estimates (till 2035) (USD Million)
- Figure 25.34 TIL Therapies Market for Neuro Gastro-Intestinal (GI) Cancer: Forecasted Estimates (till 20355) (USD Million)
- Figure 25.35 TIL Therapies Market for Breast Cancer: Forecasted Estimates (till 2035) (USD Million)
- Figure 26.1 CAR-T Therapies Market: Distribution by Target Antigen
- Figure 26.2 CAR-T Therapies Market for BCMA: Forecasted Estimates (till 2035) (USD Million)
- Figure 26.3 CAR-T Therapies Market for CD19: Forecasted Estimates (till 2035) (USD Million)
- Figure 26.4 CAR-T Therapies Market for CD20: Forecasted Estimates (till 2035) (USD Million)
- Figure 26.5 CAR-T Therapies Market for CD19 / CD22: Forecasted Estimates (till 2035) (USD Million)
- Figure 26.6 CAR-T Therapies Market for Other Antigens: Forecasted Estimates (till 2035) (USD Million)
- Figure 26.7 TCR Therapies Market: Distribution by Target Antigen
- Figure 26.8 TCR Therapies Market for HLA: Forecasted Estimates (till 2035) (USD Million)
- Figure 26.9 TCR Therapies Market for MAGE: Forecasted Estimates (till 2035) (USD Million)
- Figure 26.10 TCR Therapies Market for PRAME: Forecasted Estimates (till 2035) (USD Million)
- Figure 26.11 TCR Therapies Market for NY-ESO-1 and LAGE: Forecasted Estimates (till 2035) (USD Million)
- Figure 26.12 TCR Therapies Market for EBV: Forecasted Estimates (till 2035) (USD Million)
- Figure 26.13 TCR Therapies Market for HBV: Forecasted Estimates (till 2035) (USD Million)
- Figure 27.1 TCR Therapies Market: Distribution by Company Size
- Figure 27.2 TCR Therapies Market for Mid-Sized Companies: Forecasted Estimates (till 2035) (USD Million)
- Figure 27.3 TCR Therapies Market for Large Companies: Forecasted Estimates (till 2035) (USD Million)
- Figure 27.4 TIL Therapies Market: Distribution by Company Size
- Figure 27.5 TIL Therapies Market for Small Companies: Forecasted Estimates (till 2035) (USD Million)
- Figure 27.6 TIL Therapies Market for Large Companies: Forecasted Estimates (till 2035) (USD Million)
- Figure 28.1 CAR-T Therapies Market: Distribution by Geographical Regions
- Figure 28.2 CAR-T Therapies Market in North America: Forecasted Estimates (till 2035) (USD Million)
- Figure 28.3 CAR-T Therapies Market in Europe: Forecasted Estimates (till 2035) (USD Million)
- Figure 28.4 CAR-T Therapies Market in Asia-Pacific: Forecasted Estimates (till 2035) (USD Million)
- Figure 28.5 CAR-T Therapies Market in Latin America: Forecasted Estimates (till 2035) (USD Million)
- Figure 28.6 CAR-T Therapies Market in Middle East and North Africa: Forecasted Estimates (till 2035) (USD Million)
- Figure 28.7 CAR-T therapies Market in Rest of the World: Forecasted Estimates (till 2035) (USD Million)
- Figure 28.8 Penetration Growth (P-G) Matrix: Geographical Regions
- Figure 28.9 Market Movement Analysis: Geographical Regions
- Figure 28.10 TCR Therapies Market: Distribution by Geographical Regions
- Figure 28.11 TCR Therapies Market in North America: Forecasted Estimates (till 2035) (USD Million)
- Figure 28.12 TCR Therapies Market in Europe: Forecasted Estimates (till 2035) (USD Million)
- Figure 28.13 TCR Therapies Market in Asia-Pacific: Forecasted Estimates (till 2035) (USD Million)
- Figure 28.14 TCR therapies Market in Rest of the World: Forecasted Estimates (till 2035) (USD Million)
- Figure 28.15 Penetration Growth (P-G) Matrix: Geographical Regions
- Figure 28.16 Market Movement Analysis: Geographical Regions
- Figure 28.17 TIL Therapies Market: Distribution by Geographical Regions
- Figure 28.18 TIL Therapies Market in North America: Forecasted Estimates (till 2035) (USD Million)
- Figure 28.19 TIL Therapies Market in Europe: Forecasted Estimates (till 2035) (USD Million)
- Figure 28.20 TIL therapies Market in Rest of the World: Forecasted Estimates (till 2035) (USD Million)
- Figure 28.21 Penetration Growth (P-G) Matrix: Geographical Regions
- Figure 28.22 Market Movement Analysis: Geographical Regions
- Figure 29.1 CAR-T Therapies Market: Distribution by Sales Forecast of Leading Players
- Figure 29.2 CAR-T Therapies Market: Gilead Sciences Sales Forecast, till 2035 (USD Million)
- Figure 29.3 CAR-T Therapies Market: Bristol Myers Squibb Sales Forecast, till 2035 (USD Million)
- Figure 29.4 CAR-T Therapies Market: Novartis Sales Forecast, till 2035 (USD Million)
- Figure 29.5 CAR-T Therapies Market: Janssen Sales Forecast, till 2035 (USD Million)
- Figure 29.6 CAR-T Therapies Market: JW Therapeutics Sales Forecast, till 2035 (USD Million)
- Figure 29.7 TCR Therapies Market: Distribution by Sales Forecast of Leading Players
- Figure 29.8 TCR Cell Therapies Market: Immunocore Sales Forecast, till 2035 (USD Million)
- Figure 29.9 TCR Therapies Market: Adaptimmune Therapeutics Sales Forecast, till 2035 (USD Million)
- Figure 29.10 TCR Therapies Market: TCRCure Biopharma Sales Forecast, till 2035 (USD Million)
- Figure 29.11 TCR Therapies Market: Lion TCR Sales Forecast, till 2035 (USD Million)
- Figure 29.12 TCR Therapies Market: Miltenyi Biomedicine Sales Forecast, till 2035 (USD Million)
- Figure 29.13 TIL Therapies Market: Distribution by Sales Forecast of Leading Players
- Figure 29.14 TIL Therapies Market: Iovance Biotherapeutics Sales Forecast, till 2035 (USD Million)
- Figure 29.15 TIL Therapies Market: Lytix Biopharma Sales Forecast, till 2035 (USD Million)
- Figure 29.16 TIL Therapies Market: Bristol-Myers Squibb Sales Forecast, till 2035 (USD Million)
- Figure 29.17 TIL Therapies Market: Intima Bioscience Sales Forecast, till 2035 (USD Million)
- Figure 30.1 CAR-T Therapies Market: Kymriah (Tisagenlecleucel-T) Sales Forecast, till 2035 (USD Million)
- Figure 30.2 CAR-T Therapies Market: Yescarta (axicabtagene ciloleucel) Sales Forecast, till 2035 (USD Million)
- Figure 30.3 CAR-T Therapies Market: Tecartus (Brexucabtagene Autoleucel) Sales Forecast, till 2035 (USD Million)
- Figure 30.4 CAR-T Therapies Market: Abecma (Idecabtagene Vicleucel / bb2121) Sales Forecast, till 2035 (USD Million)
- Figure 30.5 CAR-T Therapies Market: CARVYKTI (LCAR-B38M CAR-T / JNJ-68284528 / Ciltacabtagene Autoleucel) Sales Forecast, till 2035 (USD Million)
- Figure 30.6 CAR-T Therapies Market: BREYANZI (Lisocabtagene maraleucel, JCAR017) Sales Forecast, till 2035 (USD Million)
- Figure 30.7 CAR-T Therapies Market: Carteyva (Relmacabtagene autoleucel / JWCAR029) Sales Forecast, till 2035 (USD Million)
- Figure 30.8 CAR-T Therapies Market: NexCART Sales Forecast, till 2035 (USD Million)
- Figure 30.9 CAR-T Therapies Market: Fucaso (Equecabtagene Autoleucel) Sales Forecast, till 2035 (USD Million)
- Figure 30.10 CAR-T Therapies Market: Inaticabtagene Autoleucel CNCT19 / HY001 Sales Forecast, till 2035 (USD Million)
- Figure 30.11 CAR-T Therapies Market: Zevorcabtagene autoleucel (CT053) Sales Forecast, till 2035 (USD Million)
- Figure 30.12 CAR-T Therapies Market: CAR-BCMA T cells Sales Forecast, till 2035 (USD Million)
- Figure 30.13 CAR-T Therapies Market: CAR-T-CD19 Cells Sales Forecast, till 2035 (USD Million)
- Figure 30.14 CAR-T Therapies Market: Descartes-08 Sales Forecast, 2029-2035 (USD Million)
- Figure 30.15 CAR-T Therapies Market: Zamtocabtagene Autoleucel (MB-CART2019.1) Sales Forecast, till 2035 (USD Million)
- Figure 30.16 CAR-T Therapies Market: CAR-T ddBCMA Sales Forecast, till 2035 (USD Million)
- Figure 30.17 CAR-T Therapies Market: CRG-022 cells Sales Forecast, till 2035 (USD Million)
- Figure 30.18 CAR-T Therapies Market: CT041 Sales Forecast, till 2035 (USD Million)
- Figure 30.19 CAR-T Therapies Market: ALLO-501A / ALLO-501 Sales Forecast, till 2035 (USD Million)
- Figure 30.20 CAR-T Therapies Market: ALLO-605 Sales Forecast, till 2035 (USD Million)
- Figure 31.20 Product Website Analysis: Carvykti, Messages for Patients
- Figure 31.21 Product Website Analysis: Carvykti, MyCARVYKTI
- Figure 31.22 Product Website Analysis: Kimmtrak, Messages for Healthcare Professional
- Figure 31.23 Product Website Analysis: Kimmtrak, Messages for Patients
- Figure 31.24 Product Website Analysis: Kimmtrak, Kimmtrak Connect
- Figure 33.1 Concluding Remarks: CAR-T Therapies Market Landscape
- Figure 33.2 Concluding Remarks: TCR Therapies Market Landscape
- Figure 33.3 Concluding Remarks: TIL Therapies Market Landscape
- Figure 33.4 Concluding Remarks: Clinical Trial Analysis
- Figure 33.5 Concluding Remarks: Partnerships and Collaborations
- Figure 33.6 Concluding Remarks: Funding and Investments Analysis
- Figure 33.7 Concluding Remarks: Patent Analysis
- Figure 33.8 Concluding Remarks: Market Forecast and Opportunity Analysis

