
PUBLISHER: Roots Analysis | PRODUCT CODE: 1616880

PUBLISHER: Roots Analysis | PRODUCT CODE: 1616880
Cell and Gene Therapy CRO Market by Type of Cell Therapy, Type of Genetic Modification, Stage of Development, Therapeutic Area, End-Users and Key Geographical Regions : Industry Trends and Global Forecasts, Till 2035
CELL AND GENE THERAPY CRO MARKET: OVERVIEW
As per Roots Analysis, the global cell and gene therapy CRO market is estimated to grow from USD 1.7 billion in the current year to USD 3.5 billion by 2035, at a CAGR of 7.1% during the forecast period, till 2035.
The market sizing and opportunity analysis has been segmented across the following parameters:
Type of Cell Therapy
- CAR-NK
- CAR-T
- TCR-T
- Others
Type of Genetic Modification
- Ex vivo
- In vivo
Stage of Development
- Discovery
- Preclinical
- Clinical
Therapeutic Area
- Blood Disorders
- Cardiovascular Disorders
- Dermatological Disorders
- Immunological Disorders
- Infectious Diseases
- Metabolic Disorders
- Musculoskeletal Disorders
- Neurological Disorders
- Oncological Disorders
- Rare Diseases
- Other Disorders
End Users
- Industry Players
- Non- Industry Players
Key Geographical Regions
- North America
- Europe
- Asia-Pacific
- Rest of the World
CELL AND GENE THERAPY CRO MARKET: GROWTH AND TRENDS
The ongoing advancements in cell and gene therapies domain, along with several FDA-approved therapies, demonstrate the potential of these innovative therapies in treating a wide range of diseases (including rare and complex diseases) for which no effective treatment is currently available. As a result, this promising therapeutic modality has garnered the interest of both investors and drug developers alike. It is worth highlighting that, at present, over 90 cell and gene therapies have been approved globally. Notable examples of recently approved therapies include Elvediys (for the treatment of duchenne muscular dystrophy) developed by Sarepta Therapeutics, Fucaso (for the treatment of multiple myeloma) developed by IASO Bio and Vyjuvek (for the treatment of dystrophic epidermolysis bullosa) developed by Krystal Biotech. In addition, more than 3,500 clinical trials are currently underway to investigate cell and gene therapies across 16 therapeutic areas. This demonstrates the extensive development efforts being undertaken by stakeholders in this domain. As the cell and gene therapy field rapidly evolves, CROs offer valuable expertise in optimizing study designs, managing complex regulatory frameworks and seamless transition from preclinical to clinical success. At present, over 105 industry players claim to have the necessary capabilities to offer contract research services across different scales of operations.
CELL AND GENE THERAPY CRO MARKET: KEY INSIGHTS
The report delves into the current state of the cell and gene therapy CRO market and identifies potential growth opportunities within the industry. Some key findings from the report include:
1. Presently, over 105 players (established as well as start ups) claim to have the necessary capabilities to offer contract research services; majority of these firms are based in North America.
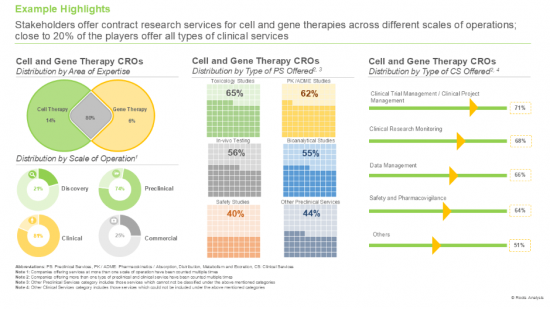
2. Stakeholders offer contract research services for cell and gene therapies across different scales of operations; close to 20% of the players offer all types of clinical services.
3. More than 65 deals have been inked between various stakeholders involved in this domain; acquisitions emerged as the most common type of partnership model.
4. The rising interest of players is reflected by the number of mergers and acquisitions reported in the last few years; 58% of such initiatives were signed to incorporate additional capabilities to their existing portfolio offerings.
5. Since 2019, more than 3,000 clinical trials have been registered for cell therapies; over 70% of the trials recently initiated are currently recruiting patients.
6. Close to 500 clinical trials (with over 48,000 enrolled patients) have been registered to investigate gene therapies, across different geographies.
7. In order to meet the rising demand for cell and gene therapies, stakeholders are striving to upgrade / expand their capabilities to enhance their respective service portfolios.
8. Total cost of ownership model offers an informed estimate of capital and operational expenses associated with the establishment and maintenance of a contract research facility, over a span of 20 years.
9. Driven by the increasing number of chronic indications (requiring novel personalized therapies), and ongoing research on cell and gene therapies, this market is anticipated to grow at a CAGR of 7.1%, till 2035.
10. About 25% of the market is expected to be captured by revenues generated from cell and gene therapies for oncological disorders; it is also worth highlighting that the CRO market in China is likely to grow at a faster pace.
CELL AND GENE THERAPY CRO MARKET: KEY SEGMENTS
Currently, the CAR-T Cell Therapy Market Segment Occupies the Largest Share of the Cell and Gene Therapy CRO Market
Based on the type of cell therapy, the market is segmented into CAR-NK, CAR-T, TCR-T, and others. It is worth highlighting that the CAR-T cell therapies segment is likely to dominate the market in the coming decade. This can be attributed to the proven efficacy of CAR-T cell therapies in treating CD19-positive haematological malignancies, acute lymphoblastic leukemia and multiple myeloma.
Ex Vivo Segment Holds the Maximum Share within the Cell and Gene Therapy CRO Market
Based on the type of genetic modification, the market is segmented into ex vivo and in vivo. It is worth highlighting that majority of the current cell and gene therapy CRO market is captured by the ex vivo segment and this trend is likely to remain the same in the forthcoming years. This can be attributed to the fact that ex vivo techniques utilize viral vectors, which are effective in delivering and integrating modified genetic material into cells.
Currently, the Clinical Segment Occupies the Largest Share of the Cell and Gene Therapy CRO Market
Based on the stage of development, the market is segmented into discovery, preclinical and clinical. It is worth highlighting that majority of the current cell and gene therapy CRO market is captured by the clinical segment and this trend is likely to remain the same in the forthcoming years. This can be primarily attributed to the rigorous clinical testing that these therapies undergo in order to meet the regulatory standards before commercialization.
Oncological Disorders Segment is Likely to Dominate the Cell and Gene Therapy CRO Market During the Forecast Period
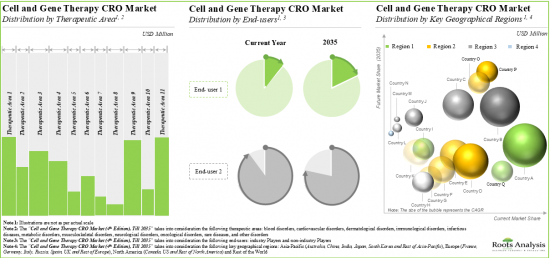
Based on therapeutic areas, the market is segmented into blood disorders, cardiovascular disorders, dermatological disorders, immunological disorders, infectious diseases, metabolic disorders, musculoskeletal disorders, neurological disorders, oncological disorders, rare diseases, and other disorders. It is worth highlighting that majority of the current cell and gene therapy CRO market is captured by the oncological disorders segment and this trend is likely to remain the same in the forthcoming years.
Industry Players are Likely to Dominate the Cell and Gene Therapy CRO Market During the Forecast Period
Based on end user, the market is segmented into industry and non-industry players. It is worth highlighting that majority of the current cell and gene therapy CRO market is captured by the industry players and this trend is likely to remain the same in the forthcoming years.
North America Accounts for the Largest Share of the Market
Based on key geographical regions, the market is segmented into North America, Europe, Asia-Pacific and Rest of the World. Majority share is expected to be captured by CROs based in North America. It is worth highlighting that, over the years, the market for Asia-Pacific is expected to grow at a higher CAGR.
Example Players in the Cell and Gene Therapy CRO Market
- Altasciences
- Allucent
- CMIC
- Labcorp
- Linical
- Medpace
- PPD
- Precision for Medicine
- QPS
- Syneos Health
- CMED
- ICON
- Pharmalex
- Novotech
Primary Research Overview
The opinions and insights presented in this study were influenced by discussions conducted with multiple stakeholders. The research report features detailed transcripts of interviews held with the following industry stakeholders:
- Business Development Executive, Aixial
- Clinical Trial Manager, Gsap
- Former Director, Marketing and Sales, CATO SMS
CELL AND GENE THERAPY CRO MARKET: RESEARCH COVERAGE
- Market Sizing and Opportunity Analysis: The report features an in-depth analysis of the cell and gene therapy CRO market, focusing on key market segments, including [A] type of cell therapy, [B] type of genetic modification, [C] stage of development, [D] therapeutic area, [E] end users and [F] key geographical regions.
- Market Landscape: A comprehensive evaluation of contract research service providers engaged in cell and gene therapy market, considering various parameters, such as [A] year of establishment, [B] company size (in terms of number of employees), [C] location of headquarters, [D] area of expertise (cell therapy and gene therapy), [E] scale of operation (discovery, preclinical, clinical and commercial), [F] type of preclinical services offered (toxicology studies, in-vivo testing, safety studies, PK / ADME studies, bioanalytical studies, and other preclinical services), [G] type of clinical services offered (clinical trial management / clinical project management, clinical research monitoring, data management, safety and pharmacovigilance, and other clinical services), [H] type of regulatory services offered (legal representation, GAP analysis, Technical Dossier Submission, and IND Preparation) and [I] type of general support services offered (consulting, training, biostatistics, post-market assessment, and re-imbursement).
- Company Profiles: In-depth profiles of key cell and gene therapy contract research service providers based in North America, Europe and Asia-Pacific, focusing on [A] company overviews, [B] service portfolio, [C] insightful recent developments and [D] an informed future outlook.
- Benchmark Analysis: A detailed benchmark analysis of the various players involved in this domain. It highlights the capabilities of the companies (in terms of their expertise across various services related to the development of cell and gene therapies). The analysis allows companies to compare their existing capabilities within and beyond their peer groups and identify opportunities to become more competitive in the industry.
- Total Cost of Ownership: A thorough examination of the total cost of ownership for large and very large contract research organizations (CROs) specializing in cell and gene therapy, highlighting the costs associated in both the establishment and ongoing maintenance of a CRO facility over the short and long term. This chapter includes insights derived from an in-depth analysis of the total cost of ownership for cell and gene therapy CROs during the period from Y0-Y20.
- Partnerships and Collaborations: An analysis of partnerships established in this sector, since 2015, based on several parameters, [A] year of partnership, [B] type of partnership, [C] area of expertise, [D] most active players (in terms of number of partnerships inked) and [E] regional distribution of partnership activity.
- Merger and Acquisitions: A comprehensive examination of the various mergers and acquisitions, focusing on multiple relevant parameters, including [A] year of agreement, [B] type of agreement, [C] key value drivers of the deal, [D] most active players (in terms of number of agreements signed) and [E] geographical location of companies. Furthermore, this chapter provides details on the financial aspects of these deals (where available) to calculate deal multiples based on the annual revenues of the acquired companies at the time of acquisition and their years of experience in the industry.
- Key Acquisition Targets: A detailed analysis of acquisitions that have taken place in the cell and gene therapy domain, taking into consideration the historical trend of the activity of players that have acquired other firms since 2015, and offering a means for other industry stakeholders to identify potential acquisition targets. The primary purpose of this analysis was to develop a better understanding of the overall potential and capabilities of companies involved in this domain, that are likely to be acquired in the recent future.
- Clinical Trial Analysis: Examination of completed, ongoing, and planned clinical studies of various cell and gene therapies, based on several parameters, such as [A] trial registration year, [B] trial status, [C] trial phase, [D ]enrolled patient population, [E] type of sponsor, [F] most active industry players (in terms of number of registered trials), [G] study design, [H] therapeutic area and [I] key geographical regions.
- Business Model Analysis: A detailed discussion of the business models that are commonly adopted by the biopharmaceutical industry for outsourcing cell and gene therapies. In addition, it includes information on various factors that drive sponsors towards outsourcing and key parameters that sponsors must consider while choosing CROs at each phase of drug development process.
- SWOT Analysis: A SWOT analysis of cell and gene therapy CRO services focuses on identifying industry-specific trends, key market drivers and challenges faced by companies providing these services.
KEY QUESTIONS ANSWERED IN THIS REPORT
- How many companies are currently engaged in this market?
- Which are the leading CROs in this market?
- What kind of partnership models are commonly adopted by industry stakeholders?
- What factors are likely to influence the evolution of this market?
- What is the current and future market size?
- What is the CAGR of this market?
- How is the current and future market opportunity likely to be distributed across key market segments?
REASONS TO BUY THIS REPORT
- The report provides a comprehensive market analysis, offering detailed revenue projections of the overall market and its specific sub-segments. This information is valuable to both established market leaders and emerging entrants.
- Stakeholders can leverage the report to gain a deeper understanding of the competitive dynamics within the market. By analyzing the competitive landscape, businesses can make informed decisions to optimize their market positioning and develop effective go-to-market strategies.
- The report offers stakeholders a comprehensive overview of the market, including key drivers, barriers, opportunities, and challenges. This information empowers stakeholders to stay abreast of market trends and make data-driven decisions to capitalize on growth prospects.
ADDITIONAL BENEFITS
- Complimentary PPT Insights Packs
- Complimentary Excel Data Packs for all Analytical Modules in the Report
- 10% Free Content Customization
- Detailed Report Walkthrough Session with Research Team
- Free Updated report if the report is 6-12 months old or older
TABLE OF CONTENTS
1. PREFACE
- 1.1. Introduction
- 1.2. Market Share Insights
- 1.3. Key Market Insights
- 1.4. Report Coverage
- 1.5. Key Questions Answered
- 1.6. Chapter Outlines
2. RESEARCH METHODOLOGY
- 2.1. Chapter Overview
- 2.2. Research Assumptions
- 2.3. Project Methodology
- 2.4. Forecast Methodology
- 2.5. Robust Quality Control
- 2.6. Key Market Segmentations
- 2.7. Key Considerations
- 2.7.1. Demographics
- 2.7.2. Economic Factors
- 2.7.3. Government Regulations
- 2.7.4. Supply Chain
- 2.7.5. COVID Impact
- 2.7.6. Market Access
- 2.7.7. Healthcare Policies
- 2.7.8. Industry Consolidation
3. ECONOMIC AND OTHER PROJECT SPECIFIC CONSIDERATIONS
- 3.1. Chapter Overview
- 3.2. Market Dynamics
- 3.2.1. Time Period
- 3.2.1.1. Historical Trends
- 3.2.1.2. Current and Future Estimates
- 3.2.2. Currency Coverage and Foreign Exchange Rates
- 3.2.2.1. Major Currencies Affecting the Market
- 3.2.2.2. Factors Affecting Currency Fluctuations and Foreign Exchange Rates
- 3.2.2.3. Impact of Foreign Exchange Rate Volatility on the Market
- 3.2.2.4. Strategies for Mitigating Foreign Exchange Risk
- 3.2.1. Time Period
3.2.3. Trade Policies
- 3.2.3.1. Impact of Trade Barriers on the Market
- 3.2.3.2. Strategies for Mitigating the Risks Associated with Trade Barriers
- 3.2.4. Recession
- 3.2.4.1. Historical Analysis of Past Recessions and Lessons Learnt
- 3.2.4.2. Assessment of Current Economic Conditions and Potential Impact on the Market
- 3.2.5. Inflation
- 3.2.5.1. Measurement and Analysis of Inflationary Pressures in the Economy
- 3.2.5.2. Potential Impact of Inflation on the Market Evolution
4. EXECUTIVE SUMMARY
5. INTRODUCTION
- 5.1. Chapter Overview
- 5.2. Overview of Contract Research Organizations (CROs)
- 5.3. Classification of CROs
- 5.4. Evolution of CROs
- 5.5. Modern CROs and Prevalent Outsourcing Trends
- 5.6. Type of Services Offered by CROs
- 5.7. Role of CROs in Development of Advanced Therapy Medicinal Products (ATMPs)
- 5.8. Advantages of Outsourcing Operations to CROs
- 5.9. Risks Associated with Outsourcing to CROs
- 5.10. Future Perspectives
6. GUIDE TO OUTSOURCING
- 6.1. Chapter Overview
- 6.2. Cell and Gene Therapy Research: Need for Outsourcing
- 6.3. Outsourcing Models
- 6.3.1. Transactional Outsourcing Model
- 6.3.2. Performance-based Business Model
- 6.3.3. Outcome-based Business Model
- 6.3.4. Staff Augmentation Model
- 6.3.5. Phase-Dependent Outsourcing Model
- 6.4. Selecting an Appropriate Outsourcing Model
- 6.5. Selecting a CRO Partner
- 6.6. Role of CROs in Drug Development
- 6.6.1. Discovery and Preclinical Research
- 6.6.2. Early Clinical Research
- 6.6.3. Clinical Research and Laboratory Services
- 6.6.4. Key Considerations for Outsourcing Cell and Gene Therapy Operations
- 6.7. Concluding Remarks
7. MARKET LANDSCAPE
- 7.1. Chapter Overview
- 7.2. Cell and Gene Therapy CROs: Overall Market Landscape
- 7.2.1. Analysis by Year of Establishment
- 7.2.2. Analysis by Company Size
- 7.2.3. Analysis by Location of Headquarters
- 7.2.4. Analysis by Area of Expertise
- 7.2.5. Analysis by Type of Cell Therapy
- 7.2.6. Analysis by Scale of Operation
- 7.2.7. Analysis by Type of Preclinical Services Offered
- 7.2.8. Analysis by Type of Clinical Services Offered
- 7.2.9. Analysis by Type of Regulatory Services Offered
- 7.2.10. Analysis by Type of General Support Services Offered
8. COMPANY PROFILES
- 8.1. Chapter Overview
- 8.2. Aixial
- 8.2.1. Company Overview
- 8.2.2. Service Portfolio
- 8.2.3. Recent Developments and Future Outlook
- 8.3. Altasciences
- 8.3.1. Company Overview
- 8.3.2. Service Portfolio
- 8.3.3. Recent Developments and Future Outlook
- 8.4. CMIC
- 8.4.1. Company Overview
- 8.4.2. Financial Information
- 8.4.3. Service Portfolio
- 8.4.4. Recent Developments and Future Outlook
- 8.5. ICON
- 8.5.1. Company Overview
- 8.5.2. Service Portfolio
- 8.5.3. Recent Developments and Future Outlook
- 8.6. Labcorp
- 8.6.1. Company Overview
- 8.6.2. Financial Information
- 8.6.3. Service Portfolio
- 8.6.4. Recent Developments and Future Outlook
- 8.7. Linical
- 8.7.1. Company Overview
- 8.7.2. Financial Information
- 8.7.3. Service Portfolio
- 8.7.4. Recent Developments and Future Outlook
- 8.8. Medpace
- 8.8.1. Company Overview
- 8.8.2. Financial Information
- 8.8.3. Service Portfolio
- 8.8.4. Recent Developments and Future Outlook
- 8.9. Novotech
- 8.9.1. Company Overview
- 8.9.2. Service Portfolio
- 8.9.3. Recent Developments and Future Outlook
- 8.10. PPD
- 8.10.1. Company Overview
- 8.10.2. Service Portfolio
- 8.10.3. Recent Developments and Future Outlook
- 8.11. Precision for Medicine
- 8.11.1. Company Overview
- 8.11.2. Service Portfolio
- 8.11.3. Recent Developments and Future Outlook
- 8.12. QPS
- 8.12.1. Company Overview
- 8.12.2. Service Portfolio
- 8.12.3. Recent Developments and Future Outlook
- 8.13. Syneos Health
- 8.13.1. Company Overview
- 8.13.2. Financial Information
- 8.13.3. Service Portfolio
- 8.13.4. Recent Developments and Future Outlook
9. BENCHMARKING ANALYSIS
- 9.1. Chapter Overview
- 9.2. Key Assumptions and Methodology
- 9.3. Cell and Gene Therapy CROs: Benchmark Analysis
- 9.3.1. Benchmarking Analysis of Small Players based in North America (Peer Group I)
- 9.3.2. Benchmarking Analysis of Mid-sized Players based in North America (Peer Group II)
- 9.3.3. Benchmarking Analysis of Large and Very Large Players based in North America (Peer Group III)
- 9.3.4. Benchmarking Analysis of Small Players based in Europe (Peer Group IV)
- 9.3.5. Benchmarking Analysis of Mid-sized Players based in Europe (Peer Group V)
- 9.3.6. Benchmarking Analysis of Large and Very Large Players based in Europe (Peer Group VI)
- 9.3.7. Benchmarking Analysis of Small, Mid-sized, Large and Very Large Players based in Asia-Pacific (Peer Group VII)
- 9.3.8. Benchmarking Analysis of Small and Mid-sized Players based in Rest of the World (Peer Group VIII)
- 9.4. Concluding Remarks
10. PARTNERSHIPS AND COLLABORATIONS
- 10.1. Chapter Overview
- 10.2. Partnership Models
- 10.3. Cell and Gene Therapy Contract Research Organizations: Partnerships and Collaborations
- 10.3.1. Analysis by Year of Partnership
- 10.3.2. Analysis by Type of Partnership
- 10.3.3. Analysis by Year and Type of Partnership
- 10.3.4. Analysis by Area of Expertise
- 10.3.5. Most Active Players: Analysis by Number of Partnerships
- 10.3.6. Analysis by Geography
- 10.3.6.1. Intracontinental and Intercontinental Agreements
- 10.3.6.2. Local and International Agreements
11. MERGERS AND ACQUISITIONS
- 11.1. Chapter Overview
- 11.2. Merger and Acquisition Models
- 11.3. Cell and Gene Therapy CROs: Mergers and Acquisitions
- 11.3.1. Cumulative Year-wise Trend of Mergers and Acquisitions
- 11.3.2. Analysis by Type of Agreement
- 11.3.3. Analysis by Key Value Drivers
- 11.3.4. Analysis by Year of Agreement and Key Value Drivers
- 11.3.5. Most Active Acquirers: Analysis by Number of Acquisitions
- 11.3.6. Analysis by Geography
- 11.3.6.1. Local and International Mergers and Acquisitions
- 11.3.6.2. Intracontinental and Intercontinental Mergers and Acquisitions
- 11.3.7. Key Acquisitions: Deal Multiples
12. KEY ACQUISITION TARGETS
- 12.1. Chapter Overview
- 12.2. Key Assumptions and Parameters
- 12.3. Scope and Methodology
- 12.4. Potential Strategic Acquisition Targets Amongst Small Players
- 12.5. Potential Strategic Acquisition Targets Amongst Mid-sized Players
13. CLINICAL TRIAL ANALYSIS
- 13.1. Chapter Overview
- 13.2. Scope and Methodology
- 13.3. Cell Therapy: Clinical Trial Analysis
- 13.3.1. Analysis by Trial Registration Year
- 13.3.2. Analysis by Trial Status
- 13.3.3. Analysis by Trial Registration Year and Trial Status
- 13.3.4. Analysis by Trial Phase
- 13.3.5. Analysis by Trial Registration Year and Trial Phase
- 13.3.6. Analysis of Enrolled Patient Population by Trial Registration Year
- 13.3.7. Analysis of Enrolled Patient Population by Trial Status
- 13.3.8. Analysis of Enrolled Patient Population by Trial Phase
- 13.3.9. Analysis by Therapeutic Area
- 13.3.10. Analysis by Study Design
- 13.3.11. Analysis by Type of Sponsor / Collaborator
- 13.3.12. Most Active Industry Players: Analysis by Number of Registered Trials
- 13.3.13. Analysis of Number of Registered Trials by Geography
- 13.3.14. Analysis of Number of Registered Trials by Trial Status and Geography
- 13.3.15. Analysis of Enrolled Patient Population by Geography
- 13.3.16. Analysis of Enrolled Patient Population by Trial Status and Geography
- 13.4. Gene Therapy: Clinical Trial Analysis
13.4.1. Analysis by Trial Registration Year
- 13.4.2. Analysis by Trial Status
- 13.4.3. Analysis by Trial Registration Year and Trial Status
- 13.4.4. Analysis by Trial Phase
- 13.4.5. Analysis by Trial Registration Year and Trial Phase
- 13.4.6. Analysis of Enrolled Patient Population by Trial Registration Year
- 13.4.7. Analysis of Enrolled Patient Population by Trial Status
- 13.4.8. Analysis of Enrolled Patient Population by Trial Phase
- 13.4.9. Analysis by Therapeutic Area
- 13.4.10. Analysis by Study Design
- 13.4.11. Analysis by Type of Sponsor / Collaborator
- 13.4.12. Most Active Industry Players: Analysis by Number of Registered Trials
- 13.4.13. Analysis of Number of Registered Trials by Geography
- 13.4.14. Analysis of Number of Registered Trials by Trial Status and Geography
- 13.4.15. Analysis of Enrolled Patient Population by Geography
- 13.4.16. Analysis of Enrolled Patient Population by Trial Status and Geography
14. TOTAL COST OF OWNERSHIP
- 14.1 Chapter Overview
- 14.2. Assumptions and Methodology
- 14.3. Key Parameters
- 14.4 Total Cost of Ownership (Sample Dataset)
- 14.4.1 Total Cost of Ownership for Large / Very Large Cell and Gene Therapy Contract Research Organizations, Y0-Y20
- 14.4.2. Total Cost of Ownership for Large / Very Large Cell and Gene Therapy Contract Research Organizations: Analysis by CAPEX, Y0
- 14.4.3. Total Cost of Ownership for Large / Very Large Cell and Gene Therapy Contract Research Organizations: Analysis by OPEX, Y1-Y20
15. SWOT ANALYSIS
- 15.1. Chapter Overview
- 15.2. Strengths
- 15.3. Weaknesses
- 15.4. Opportunities
- 15.5. Threats
- 15.6. Concluding Remarks
16. GLOBAL CELL AND GENE THERAPY CRO MARKET
- 16.1. Chapter Overview
- 16.2. Key Assumptions and Methodology
- 16.3. Global Cell and Gene Therapy CRO Market, Historical Trends (since 2018) and Forecasted Estimates (till 2035)
- 16.3.1. Scenario Analysis
- 16.3.1.1. Conservative Scenario
- 16.3.2.2. Optimistic Scenario
- 16.3.1. Scenario Analysis
- 16.4. Key Market Segmentations
17. CELL AND GENE THERAPY CRO MARKET, BY TYPE OF CELL THERAPY
- 17.1. Chapter Overview
- 17.2. Key Assumptions and Methodology
- 17.3. Cell and Gene Therapy CRO Market: Distribution by Type of Cell Therapy, 2018, 2024 and 2035
- 17.3.1. CAR-T: Historical Trends (since 2018) and Forecasted Estimates (till 2035)
- 17.3.2. TCR-T: Historical Trends (since 2018) and Forecasted Estimates (till 2035)
- 17.3.2. CAR-NK: Historical Trends (since 2018) and Forecasted Estimates (till 2035)
- 17.3.3. Others: Historical Trends (since 2018) and Forecasted Estimates (till 2035)
- 17.4. Data Triangulation and Validation
18. CELL AND GENE THERAPY CRO MARKET, BY TYPE OF GENETIC MODIFICATION
- 18.1. Chapter Overview
- 18.2. Key Assumptions and Methodology
- 18.3. Cell and Gene Therapy CRO Market: Distribution by Type of Genetic Modification, 2018, 2024 and 2035
- 18.3.1. Ex vivo: Historical Trends (since 2018) and Forecasted Estimates (till 2035)
- 18.3.2. In vivo: Historical Trends (since 2018) and Forecasted Estimates (till 2035)
- 18.4. Data Triangulation and Validation
19. CELL AND GENE THERAPY CRO MARKET, BY STAGE OF DEVELOPMENT
- 19.1. Chapter Overview
- 19.2. Key Assumptions and Methodology
- 19.3. Cell and Gene Therapy CRO Market: Distribution by Stage of Development, 2018, 2024 and 2035
- 19.3.1. Clinical: Historical Trends (since 2018) and Forecasted Estimates (till 2035)
- 19.3.2. Preclinical: Historical Trends (since 2018) and Forecasted Estimates (till 2035)
- 19.3.3. Discovery: Historical Trends (since 2018) and Forecasted Estimates (till 2035)
- 19.4. Data Triangulation and Validation
20. CELL AND GENE THERAPY CRO MARKET, BY THERAPEUTIC AREA
- 20.1. Chapter Overview
- 20.2. Key Assumptions and Methodology
- 20.3. Cell and Gene Therapy CRO Market: Distribution by Therapeutic Area, 2018, 2024 and 2035
- 20.3.1. Oncological Disorders: Historical Trends (since 2018) and Forecasted Estimates (till 2035)
- 20.3.2. Rare Diseases: Historical Trends (since 2018) and Forecasted Estimates (till 2035)
- 20.3.3. Neurological Disorders: Historical Trends (since 2018) and Forecasted Estimates (till 2035)
- 20.3.4. Metabolic Disorders: Historical Trends (since 2018) and Forecasted Estimates (till 2035)
- 20.3.5. Musculoskeletal Disorders: Historical Trends (since 2018) and Forecasted Estimates (till 2035)
- 20.3.6. Cardiovascular Disorders: Historical Trends (since 2018) and Forecasted Estimates (till 2035)
- 20.3.7. Immunological Disorders: Historical Trends (since 2018) and Forecasted Estimates (till 2035)
- 20.3.8. Dermatological Disorders: Historical Trends (since 2018) and Forecasted Estimates (till 2035)
- 20.3.9. Infectious Diseases: Historical Trends (since 2018) and Forecasted Estimates (till 2035)
- 20.3.10. Blood Disorders: Historical Trends (since 2018) and Forecasted Estimates (till 2035)
- 20.3.11. Other Disorders: Historical Trends (since 2018) and Forecasted Estimates (till 2035)
- 20.4. Data Triangulation and Validation
21. CELL AND GENE THERAPY CRO MARKET, BY END-USERS
- 21.1. Chapter Overview
- 21.2. Key Assumptions and Methodology
- 21.3. Cell and Gene Therapy CRO Market: Distribution by End-users, 2018, 2024 and 2035
- 21.3.1. Industry Players: Historical Trends (since 2018) and Forecasted Estimates (till 2035)
- 21.3.2. Non-Industry Players: Historical Trends (since 2018) and Forecasted Estimates (till 2035)
- 21.4. Data Triangulation and Validation
22. CELL AND GENE THERAPY CRO MARKET, BY KEY GEOGRAPHICAL REGIONS
- 22.1. Chapter Overview
- 22.2. Key Assumptions and Methodology
- 22.3. Cell and Gene Therapy CRO Market: Distribution by Key Geographical Regions, 2018, 2024 and 2035
- 22.3.1. North America: Historical Trends (since 2018) and Forecasted Estimates (till 2035)
- 22.3.1.1. US: Historical Trends (since 2018) and Forecasted Estimates (till 2035)
- 22.3.1.2. Canada: Historical Trends (since 2018) and Forecasted Estimates (till 2035)
- 22.3.1.3. Rest of North America: Historical Trends (since 2018) and Forecasted Estimates (till 2035)
- 22.3.2. Europe: Historical Trends (since 2018) and Forecasted Estimates (till 2035)
- 22.3.2.1. Spain: Historical Trends (since 2018) and Forecasted Estimates (till 2035)
- 22.3.2.2. France: Historical Trends (since 2018) and Forecasted Estimates (till 2035)
- 22.3.2.3. UK: Historical Trends (since 2018) and Forecasted Estimates (till 2035)
- 22.3.2.4. Italy: Historical Trends (since 2018) and Forecasted Estimates (till 2035)
- 22.3.2.5. Germany: Historical Trends (since 2018) and Forecasted Estimates (till 2035)
- 22.3.2.6. Russia: Historical Trends (since 2018) and Forecasted Estimates (till 2035)
- 22.3.2.7. Rest of Europe: Historical Trends (since 2018) and Forecasted Estimates (till 2035)
- 22.3.3. Asia-Pacific: Historical Trends (since 2018) and Forecasted Estimates (till 2035)
- 22.3.3.1. China: Historical Trends (since 2018) and Forecasted Estimates (till 2035)
- 22.3.3.2. Japan: Historical Trends (since 2018) and Forecasted Estimates (till 2035)
- 22.3.3.3. South Korea: Historical Trends (since 2018) and Forecasted Estimates (till 2035)
- 22.3.3.4. India: Historical Trends (since 2018) and Forecasted Estimates (till 2035)
- 22.3.3.5. Australia: Historical Trends (since 2018) and Forecasted Estimates (till 2035)
- 22.3.3.6. Rest of Asia-Pacific: Historical Trends (since 2018) and Forecasted Estimates (till 2035)
- 22.3.4. Rest of the World: Historical Trends (since 2018) and Forecasted Estimates (till 2035)
- 22.3.1. North America: Historical Trends (since 2018) and Forecasted Estimates (till 2035)
- 22.4. Data Triangulation and Validation and Validation
23. EXECUTIVE INSIGHTS
- 23.1. Chapter Overview
- 23.2. Aixial
- 23.2.1. Company Snapshot
- 23.2.2. Interview Transcript: Victor Iorgulescu, Business Development Executive
- 23.3. Gsap
- 23.3.1. Company Snapshot
- 23.3.2. Interview Transcript: Mor Moshe, Clinical Trial Manager
- 23.4. CATO SMS
- 23.4.1. Company Snapshot
- 23.4.2. Interview Transcript: Jessica Bliven (Former Director, Marketing and Sales)
- 23.5. Anonymous Company
- 23.5.1. Company Snapshot
- 23.5.2. Interview Transcript: Rhonda Henry, Former President
24. CONCLUDING REMARKS
25. APPENDIX I: TABULATED DATA
26. APPENDIX II: LIST OF COMPANIES AND ORGANIZATIONS
List of Tables
- Table 5.1 List of Approved ATMP Products
- Table 6.1 Attributes of Transactional Outsourcing Model
- Table 7.1 List of Cell and Gene Therapy CROs
- Table 7.2 Cell and Gene Therapy CROs: Information on Scale of Operation
- Table 7.3 Cell and Gene Therapy CROs: Information on Type of Preclinical Services Offered
- Table 7.4 Cell and Gene Therapy CROs: Information on Type of Clinical Services Offered
- Table 7.5 Cell and Gene Therapy CROs: Information on Type of Regulatory Services Offered
- Table 7.6 Cell and Gene Therapy CROs: Information on Type of General Services Offered
- Table 8.1 Cell and Gene Therapy CROs: List of Companies Profiled
- Table 8.2 Aixial: Company Overview
- Table 8.3 Aixial: Service Portfolio
- Table 8.4 Altasciences: Company Overview
- Table 8.5 Altasciences: Service Portfolio
- Table 8.6 Altasciences: Recent Developments and Future Outlook
- Table 8.7 CMIC: Company Overview
- Table 8.8 CMIC: Service Portfolio
- Table 8.9 CMIC: Recent Developments and Future Outlook
- Table 8.10 ICON: Company Overview
- Table 8.11 ICON: Service Portfolio
- Table 8.12 ICON: Recent Developments and Future Outlook
- Table 8.13 Labcorp: Company Overview
- Table 8.14 Labcorp: Service Portfolio
- Table 8.15 Labcorp: Recent Developments and Future Outlook
- Table 8.16 Linical: Company Overview
- Table 8.17 Linical: Service Portfolio
- Table 8.18 Linical: Recent Developments and Future Outlook
- Table 8.19 Medpace: Company Overview
- Table 8.20 Medpace: Service Portfolio
- Table 8.21 Novotech: Company Overview
- Table 8.22 Novotech: Service Portfolio
- Table 8.23 Novotech: Recent Developments and Future Outlook
- Table 8.24 PPD: Company Overview
- Table 8.25 PPD: Service Portfolio
- Table 8.26 PPD: Recent Developments and Future Outlook
- Table 8.27 Precision for Medicine: Company Overview
- Table 8.28 Precision for Medicine: Service Portfolio
- Table 8.29 Precision for Medicine: Recent Developments and Future Outlook
- Table 8.30 QPS: Company Overview
- Table 8.31 QPS: Service Portfolio
- Table 8.32 QPS: Recent Developments and Future Outlook
- Table 8.34 Syneos Health: Company Overview
- Table 8.35 Syneos Health: Service Portfolio
- Table 8.36 Syneos Health: Recent Developments and Future Outlook
- Table 9.1 Benchmark Analysis: Information on Peer Groups
- Table 10.1 Cell and Gene Therapy CRO: List of Partnerships and Collaborations, since 2015
- Table 10.2 Partnerships and Collaborations: Information on Type of Agreement
- Table 11.1 Cell and Gene Therapy CROs: List of Mergers and Acquisitions, since 2015
- Table 11.2 Cell and Gene Therapy CRO Mergers and Acquisitions: Information on Key Value Drivers and Area of Expertise, since 2015
- Table 11.3 Mergers and Acquisitions: Information on Deal Multiples, since 2015
- Table 12.1 Potential Strategic Acquisition Targets Amongst Small Players
- Table 12.2 Potential Strategic Acquisition Targets Amongst Mid-sized Players
- Table 14.1 Total Cost of Ownership: Sample Dataset for Large / Very Large Companies
- Table 23.1 Aixial: Company Snapshot
- Table 23.2 Gsap: Company Snapshot
- Table 23.3 CATO SMS: Company Snapshot
- Table 23.4 Anonymous Company: Company Snapshot
- Table 25.1 Cell and Gene Therapy CROs: Distribution by Year of Establishment
- Table 25.2 Cell and Gene Therapy CROs: Distribution by Company Size
- Table 25.3 Cell and Gene Therapy CROs: Distribution by Location of Headquarters (Region)
- Table 25.4 Cell and Gene Therapy CROs: Distribution by Location of Headquarters (Country)
- Table 25.5 Cell and Gene Therapy CROs: Distribution by Scale of Operation
- Table 25.6 Cell and Gene Therapy CROs: Distribution by Area of Expertise
- Table 25.7 Cell and Gene Therapy CROs: Distribution by Type of Cell Therapy
- Table 25.8 Cell and Gene Therapy CROs: Distribution by Type of Preclinical Services Offered
- Table 25.9 Cell and Gene Therapy CROs: Distribution by Type of Clinical Services Offered
- Table 25.10 Cell and Gene Therapy CROs: Distribution by Type of Regulatory Services Offered
- Table 25.11 Cell and Gene Therapy CROs: Distribution by Type of General Services Offered
- Table 25.12 CMIC: Annual Revenues, FY 2018 Onwards (JPY Billion)
- Table 25.13 Labcorp: Annual Revenues, FY 2018 Onwards (USD Billion)
- Table 25.14 Linical: Annual Revenues, FY 2021 Onwards (JPY Million)
- Table 25.15 Medpace: Annual Revenues, FY 2018 Onwards (USD Million)
- Table 25.16 Syneos Health: Annual Revenues, FY 2018 Onwards (USD Billion)
- Table 25.17 Benchmark Analysis: Distribution by Location of Headquarters and Company Size
- Table 25.18 Partnerships and Collaborations: Cumulative Year-wise Trend, since 2015
- Table 25.19 Partnerships and Collaborations: Distribution by Type of Partnership
- Table 25.20 Partnerships and Collaborations: Distribution by Year and Type of Partnership
- Table 25.21 Partnerships and Collaborations: Distribution by Area of Expertise
- Table 25.22 Partnerships and Collaborations: Intracontinental and Intercontinental Agreements
- Table 25.23 Partnerships and Collaborations: Local and International Agreements
- Table 25.24 Most Active Players: Distribution by Number of Partnerships
- Table 25.25 Mergers and Acquisitions: Cumulative Year-wise Trend, since 2015
- Table 25.26 Mergers and Acquisitions: Distribution by Type of Agreement
- Table 25.27 Mergers and Acquisitions: Distribution by Key Value Drivers
- Table 25.28 Mergers and Acquisitions: Distribution by Year of Acquisition and Key Value Drivers
- Table 25.29 Most Active Acquirers: Distribution by Number of Acquisitions
- Table 25.30 Mergers and Acquisitions: Intercontinental and Intracontinental
- Table 25.31 Mergers and Acquisitions: Local and International
- Table 25.32 Mergers and Acquisitions: Deal Multiples Based on Revenues
- Table 25.33 Clinical Trial Analysis for Cell Therapies: Cumulative Year-wise Trend, since 2018
- Table 25.34 Clinical Trial Analysis for Cell Therapies: Distribution by Trial Status
- Table 25.35 Clinical Trial Analysis for Cell Therapies: Distribution by Trial Registration Year and Trial Status, since 2018
- Table 25.36 Clinical Trial Analysis for Cell Therapies: Distribution by Trial Phase
- Table 25.37 Clinical Trial Analysis for Cell Therapies: Distribution by Trial Registration Year and Trial Phase, since 2018
- Table 25.38 Clinical Trial Analysis for Cell Therapies: Distribution of Enrolled Patient Population by Trial Registration Year, since 2018
- Table 25.39 Clinical Trial Analysis for Cell Therapies: Distribution of Enrolled Patient Population by Trial Status
- Table 25.40 Clinical Trial Analysis for Cell Therapies: Distribution of Enrolled Patient Population by Trial Phase
- Table 25.41 Clinical Trial Analysis for Cell Therapies: Distribution by Therapeutic Area
- Table 25.42 Clinical Trial Analysis for Cell Therapies: Distribution by Study Design
- Table 25.43 Clinical Trial Analysis for Cell Therapies: Distribution by Type of Sponsor / Collaborator
- Table 25.44 Most Active Industry Players: Distribution by Number of Registered Trials
- Table 25.45 Clinical Trial Analysis for Cell Therapies: Distribution of Number of Registered Trials by Geography
- Table 25.46 Clinical Trial Analysis for Cell Therapies: Distribution of Number of Registered Trials by Trial Status and Geography
- Table 25.47 Clinical Trial Analysis for Cell Therapies: Distribution of Enrolled Patient Population by Geography
- Table 25.48 Clinical Trial Analysis for Cell Therapies: Distribution of Enrolled Patient Population by Trial Status and Geography
- Table 25.49 Clinical Trial Analysis for Gene Therapies: Cumulative Year-wise Trend, since 2018
- Table 25.50 Clinical Trial Analysis for Gene Therapies: Distribution by Trial Status
- Table 25.51 Clinical Trial Analysis for Gene Therapies: Distribution by Trial Registration Year and Trial Status, since 2018
- Table 25.52 Clinical Trial Analysis for Gene Therapies: Distribution by Trial Phase
- Table 25.53 Clinical Trial Analysis for Gene Therapies: Distribution by Trial Registration Year and Trial Phase, since 2018
- Table 25.54 Clinical Trial Analysis for Gene Therapies: Distribution of Enrolled Patient Population by Trial Registration Year, since 2018
- Table 25.55 Clinical Trial Analysis for Gene Therapies: Distribution of Enrolled Patient Population by Trial Status
- Table 25.56 Clinical Trial Analysis for Gene Therapies: Distribution of Enrolled Patient Population by Trial Phase
- Table 25.57 Clinical Trial Analysis for Gene Therapies: Distribution by Therapeutic Area
- Table 25.58 Clinical Trial Analysis for Gene Therapies: Distribution by Study Design
- Table 25.59 Clinical Trial Analysis for Gene Therapies: Distribution by Type of Sponsor / Collaborator
- Table 25.60 Most Active Industry Players: Distribution by Number of Registered Trials
- Table 25.61 Clinical Trial Analysis for Gene Therapies: Distribution of Number of Registered Trials by Geography
- Table 25.62 Clinical Trial Analysis for Gene Therapies: Distribution of Number of Registered Trials by Trial Status and Geography
- Table 25.63 Clinical Trial Analysis for Gene Therapies: Distribution of Enrolled Patient Population by Geography
- Table 25.64 Clinical Trial Analysis for Gene Therapies: Distribution of Enrolled Patient Population by Trial Status and Geography
- Table 25.65 Total Cost of Ownership for Large / Very Large Cell and Gene Therapy Contract Research Organizations, Y0-Y20 (USD Million)
- Table 25.66 Total Cost of Ownership for Large / Very Large Cell and Gene Therapy Contract Research Organizations, Y0: Distribution of CAPEX
- Table 25.67 Total Cost of Ownership for Large / Very Large Cell and Gene Therapy Contract Research Organizations, Y1-Y20: Distribution by OPEX (USD Million)
- Table 25.68 Global Cell and Gene Therapy CRO Market, Historical Trends (since 2018) and Forecasted Estimates (till 2035) (USD Million)
- Table 25.69 Global Cell and Gene Therapy CRO Market, Forecasted Estimates (till 2035): Conservative Scenario (USD Million)
- Table 25.70 Global Cell and Gene Therapy CRO Market, Forecasted Estimates (till 2035): Optimistic Scenario (USD Million)
- Table 25.71 Cell and Gene Therapy CRO Market: Distribution by Type of Cell Therapy, 2018, 2024 and 2035
- Table 25.72 Cell and Gene Therapy CRO Market for CAR-T, Historical Trends (since 2018) and Forecasted Estimates (till 2035) (USD Million)
- Table 25.73 Cell and Gene Therapy CRO Market for TCR-T, Historical Trends (since 2018) and Forecasted Estimates (till 2035) (USD Million)
- Table 25.74 Cell and Gene Therapy CRO Market for CAR-NK, Historical Trends (since 2018) and Forecasted Estimates (till 2035) (USD Million)
- Table 25.75 Cell and Gene Therapy CRO Market for Others, Historical Trends (since 2018) and Forecasted Estimates (till 2035) (USD Million)
- Table 25.76 Cell and Gene Therapy CRO Market: Distribution by Type of Genetic Modification, 2018, 2024 and 2035
- Table 25.77 Cell and Gene Therapy CRO Market for Ex vivo, Historical Trends (since 2018) and Forecasted Estimates (till 2035) (USD Million)
- Table 25.78 Cell and Gene Therapy CRO Market for In vivo, Historical Trends (since 2018) and Forecasted Estimates (till 2035) (USD Million)
- Table 25.79 Cell and Gene Therapy CRO Market: Distribution by Stage of Development, 2018, 2024 and 2035
- Table 25.80 Cell and Gene Therapy CRO Market for Clinical, Historical Trends (since 2018) and Forecasted Estimates (till 2035) (USD Million)
- Table 25.81 Cell and Gene Therapy CRO Market for Preclinical, Historical Trends (since 2018) and Forecasted Estimates (till 2035) (USD Million)
- Table 25.82 Cell and Gene Therapy CRO Market for Discovery, Historical Trends (since 2018) and Forecasted Estimates (till 2035) (USD Million)
- Table 25.83 Cell and Gene Therapy CRO Market: Distribution by Therapeutic Area, 2018, 2024 and 2035
- Table 25.84 Cell and Gene Therapy CRO Market for Oncological Disorders, Historical Trends (since 2018) and Forecasted Estimates (till 2035) (USD Million)
- Table 25.85 Cell and Gene Therapy CRO Market for Rare Diseases, Historical Trends (since 2018) and Forecasted Estimates (till 2035) (USD Million)
- Table 25.86 Cell and Gene Therapy CRO Market for Neurological Disorders, Historical Trends (since 2018) and Forecasted Estimates (till 2035) (USD Million)
- Table 25.87 Cell and Gene Therapy CRO Market for Metabolic Disorders, Historical Trends (since 2018) and Forecasted Estimates (till 2035) (USD Million)
- Table 25.88 Cell and Gene Therapy CRO Market for Musculoskeletal Disorders, Historical Trends (since 2018) and Forecasted Estimates (till 2035) (USD Million)
- Table 25.89 Cell and Gene Therapy CRO Market for Cardiovascular Disorders, Historical Trends (since 2018) and Forecasted Estimates (till 2035) (USD Million)
- Table 25.90 Cell and Gene Therapy CRO Market for Immunological Disorders, Historical Trends (since 2018) and Forecasted Estimates (till 2035) (USD Million)
- Table 25.91 Cell and Gene Therapy CRO Market for Dermatological Disorders, Historical Trends (since 2018) and Forecasted Estimates (till 2035) (USD Million)
- Table 25.92 Cell and Gene Therapy CRO Market for Infectious Diseases, Historical Trends (since 2018) and Forecasted Estimates (till 2035) (USD Million)
- Table 25.93 Cell and Gene Therapy CRO Market for Blood Disorders Historical Trends (since 2018) and Forecasted Estimates (till 2035) (USD Million)
- Table 25.94 Cell and Gene Therapy CRO Market for Other Disorders, Historical Trends (since 2018) and Forecasted Estimates (till 2035) (USD Million)
- Table 25.95 Cell and Gene Therapy CRO Market: Distribution by End-users, 2018, 2024 and 2035
- Table 25.96 Cell and Gene Therapy CRO Market for Industry Players, Historical Trends (since 2018) and Forecasted Estimates (till 2035) (USD Million)
- Table 25.97 Cell and Gene Therapy CRO Market for Non-Industry Players, Historical Trends (since 2018) and Forecasted Estimates (till 2035) (USD Million)
- Table 25.98 Cell and Gene Therapy CRO Market: Distribution by Key Geographical Regions, 2018, 2024 and 2035
- Table 25.99 Cell and Gene Therapy CRO Market in North America, Historical Trends (since 2018) and Forecasted Estimates (till 2035) (USD Million)
- Table 25.100 Cell and Gene Therapy CRO Market in the US, Historical Trends (since 2018) and Forecasted Estimates (till 2035) (USD Million)
- Table 25.101 Cell and Gene Therapy CRO Market in Canada, Historical Trends (since 2018) and Forecasted Estimates (till 2035) (USD Million)
- Table 25.102 Cell and Gene Therapy CRO Market in Rest of North America, Historical Trends (since 2018) and Forecasted Estimates (till 2035) (USD Million)
- Table 25.103 Cell and Gene Therapy CRO Market in Europe, Historical Trends (since 2018) and Forecasted Estimates (till 2035) (USD Million)
- Table 25.104 Cell and Gene Therapy CRO Market in Spain, Historical Trends (since 2018) and Forecasted Estimates (till 2035) (USD Million)
- Table 25.105 Cell and Gene Therapy CRO Market in France, Historical Trends (since 2018) and Forecasted Estimates (till 2035) (USD Million)
- Table 25.106 Cell and Gene Therapy CRO Market in the UK, Historical Trends (since 2018) and Forecasted Estimates (till 2035) (USD Million)
- Table 25.107 Cell and Gene Therapy CRO Market in Italy, Historical Trends (since 2018) and Forecasted Estimates (till 2035) (USD Million)
- Table 25.108 Cell and Gene Therapy CRO Market in Germany, Historical Trends (since 2018) and Forecasted Estimates (till 2035) (USD Million)
- Table 25.109 Cell and Gene Therapy CRO Market in Russia, Historical Trends (since 2018) and Forecasted Estimates (till 2035) (USD Million)
- Table 25.110 Cell and Gene Therapy CRO Market in Rest of Europe, Historical Trends (since 2018) and Forecasted Estimates (till 2035) (USD Million)
- Table 25.111 Cell and Gene Therapy CRO Market in Asia-Pacific, Historical Trends (since 2018) and Forecasted Estimates (till 2035) (USD Million)
- Table 25.112 Cell and Gene Therapy CRO Market in China, Historical Trends (since 2018) and Forecasted Estimates (till 2035) (USD Million)
- Table 25.113 Cell and Gene Therapy CRO Market in Japan, Historical Trends (since 2018) and Forecasted Estimates (till 2035) (USD Million)
- Table 25.114 Cell and Gene Therapy CRO Market in South Korea, Historical Trends (since 2018) and Forecasted Estimates (till 2035) (USD Million)
- Table 25.115 Cell and Gene Therapy CRO Market in India, Historical Trends (since 2018) and Forecasted Estimates (till 2035) (USD Million)
- Table 25.116 Cell and Gene Therapy CRO Market in Australia, Historical Trends (since 2018) and Forecasted Estimates (till 2035) (USD Million)
- Table 25.117 Cell and Gene Therapy CRO Market in Rest of Asia-Pacific, Historical Trends (since 2018) and Forecasted Estimates (till 2035) (USD Million)
- Table 25.118 Cell and Gene Therapy CRO Market in Rest of the World, Historical Trends (since 2018) and Forecasted Estimates (till 2035) (USD Million)
List of Figures
- Figure 2.1 Research Methodology: Project Methodology
- Figure 2.2 Research Methodology: Forecast Methodology
- Figure 2.3 Research Methodology: Robust Quality Control
- Figure 2.4 Research Methodology: Key Market Segmentations
- Figure 3.1 Lessons Learnt from Past Recessions
- Figure 4.1 Executive Summary: CROs Market Landscape (I /II)
- Figure 4.2 Executive Summary: CROs Market Landscape (II /II)
- Figure 4.3 Executive Summary: Partnerships and Collaborations
- Figure 4.4 Executive Summary: Mergers and Acquisitions
- Figure 4.5 Executive Summary: Cell Therapy Clinical Trial Analysis
- Figure 4.6 Executive Summary: Gene Therapy Clinical Trial Analysis
- Figure 4.7 Executive Summary: Market Sizing and Opportunity Analysis
- Figure 5.1 Stages of the Drug Development Process
- Figure 5.2 Type of Services Offered by CROs
- Figure 5.3 Classification of ATMPs
- Figure 5.4 Types of Cells Incorporated in Cell Therapy Medicinal Products
- Figure 5.5 Advantages of Outsourcing Operations to CROs
- Figure 5.6 Risks Associated with Outsourcing to CROs
- Figure 6.1 Outsourcing Models
- Figure 6.2 Key Characteristics of Transactional Outsourcing Model
- Figure 6.3 Key Characteristics of Performance -based Business Model
- Figure 6.4 Role of a CRO in Different Phases of Drug Development
- Figure 6.5 Key Considerations for Outsourcing Cell and Gene Therapy Operations
- Figure 7.1 Cell and Gene Therapy CROs: Distribution by Year of Establishment
- Figure 7.2 Cell and Gene Therapy CROs: Distribution by Company Size
- Figure 7.3 Cell and Gene Therapy CROs: Distribution by Location of Headquarters (Region)
- Figure 7.4 Cell and Gene Therapy CROs: Distribution by Location of Headquarters (Country)
- Figure 7.5 Cell and Gene Therapy CROs: Distribution by Area of Expertise
- Figure 7.6 Cell and Gene Therapy CROs: Distribution by Type of Cell Therapy
- Figure 7.7 Cell and Gene Therapy CROs: Distribution by Scale of Operation
- Figure 7.8 Cell and Gene Therapy CROs: Distribution by Type of Preclinical Services Offered
- Figure 7.9 Cell and Gene Therapy CROs: Distribution by Type of Clinical Services Offered
- Figure 7.10 Cell and Gene Therapy CROs: Distribution by Type of Regulatory Services Offered
- Figure 7.11 Cell and Gene Therapy CROs: Distribution by Type of General Services Offered
- Figure 8.1 CMIC: Annual Revenues, FY 2018 Onwards (JPY Billion)
- Figure 8.2 Labcorp: Annual Revenues, FY 2018 Onwards (USD Billion)
- Figure 8.3 Linical: Annual Revenues, FY 2021 Onwards (JPY Million)
- Figure 8.4 Medpace: Annual Revenues, FY 2018 Onwards (USD Million)
- Figure 8.5 Syneos Health: Annual Revenues, FY 2018 Onwards (USD Billion)
- Figure 9.1 Benchmark Analysis: Distribution of Players by Location of Headquarters and Company Size
- Figure 9.2 Benchmarking Analysis: Small Players Based in North America (Peer Group I)
- Figure 9.3 Benchmarking Analysis: Mid-Sized Players Based in North America (Peer Group II)
- Figure 9.4 Benchmarking Analysis: Large and Very Large Players Based in North America (Peer Group III)
- Figure 9.5 Benchmarking Analysis: Small Players Based in Europe (Peer Group IV)
- Figure 9.6 Benchmarking Analysis: Mid-sized Players Based in Europe (Peer Group V)
- Figure 9.7 Benchmarking Analysis: Large and Very Large Players Based in Europe (Peer Group VI)
- Figure 9.8 Benchmarking Analysis: Small, Mid-sized, Large and Very Large Players Based in Asia-Pacific (Peer Group VII)
- Figure 9.9 Benchmarking Analysis: Small and Mid-sized Players Based in Rest of the World (Peer Group VIII)
- Figure 10.1 Partnerships and Collaborations: Cumulative Year-wise Trend, since 2015
- Figure 10.2 Partnerships and Collaborations: Distribution by Type of Partnership
- Figure 10.3 Partnerships and Collaborations: Distribution by Year and Type of Partnership
- Figure 10.4 Partnerships and Collaborations: Distribution by Area of Expertise
- Figure 10.5 Most Active Players: Distribution by Number of Partnerships
- Figure 10.6 Partnerships and Collaborations: Intracontinental and Intercontinental Agreements
- Figure 10.7 Partnerships and Collaborations: Local and International Agreements
- Figure 11.1 Mergers and Acquisitions: Cumulative Year-wise Trend, since 2015
- Figure 11.2 Mergers and Acquisitions: Distribution by Type of Agreement
- Figure 11.3 Mergers and Acquisitions: Distribution by Key Value Drivers
- Figure 11.4 Mergers and Acquisitions: Distribution by Year of Agreement and Key Value Drivers
- Figure 11.5 Most Active Acquirers: Distribution by Number of Acquisitions
- Figure 11.6 Local and International Mergers and Acquisitions
- Figure 11.7 Intercontinental and Intracontinental Mergers and Acquisitions
- Figure 11.8 Mergers and Acquisitions: Deal Multiples Based on Revenues
- Figure 13.1 Clinical Trial Analysis for Cell Therapies: Scope and Methodology
- Figure 13.2 Clinical Trial Analysis for Gene Therapies: Scope and Methodology
- Figure 13.3 Clinical Trial Analysis for Cell Therapies: Cumulative Year-wise Trend, since 2018
- Figure 13.4 Clinical Trial Analysis for Cell Therapies: Distribution by Trial Status
- Figure 13.5 Clinical Trial Analysis for Cell Therapies: Distribution by Trial Registration Year and Trial Status, since 2018
- Figure 13.6 Clinical Trial Analysis for Cell Therapies: Distribution by Trial Phase
- Figure 13.7 Clinical Trial Analysis for Cell Therapies: Distribution by Trial Registration Year and Trial Phase, since 2018
- Figure 13.8 Clinical Trial Analysis for Cell Therapies: Distribution of Enrolled Patient Population by Trial Registration Year, since 2018
- Figure 13.9 Clinical Trial Analysis for Cell Therapies: Distribution of Enrolled Patient Population by Trial Status
- Figure 13.10 Clinical Trial Analysis for Cell Therapies: Distribution of Enrolled Patient Population by Trial Phase
- Figure 13.11 Clinical Trial Analysis for Cell Therapies: Distribution by Therapeutic Area
- Figure 13.12 Clinical Trial Analysis for Cell Therapies: Distribution by Study Design
- Figure 13.13 Clinical Trial Analysis for Cell Therapies: Distribution by Type of Sponsor / Collaborator
- Figure 13.14 Most Active Industry Players: Distribution by Number of Registered Trials
- Figure 13.15 Clinical Trial Analysis for Cell Therapies: Distribution of Number of Registered Trials by Geography
- Figure 13.16 Clinical Trial Analysis for Cell Therapies: Distribution of Number of Registered Trials by Trial Status and Geography
- Figure 13.17 Clinical Trial Analysis for Cell Therapies: Distribution of Enrolled Patient Population by Geography
- Figure 13.18 Clinical Trial Analysis for Cell Therapies: Distribution of Enrolled Patient Population by Trial Status and Geography
- Figure 13.19 Clinical Trial Analysis for Gene Therapies: Cumulative Year-wise Trend, since 2018
- Figure 13.20 Clinical Trial Analysis for Gene Therapies: Distribution by Trial Status
- Figure 13.21 Clinical Trial Analysis for Gene Therapies: Distribution by Trial Registration Year and Trial Status, since 2018
- Figure 13.22 Clinical Trial Analysis for Gene Therapies: Distribution by Trial Phase
- Figure 13.23 Clinical Trial Analysis for Gene Therapies: Distribution by Trial Registration Year and Trial Phase, since 2018
- Figure 13.24 Clinical Trial Analysis for Gene Therapies: Distribution of Enrolled Patient Population by Trial Registration Year, since 2018
- Figure 13.25 Clinical Trial Analysis for Gene Therapies: Distribution of Enrolled Patient Population by Trial Status
- Figure 13.26 Clinical Trial Analysis for Gene Therapies: Distribution of Enrolled Patient Population by Trial Phase
- Figure 13.27 Clinical Trial Analysis for Gene Therapies: Distribution by Therapeutic Area
- Figure 13.28 Clinical Trial Analysis for Gene Therapies: Distribution by Study Design
- Figure 13.29 Clinical Trial Analysis for Gene Therapies: Distribution by Type of Sponsor / Collaborator
- Figure 13.30 Most Active Industry Players: Distribution by Number of Registered Trials
- Figure 13.31 Clinical Trial Analysis for Gene Therapies: Distribution of Number of Registered Trials by Geography
- Figure 13.32 Clinical Trial Analysis for Gene Therapies: Distribution of Number of Registered Trials by Trial Status and Geography
- Figure 13.33 Clinical Trial Analysis for Gene Therapies: Distribution of Enrolled Patient Population by Geography
- Figure 13.34 Clinical Trial Analysis for Gene Therapies: Distribution of Enrolled Patient Population by Trial Status and Geography
- Figure 14.1 Total Cost of Ownership: Capital Expenditures (CAPEX)
- Figure 14.2 Total Cost of Ownership: Operational Expenditures (OPEX)
- Figure 14.3 Total Cost of Ownership for Large / Very Large Cell and Gene Therapy Contract Research Organizations, Y0-Y20 (USD Million)
- Figure 14.4 Total Cost of Ownership for Large / Very Large Cell and Gene Therapy Contract Research Organizations, Y0: Distribution of CAPEX
- Figure 14.5 Total Cost of Ownership for Large / Very Large Cell and Gene Therapy Contract Research Organizations, Y1-Y20: Distribution by OPEX (USD Million)
- Figure 15.1 Cell and Gene Therapy Service Providers: SWOT Analysis
- Figure 15.2 Comparison of SWOT Factors: Harvey Ball Analysis
- Figure 16.1 Global Cell and Gene Therapy CRO Market, Historical Trends (since 2018) and Forecasted Estimates (till 2035) (USD Million)
- Figure 16.2 Global Cell and Gene Therapy CRO Market, Forecasted Estimates (till 2035): Conservative Scenario (USD Million)
- Figure 16.3 Global Cell and Gene Therapy CRO Market, Forecasted Estimates (till 2035): Optimistic Scenario (USD Million)
- Figure 17.1 Cell and Gene Therapy CRO Market: Distribution by Type of Cell Therapy, 2018 , 2024 and 2035
- Figure 17.2 Cell and Gene Therapy CRO Market for CAR-T, Historical Trends (since 2018) and Forecasted Estimates (till 2035) (USD Million)
- Figure 17.3 Cell and Gene Therapy CRO Market for TCR-T, Historical Trends (since 2018) and Forecasted Estimates (till 2035) (USD Million)
- Figure 17.4 Cell and Gene Therapy CRO Market for CAR-NK, Historical Trends (since 2018) and Forecasted Estimates (till 2035) (USD Million)
- Figure 17.5 Cell and Gene Therapy CRO Market for Others, Historical Trends (since 2018) and Forecasted Estimates (till 2035) (USD Million)
- Figure 18.1 Cell and Gene Therapy CRO Market: Distribution by Type of Genetic Modification, 2018, 2024 and 2035
- Figure 18.2 Cell and Gene Therapy CRO Market for Ex vivo, Historical Trends (since 2018) and Forecasted Estimates (till 2035) (USD Million)
- Figure 18.3 Cell and Gene Therapy CRO Market for In vivo, Historical Trends (since 2018) and Forecasted Estimates (till 2035) (USD Million)
- Figure 19.1 Cell and Gene Therapy CRO Market: Distribution by Stage of Development, 2018, 2024 and 2035
- Figure 19.2 Cell and Gene Therapy CRO Market for Clinical, Historical Trends (since 2018) and Forecasted Estimates (till 2035) (USD Million)
- Figure 19.3 Cell and Gene Therapy CRO Market for Preclinical, Historical Trends (since 2018) and Forecasted Estimates (till 2035) (USD Million)
- Figure 19.4 Cell and Gene Therapy CRO Market for Discovery, Historical Trends (since 2018) and Forecasted Estimates (till 2035) (USD Million)
- Figure 20.1 Cell and Gene Therapy CRO Market: Distribution by Therapeutic Area, 2018, 2024 and 2035
- Figure 20.2 Cell and Gene Therapy CRO Market for Oncological Disorders, Historical Trends (since 2018) and Forecasted Estimates (till 2035) (USD Million)
- Figure 20.3 Cell and Gene Therapy CRO Market for Rare Diseases, Historical Trends (since 2018) and Forecasted Estimates (till 2035) (USD Million)
- Figure 20.4 Cell and Gene Therapy CRO Market for Neurological Disorders, Historical Trends (since 2018) and Forecasted Estimates (till 2035) (USD Million)
- Figure 20.5 Cell and Gene Therapy CRO Market for Metabolic Disorders, Historical Trends (since 2018) and Forecasted Estimates (till 2035) (USD Million)
- Figure 20.6 Cell and Gene Therapy CRO Market for Musculoskeletal Disorders, Historical Trends (since 2018) and Forecasted Estimates (till 2035) (USD Million)
- Figure 20.7 Cell and Gene Therapy CRO Market for Cardiovascular Disorders, Historical Trends (since 2018) and Forecasted Estimates (till 2035) (USD Million)
- Figure 20.8 Cell and Gene Therapy CRO Market for Immunological Disorders, Historical Trends (since 2018) and Forecasted Estimates (till 2035) (USD Million)
- Figure 20.9 Cell and Gene Therapy CRO Market for Dermatological Disorders, Historical Trends (since 2018) and Forecasted Estimates (till 2035) (USD Million)
- Figure 20.10 Cell and Gene Therapy CRO Market for Infectious Diseases, Historical Trends (since 2018) and Forecasted Estimates (till 2035) (USD Million)
- Figure 20.11 Cell and Gene Therapy CRO Market for Blood Disorders, Historical Trends (since 2018) and Forecasted Estimates (till 2035) (USD Million)
- Figure 20.12 Cell and Gene Therapy CRO Market for Other Disorders, Historical Trends (since 2018) and Forecasted Estimates (till 2035) (USD Million)
- Figure 21.1 Cell and Gene Therapy CRO Market: Distribution by End-users, 2018, 2024 and 2035
- Figure 21.2 Cell and Gene Therapy CRO Market for Industry Players, Historical Trends (since 2018) and Forecasted Estimates (till 2035) (USD Million)
- Figure 21.3 Cell and Gene Therapy CRO Market for Non-Industry Players, Historical Trends (since 2018) and Forecasted Estimates (till 2035) (USD Million)
- Figure 22.1 Cell and Gene Therapy CRO Market: Distribution by Key Geographical Regions, 2018, 2024 and 2035
- Figure 22.2 Cell and Gene Therapy CRO Market in North America, Historical Trends (since 2018) and Forecasted Estimates (till 2035) (USD Million)
- Figure 22.3 Cell and Gene Therapy CRO Market in the US, Historical Trends (since 2018) and Forecasted Estimates (till 2035) (USD Million)
- Figure 22.4 Cell and Gene Therapy CRO Market in Canada, Historical Trends (since 2018) and Forecasted Estimates (till 2035) (USD Million)
- Figure 22.5 Cell and Gene Therapy CRO Market in Rest of North America, Historical Trends (since 2018) and Forecasted Estimates (till 2035) (USD Million)
- Figure 22.6 Cell and Gene Therapy CRO Market in Europe, Historical Trends (since 2018) and Forecasted Estimates (till 2035) (USD Million)
- Figure 22.7 Cell and Gene Therapy CRO Market in Spain, Historical Trends (since 2018) and Forecasted Estimates (till 2035) (USD Million)
- Figure 22.8 Cell and Gene Therapy CRO Market in France, Historical Trends (since 2018) and Forecasted Estimates (till 2035) (USD Million)
- Figure 22.9 Cell and Gene Therapy CRO Market in the UK, Historical Trends (since 2018) and Forecasted Estimates (till 2035) (USD Million)
- Figure 22.10 Cell and Gene Therapy CRO Market in Italy, Historical Trends (since 2018) and Forecasted Estimates (till 2035) (USD Million)
- Figure 22.11 Cell and Gene Therapy CRO Market in Germany, Historical Trends (since 2018) and Forecasted Estimates (till 2035) (USD Million)
- Figure 22.12 Cell and Gene Therapy CRO Market in Russia, Historical Trends (since 2018) and Forecasted Estimates (till 2035) (USD Million)
- Figure 22.13 Cell and Gene Therapy CRO Market in Rest of Europe, Historical Trends (since 2018) and Forecasted Estimates (till 2035) (USD Million)
- Figure 22.14 Cell and Gene Therapy CRO Market in Asia-Pacific, Historical Trends (since 2018) and Forecasted Estimates (till 2035) (USD Million)
- Figure 22.15 Cell and Gene Therapy CRO Market in China, Historical Trends (since 2018) and Forecasted Estimates (till 2035) (USD Million)
- Figure 22.16 Cell and Gene Therapy CRO Market in Japan, Historical Trends (since 2018) and Forecasted Estimates (till 2035) (USD Million)
- Figure 22.17 Cell and Gene Therapy CRO Market in South Korea, Historical Trends (since 2018) and Forecasted Estimates (till 2035) (USD Million)
- Figure 22.18 Cell and Gene Therapy CRO Market in India, Historical Trends (since 2018) and Forecasted Estimates (till 2035) (USD Million)
- Figure 22.19 Cell and Gene Therapy CRO Market in Australia, Historical Trends (since 2018) and Forecasted Estimates (till 2035) (USD Million)
- Figure 22.20 Cell and Gene Therapy CRO Market in Rest of Asia-Pacific, Historical Trends (since 2018) and Forecasted Estimates (till 2035) (USD Million)
- Figure 22.21 Cell and Gene Therapy CRO Market in Rest of the World, Historical Trends (since 2018) and Forecasted Estimates (till 2035)
- Figure 24.1 Concluding Remarks: Overall Market Landscape
- Figure 24.2 Concluding Remarks: Partnerships and Collaborations
- Figure 24.3 Concluding Remarks: Mergers and Acquisitions
- Figure 24.4 Concluding Remarks: Clinical Trial Analysis for Cell Therapies
- Figure 24.5 Concluding Remarks: Clinical Trial Analysis for Gene Therapies
- Figure 24.6 Concluding Remarks: Market Sizing and Opportunity Analysis (I / II)
- Figure 24.7 Concluding Remarks: Market Sizing and Opportunity Analysis (II / II)

