
PUBLISHER: Roots Analysis | PRODUCT CODE: 1682703

PUBLISHER: Roots Analysis | PRODUCT CODE: 1682703
Long-Acting Drug Delivery Technologies and Services Market by Compatible Dosage Form, Principle, Strategy, Type of Molecule Delivered, Type of Material Used, and Key Geographical Regions : Industry Trends and Global Forecasts, Till 2035
LONG-ACTING DRUG DELIVERY TECHNOLOGIES AND SERVICES MARKET: OVERVIEW
As per Roots Analysis, the global long-acting drug delivery technologies and services market is estimated to grow from USD 1.06 billion in the current year to USD 4.62 billion by 2035, at a CAGR of 13.1% during the forecast period, till 2035.
The market sizing and opportunity analysis has been segmented across the following parameters:
Principle
- Manipulation of drug release from delivery systems
- Manipulation of in vivo clearance
Strategy
- Chemical Modification
- Micro-encapsulation
- Long-Acting Hydrogels
- Long-Acting Implants
- Long-Acting Microneedles
- Multivesicular Liposomes
- Nanocrystal Suspensions
- Protein Fusion
Compatible Dosage Form
- Long-Acting Injectables
- Long-Acting Implantables
- Long-Acting Oral,
- Topical / Transdermal
- Vaginal
- Other Dosage Forms
Type of Molecule Delivered
- Small Molecules
- Biologics
- Other Molecules
Type of Material Used
- Polymer based
- Non-polymer based
Key Geographical Regions
- North America
- Europe
- Asia-Pacific
- Middle East and North Africa
LONG-ACTING DRUG DELIVERY TECHNOLOGIES AND SERVICES MARKET: GROWTH AND TRENDS
Long-acting drug delivery systems are being widely adopted for sustained delivery of pharmaceutical drugs to treat a plethora of disease indications, including neurological diseases, infectious diseases, pulmonary diseases, ophthalmological diseases and opioid use disorders. These systems enable effective administration and improved efficacy of peptides, antibodies and vaccines. These novel delivery systems also enable the effective administration of macromolecules for a long-term effect, which are otherwise difficult to administer. Given the potential of long-acting drug delivery systems to improve patient compliance and adherence to medication, industry players have undertaken numerous initiatives to enable the clinical and commercial translation of long-acting drugs under development. This has led to the development of drugs that exhibit prolonged effects (for a few months or years). The application of long-acting therapeutics has the potential to benefit not only the patients but also the healthcare system. In particular, these formulations are beneficial to treat women living in low / middle income countries, as it will result in a substantial drop in the anticipated clinic visits and associated costs.
Further, owing to the formulation and developmental challenges associated with complex dosage forms, the reliability of stakeholders having expertise in the long-acting drug delivery field has grown significantly. This will eventually aid drug developers to address bottlenecks stemming from conventional treatment options and improve the overall clinical outcome. Driven by the technological advancements in the field and rising demand for long-acting drugs, the long-acting drug delivery technologies and services market is anticipated to witness notable growth in the foreseen future.
LONG-ACTING DRUG DELIVERY TECHNOLOGIES AND SERVICES MARKET: KEY INSIGHTS
The report delves into the current state of the long-acting drug delivery technologies and services market and identifies potential growth opportunities within the industry. Some key findings from the report include:
1. At present, more than 100 long-acting drug delivery technologies are being offered by companies across the globe in order to develop long-acting drugs for a myriad of disease indications.
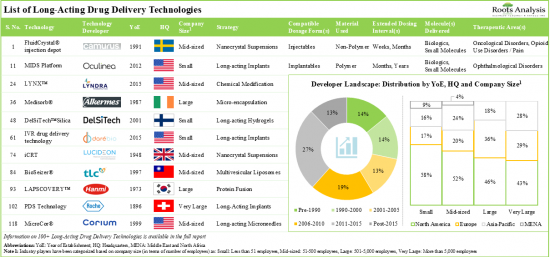
2. Nearly 90% of the technologies are based on manipulation of drug release profile; majority of these technologies can support the development of long-acting injectables with dosing intervals of at least a month.
3. In pursuit of gaining a competitive edge, industry stakeholders are actively innovating and developing novel long-acting drug delivery technologies that can be utilized across multiple therapeutic areas.
4. The current service providers landscape features the presence of over 40 companies, offering a wide range of development and manufacturing services for the long-acting delivery of drugs.
5. The market is fragmented, featuring the presence of both established players and small firms that have the expertise to develop / manufacture long-acting drugs / delivery systems for various dosage forms.
6. The growing interest in this domain is clearly evident from the rise in partnership activity; in fact, more than 60 collaborations related to long-acting drug delivery were inked in the last three years.
7. ~575 scientific articles published recently signify the focused efforts being led by researchers to identify and develop novel long-acting technologies and therapeutic interventions.
8. Over 1,200 patents related to long-acting drug delivery have been filed / granted by various stakeholders in order to protect the intellectual property generated within this field.
9. 400+ grants have been awarded for the ongoing R&D efforts for long-acting drug delivery; University of North Carolina and John Hopkins University have emerged as the most popular recipient organizations.
10. The market opportunity associated with long-acting drug delivery technologies is anticipated to witness an annualized growth of nearly 13% over the next decade.
LONG-ACTING DRUG DELIVERY TECHNOLOGIES AND SERVICES MARKET: KEY SEGMENTS
Manipulation of Drug Release from Delivery Systems Occupy the Largest Share of the Long-Acting Drug Delivery Technologies and Services Market
Based on the principle, the market is segmented into manipulation of drug release from delivery systems and manipulation of in vivo clearance. At present, manipulation of drug release from delivery systems segment holds the maximum share of the long-acting drug delivery technologies and services market. This trend is unlikely to change in the near future.
Micro-Encapsulation is Likely to Dominate the Long-Acting Drug Delivery Technologies and Services Market During the Forecast Period
Based on the strategy, the market is segmented into chemical modification, micro-encapsulation, long-acting hydrogels, long acting implants, long acting microneedles, multivesicular liposomes, nanocrystal suspensions and protein fusion. Currently, micro-encapsulation holds the maximum share of the long-acting drug delivery technologies and services market. This trend is unlikely to change in the near future. Further, the long-acting drug delivery technologies and services market for long-acting microneedles is likely to grow at a relatively higher CAGR.
Long Acting Injectables Occupy the Largest Share of the Long-Acting Drug Delivery Technologies and Services Market
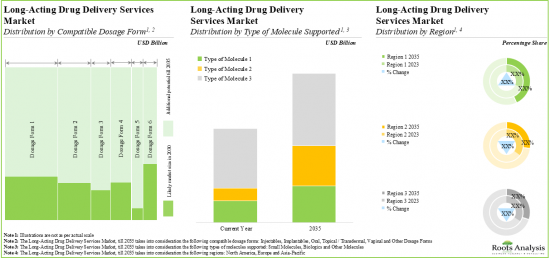
Based on the compatible dosage form, the market is segmented into long acting injectables, long acting implantable, long-acting orals, long acting topicals / transdermals and other dosage forms. At present, long-acting injectables captures the highest share of the long-acting drug delivery technologies and services market. It is worth highlighting that long-acting drug delivery technologies and services market for implantable is likely to grow at relatively higher CAGR.
Small Molecules are the Fastest Growing Segment of the Long-Acting Drug Delivery Technologies and Services Market During the Forecast Period
Based on the type of molecules delivered, the market is segmented into small molecules, biologics and other molecules. It is worth highlighting that, currently, small molecules hold a larger portion of the long-acting drug delivery technologies and services market. This trend is likely to remain the same in the coming decade.
Polymer based Materials are likely to Dominate the Long-Acting Drug Delivery Technologies and Services Market During the Forecast Period
Based on the type of material used, the market is segmented into polymer-based materials and non-polymer based materials. It is worth highlighting that majority of the current long-acting drug delivery technologies and services market is captured by the polymer-based materials.
North America Accounts for the Largest Share of the Market
Based on key geographical regions, the market is segmented into North America, Europe, Asia-Pacific, and Middle East and North Africa. The majority of the share is expected to be captured by players based in North America and Europe. It is worth highlighting that, over the years, the market in Europe is expected to grow at a higher CAGR.
Example Players in the Long-Acting Drug Delivery Technologies and Services Market
- Adare Pharma Solutions
- AMW
- Bostal Drug Delivery
- Creative Biolabs
- ForDoz Pharma
- Innocore Pharmaceuticals
- Integral BioSystems
- LATITUDE Pharmaceuticals
- Navin Saxena Research and Technology Centre (NSRT)
- Samyang Biopharm
LONG-ACTING DRUG DELIVERY TECHNOLOGIES AND SERVICES MARKET: RESEARCH COVERAGE
- Market Sizing and Opportunity Analysis: The report features an in-depth analysis of the long-acting drug delivery technologies and services market, focusing on key market segments, including [A] principle, [B] strategy, [C] compatible dosage form, [D] type of molecule delivered, [E] type of material used and [F] key geographical regions.
- Market Landscape 1: A comprehensive evaluation of long-acting drug delivery technologies, considering various parameters, such as [A] principle, [B] strategy, [C] type of material used, [D] compatible dosage form(s), [E] extended dosing interval(s), [F] type of molecule(s) delivered, [G] highest phase of development, [H] number of approved drugs and [I] therapeutic area(s). Additionally, the chapter includes information on various technology developers, along with analysis based on multiple parameters, such as their [K] year of establishment, [L] company size, [M] location of headquarters and [N] most active players (in terms of number of technologies developed).
- Market Landscape 2: A comprehensive evaluation of contract service providers engaged in the long-acting drug delivery technologies and services market, considering various parameters, such as [A] year of establishment, [B] company size (in terms of number of employees), [C] location of headquarters, [D] location of facilities, [E] type of service provider(s), [F] scale of operation, [G] compatible dosage form(s), [H] service(s) offered and [I] type of molecule(s) supported.
- Technology Competitiveness Analysis: A comprehensive competitive analysis of long-acting drugs delivery technologies, examining factors, such as [A] developer power and [B] technology strength.
- Company Competitiveness Analysis: A comprehensive competitive analysis of long-acting drugs delivery service providers, examining factors, such as [A] company strength and [B] service strength.
- Company Profiles: In-depth profiles of key industry players offering technologies and offering services in the field of long-acting drugs delivery, focusing on [A] company overviews, [B] technology portfolio, [C] service portfolio, [D] recent developments and [E] an informed future outlook.
- Partnerships and Collaborations: An analysis of partnerships established in this sector, since 2018, covering acquisitions, manufacturing agreements, product development and commercialization agreements, service alliance, technology licensing agreements, and other relevant agreements.
- Publication Analysis: A detailed analysis of over 570 peer-reviewed, scientific articles focused on research related to long acting drugs delivery, based on several relevant parameters, such as [A] year of publication, [B] type of publication, [C] popular keywords, [D] top journals, [E] top publishers, [F] top copyright holders and [G] key funding institutes (in terms of number of articles published).
- Patent Analysis: Detailed analysis of various patents filed / granted related to long-acting drug delivery based on [A] publication year, [B] geographical region, [C] CPC symbols, [D] leading players (in terms of number of patents filled / granted) and [E] type of organization. It also includes a patent benchmarking analysis and a detailed valuation analysis.
- Grant Analysis: A comprehensive evaluation of various grants that have been awarded to research institutes engaged in conducting research related to long-acting drug delivery, since 2018, based on various important parameters, such as [A] year of grant award, [B] amount awarded, [C] support period, [D] type of funding institute center, [E] type of grant application, [F] purpose of grant award, [G] activity code, [H] NIH spending category, [I] study section involved, [J] popular NIH departments (in terms of number of grants), [K] type of recipient organization, [L] prominent program officers (in terms of number of grants) and [M] popular recipient organizations (in terms of number of grants and amount awarded).
KEY QUESTIONS ANSWERED IN THIS REPORT
- How many companies are currently engaged in this market?
- Which are the leading companies in this market?
- What kind of partnership models are commonly adopted by industry stakeholders?
- What factors are likely to influence the evolution of this market?
- What is the current and future market size?
- What is the CAGR of this market?
- How is the current and future market opportunity likely to be distributed across key market segments?
REASONS TO BUY THIS REPORT
- The report provides a comprehensive market analysis, offering detailed revenue projections of the overall market and its specific sub-segments. This information is valuable to both established market leaders and emerging entrants.
- Stakeholders can leverage the report to gain a deeper understanding of the competitive dynamics within the market. By analyzing the competitive landscape, businesses can make informed decisions to optimize their market positioning and develop effective go-to-market strategies.
- The report offers stakeholders a comprehensive overview of the market, including key drivers, barriers, opportunities, and challenges. This information empowers stakeholders to stay abreast of market trends and make data-driven decisions to capitalize on growth prospects.
ADDITIONAL BENEFITS
- Complimentary PPT Insights Packs
- Complimentary Excel Data Packs for all Analytical Modules in the Report
- 10% Free Content Customization
- Detailed Report Walkthrough Session with Research Team
- Free Updated report if the report is 6-12 months old or older
TABLE OF CONTENTS
1. PREFACE
- 1.1. Introduction
- 1.2. Key Market Insights
- 1.3. Scope of the Report
- 1.4. Research Methodology
- 1.5. Frequently Asked Questions
- 1.6. Chapter Outlines
2. EXECUTIVE SUMMARY
3. INTRODUCTION
- 3.1. Chapter Overview
- 3.2. Overview of Long-Acting Drug Delivery
- 3.2.1. Types of Long-Acting Drug Delivery Systems
- 3.3. Long-Acting Drug Delivery Technologies
- 3.3.1. Underlying Principle
- 3.3.2. Associated Strategies
- 3.4. Concluding Remarks
4. TECHNOLOGY LANDSCAPE
- 4.1. Chapter Overview
- 4.2. Long-Acting Drug Delivery: Technology Landscape
- 4.2.1. Analysis by Principle
- 4.2.2. Analysis by Strategy
- 4.2.3. Analysis by Type of Material Used
- 4.2.4. Analysis by Compatible Dosage Form(s)
- 4.2.5. Analysis by Extended Dosing Interval(s)
- 4.2.6. Analysis by Type of Molecule(s) Delivered
- 4.2.7. Analysis by Highest Phase of Development
- 4.2.8. Analysis by Number of Approved Drugs
- 4.2.9. Analysis by Therapeutic Area(s)
- 4.3. Long-Acting Drug Delivery: Technology Developers Landscape
- 4.3.1. Analysis by Year of Establishment
- 4.3.2. Analysis by Company Size
- 4.3.3. Analysis by Location of Headquarters
- 4.3.4. Most Active Players: Analysis by Number of Technologies
5. SERVICE PROVIDERS LANDSCAPE
- 5.1. Chapter Overview
- 5.2. Long-Acting Drug Delivery: Service Providers Landscape
- 5.2.1. Analysis by Year of Establishment
- 5.2.2. Analysis by Company Size
- 5.2.3. Analysis by Location of Headquarters
- 5.2.4. Analysis by Company Size and Location of Headquarters
- 5.2.5. Analysis by Location of Facilities
- 5.2.6. Analysis by Type of Service Provider(s)
- 5.2.7. Analysis by Scale of Operation
- 5.2.8. Analysis by Compatible Dosage Form(s)
- 5.2.9. Analysis by Scale of Operation and Compatible Dosage Form(s)
- 5.2.10. Analysis by Service(s) Offered
- 5.2.11. Analysis by Company Size and Service(s) Offered
- 5.2.12. Analysis by Year of Establishment, Location of Headquarters and Service(s) Offered
- 5.2.13. Analysis by Type of Molecule(s) Supported
- 5.2.14. Analysis by Type of Service Provider(s) and Type of Molecule(s) Supported
6. TECHNOLOGY COMPETITIVENESS ANALYSIS
- 6.1. Chapter Overview
- 6.2. Assumptions / Key Parameters
- 6.3. Methodology
- 6.4. Technology Competitiveness Analysis
- 6.4.1. Long-Acting Drug Delivery Technologies Offered by Small Companies
- 6.4.2. Long-Acting Drug Delivery Technologies Offered by Mid-sized Companies
- 6.4.3. Long-Acting Drug Delivery Technologies Offered by Large Companies
- 6.4.4. Long-Acting Drug Delivery Technologies Offered by Very Large Companies
7. COMPANY COMPETITIVENESS ANALYSIS
- 7.1. Chapter Overview
- 7.2. Assumptions / Key Parameters
- 7.3. Methodology
- 7.4. Company Competitiveness Analysis
- 7.4.1. Long-Acting Drug Delivery Service Providers based in North America
- 7.4.2. Long-Acting Drug Delivery Service Providers based in Europe
- 7.4.3. Long-Acting Drug Delivery Service Providers based in Asia-Pacific
8. COMPANY PROFILES
- 8.1. Chapter Overview
- 8.2. Adare Pharma Solutions
- 8.2.1. Company Overview
- 8.2.2. Technology Portfolio
- 8.2.3. Service Portfolio
- 8.2.4. Recent Developments and Future Outlook
- 8.3. AMW
- 8.3.1. Company Overview
- 8.3.2. Technology Portfolio
- 8.3.3. Service Portfolio
- 8.3.4. Recent Developments and Future Outlook
- 8.4. Bostal Drug Delivery
- 8.4.1. Company Overview
- 8.4.2. Technology Portfolio
- 8.4.3. Service Portfolio
- 8.4.4. Recent Developments and Future Outlook
- 8.5. Creative Biolabs
- 8.5.1. Company Overview
- 8.5.2. Technology Portfolio
- 8.5.3. Service Portfolio
- 8.5.4. Recent Developments and Future Outlook
- 8.6. ForDoz Pharma
- 8.6.1. Company Overview
- 8.6.2. Technology Portfolio
- 8.6.3. Service Portfolio
- 8.6.4. Recent Developments and Future Outlook
- 8.7. InnoCore Pharmaceuticals
- 8.7.1. Company Overview
- 8.7.2. Technology Portfolio
- 8.7.3. Service Portfolio
- 8.7.4. Recent Developments and Future Outlook
- 8.8. Integral BioSystems
- 8.8.1. Company Overview
- 8.8.2. Technology Portfolio
- 8.8.3. Service Portfolio
- 8.8.4. Recent Developments and Future Outlook
- 8.9. LATITUDE Pharmaceuticals
- 8.9.1. Company Overview
- 8.9.2. Technology Portfolio
- 8.9.3. Service Portfolio
- 8.9.4. Recent Developments and Future Outlook
- 8.10. Navin Saxena Research and Technology Centre (NSRT)
- 8.10.1. Company Overview
- 8.10.2. Technology Portfolio
- 8.10.3. Service Portfolio
- 8.10.4. Recent Developments and Future Outlook
- 8.11. Samyang Biopharm
- 8.11.1. Company Overview
- 8.11.2. Technology Portfolio
- 8.11.3. Service Portfolio
- 8.11.4. Recent Developments and Future Outlook
9. PARTNERSHIPS AND COLLABORATIONS
- 9.1. Chapter Overview
- 9.2. Partnership Models
- 9.3. Long-Acting Drug Delivery Technologies and Services: Partnerships and Collaborations
- 9.3.1. Analysis by Year of Partnership
- 9.3.2. Analysis by Type of Partnership
- 9.3.3. Analysis by Year and Type of Partnership
- 9.3.4. Analysis by Type of Partner
- 9.3.5. Analysis by Location of Headquarters of Partner
- 9.3.6. Analysis by Type of Partnership and Location of Headquarters of Partner
- 9.3.7. Most Active Players: Analysis by Number of Partnerships
- 9.3.8. Analysis by Region
- 9.3.8.1. Intercontinental and Intracontinental Deals
- 9.3.8.2. Local and International Deals
10. PUBLICATION ANALYSIS
- 10.1. Chapter Overview
- 10.2. Scope and Methodology
- 10.3. Long-Acting Drug Delivery: Publication Analysis
- 10.3.1. Analysis by Year of Publication
- 10.3.2. Analysis by Type of Publication
- 10.3.3. Analysis by Most Popular Keywords
- 10.3.4. Most Popular Journals: Analysis by Number of Publications
- 10.3.5. Most Popular Publishers: Analysis by Number of Publications
- 10.3.6. Most Popular Copyright Holders: Analysis by Number of Publications
- 10.3.7. Key Funding Institutes: Analysis by Number of Publications
11. PATENT ANALYSIS
- 11.1. Chapter Overview
- 11.2. Scope and Methodology
- 11.3. Long-Acting Drug Delivery: Patent Analysis
- 11.3.1. Analysis by Publication Year
- 11.3.2. Analysis by Type of Patent and Publication Year
- 11.3.3. Analysis by Geography
- 11.3.4. Analysis by CPC Symbols
- 11.3.5. Leading Industry Players: Analysis by Number of Patents
- 11.3.6. Analysis by Type of Organization
- 11.4. Patent Benchmark Analysis
- 11.4.1. Analysis by Patent Characteristics
- 11.5. Patent Valuation Analysis
12. GRANT ANALYSIS
- 12.1. Chapter Overview
- 12.2. Scope and Methodology
- 12.3. Long-Acting Drug Delivery: Grant Analysis
- 12.3.1. Analysis by Year of Grant Awarded
- 12.3.2. Analysis by Amount Awarded
- 12.3.3. Analysis by Support Period
- 12.3.4. Analysis by Support Period and Funding Institute Center
- 12.3.5. Analysis by Type of Grant Application
- 12.3.6. Analysis by Purpose of Grant
- 12.3.7. Analysis By Activity Code
- 12.3.8. Analysis by NIH Spending Category
- 12.3.9. Analysis by Study Section Involved
- 12.3.10. Popular NIH Departments: Analysis by Number of Grants
- 12.3.11. Analysis by Type of Recipient Organization
- 12.3.12. Prominent Program Officers: Analysis by Number of Grants
- 12.3.13. Popular Recipient Organizations: Analysis by Number of Grants
- 12.3.14. Popular Recipient Organizations: Analysis by Grant Amount
- 12.3.15. Analysis by Region of Recipient Organizations
13. MARKET FORECAST AND OPPORTUNITY ANALYSIS
- 13.1. Chapter Overview
- 13.2. Key Assumptions and Forecast Methodology
- 13.3. Global Long-Acting Drug Delivery Technologies Market, till 2035
- 13.3.1. Long-Acting Drug Delivery Technologies Market: Analysis by Type of Payment Model Employed
- 13.3.1.1. Long-Acting Drug Delivery Technologies Market for Upfront Payment, till 2035
- 13.3.1.2. Long-Acting Drug Delivery Technologies Market for Milestone Payment, till 2035
- 13.3.2. Long-Acting Drug Delivery Technologies Market: Analysis by Principle
- 13.3.2.1. Long-Acting Drug Delivery Technologies Market for Manipulation of Drug Release from Delivery Systems, till 2035
- 13.3.2.2. Long-Acting Drug Delivery Technologies Market for Manipulation of In Vivo Clearance, till 2035
- 13.3.3. Long-Acting Drug Delivery Technologies Market: Analysis by Strategy
- 13.3.3.1. Long-Acting Drug Delivery Technologies Market for Micro-encapsulation, till 2035
- 13.3.3.2. Long-Acting Drug Delivery Technologies Market for Long-Acting Implants, till 2035
- 13.3.3.3. Long-Acting Drug Delivery Technologies Market for Multivesicular Liposomes, till 2035
- 13.3.3.4. Long-Acting Drug Delivery Technologies Market for Nanocrystal Suspensions, till 2035
- 13.3.3.5. Long-Acting Drug Delivery Technologies Market for Long-Acting Hydrogels, till 2035
- 13.3.3.6. Long-Acting Drug Delivery Technologies Market for Long-Acting Microneedles, till 2035
- 13.3.3.7. Long-Acting Drug Delivery Technologies Market for Chemical Modification, till 2035
- 13.3.3.8. Long-Acting Drug Delivery Technologies Market for Protein Fusion, till 2035
- 13.3.4. Long-Acting Drug Delivery Technologies Market: Analysis by Compatible Dosage Form
- 13.3.4.1. Long-Acting Drug Delivery Technologies Market for Injectables, till 2035
- 13.3.4.2. Long-Acting Drug Delivery Technologies Market for Implantables, till 2035
- 13.3.4.3. Long-Acting Drug Delivery Technologies Market for Vaginal Dosage Forms, till 2035
- 13.3.4.4. Long-Acting Drug Delivery Technologies Market for Topical / Transdermal Dosage Forms, till 2035
- 13.3.4.5. Long-Acting Drug Delivery Technologies Market for Oral Dosage Forms, till 2035
- 13.3.4.6. Long-Acting Drug Delivery Technologies Market for Other Dosage Forms, till 2035
- 13.3.5. Long-Acting Drug Delivery Technologies Market: Analysis by Type of Molecule Delivered
- 13.3.5.1. Long-Acting Drug Delivery Technologies Market for Small Molecules, till 2035
- 13.3.5.2. Long-Acting Drug Delivery Technologies Market for Biologics, till 2035
- 13.3.5.3. Long-Acting Drug Delivery Technologies Market for Other Molecules, till 2035
- 13.3.6. Long-Acting Drug Delivery Technologies Market: Analysis by Type of Material Used
- 13.3.6.1. Long-Acting Drug Delivery Technologies Market for Polymer-based Material, till 2035
- 13.3.6.2. Long-Acting Drug Delivery Technologies Market for Non-polymer based Material, till 2035
- 13.3.7. Long-Acting Drug Delivery Technologies Market: Analysis by Region
- 13.3.7.1. Long-Acting Drug Delivery Technologies Market in North America, till 2035
- 13.3.7.2. Long-Acting Drug Delivery Technologies Market in Europe, till 2035
- 13.3.7.3. Long-Acting Drug Delivery Technologies Market in Asia-Pacific, till 2035
- 13.3.7.4. Long-Acting Drug Delivery Technologies Market in Middle East and North Africa, till 2035
- 13.3.1. Long-Acting Drug Delivery Technologies Market: Analysis by Type of Payment Model Employed
- 13.4. Global Long-Acting Drug Delivery Services Market, till 2035
- 13.4.1. Long-Acting Drug Delivery Services Market: Analysis by Compatible Dosage Form
- 13.4.1.1. Long-Acting Drug Delivery Services Market for Injectables, till 2035
- 13.4.1.2. Long-Acting Drug Delivery Services Market for Implantables, till 2035
- 13.4.1.3. Long-Acting Drug Delivery Services Market for Vaginal Dosage Forms, till 2035
- 13.4.1.4. Long-Acting Drug Delivery Services Market for Topical / Transdermal Dosage Forms, till 2035
- 13.4.1.5. Long-Acting Drug Delivery Services Market for Oral Dosage Forms, till 2035
- 13.4.1.6. Long-Acting Drug Delivery Services Market for Other Dosage Forms, till 2035
- 13.4.2. Long-Acting Drug Delivery Services Market: Analysis by Type of Molecule Supported
- 13.4.2.1. Long-Acting Drug Delivery Services Market for Small Molecules, till 2035
- 13.4.2.2. Long-Acting Drug Delivery Services Market for Biologics, till 2035
- 13.4.2.3. Long-Acting Drug Delivery Services Market for Other Molecules, till 2035
- 13.4.3. Long-Acting Drug Delivery Services Market: Analysis by Region
- 13.4.3.1. Long-Acting Drug Delivery Services Market in North America, till 2035
- 13.4.3.2. Long-Acting Drug Delivery Services Market in Europe, till 2035
- 13.4.3.3. Long-Acting Drug Delivery Services Market in Asia-Pacific, till 2035
- 13.4.1. Long-Acting Drug Delivery Services Market: Analysis by Compatible Dosage Form
14. CONCLUSION
15. INTERVIEW TRANSCRIPTS
16. APPENDIX 1: TABULATED DATA
17. APPENDIX 2: LIST OF COMPANIES AND ORGANIZATIONS
List of Tables
- Table 5.1 Survival on Early Diagnosis of Cancer
- Table 5.2 Cost of Biopsy for Different Cancer Indications (USD)
- Table 5.3 Common Conventional Endoscopic Procedures
- Table 6.1 Examples of Tumor Markers
- Table 7.1 Liquid Biopsy Products: Overall Market Landscape
- Table 7.2 Liquid Biopsy Products: Information on Type of Circulating Biomarker, Target Disease Indication and Type of Tumor
- Table 7.3 Liquid Biopsy Products: Information on Application, Application Area, Availability of Proprietary Technology and Availability of Artificial Intelligence
- Table 7.4 Liquid Biopsy Products: List of Manufacturers
- Table 7.5 Liquid Biopsy Products: List of Other Liquid Biopsy Products
- Table 7.6 Liquid Biopsy Products: List of Other Kits and Consumables
- Table 7.7 Liquid Biopsy Products: List of Contract Service Providers
- Table 8.1 Liquid Biopsy Manufactures: List of Companies Profiled
- Table 8.2 Amoy Diagnostics: Company Snapshot
- Table 8.3 Amoy Diagnostics: Liquid Biopsy Product Portfolio
- Table 8.4 Amoy Diagnostics: Recent Developments and Future Outlook
- Table 8.5 DiaCarta: Company Snapshot
- Table 8.6 DiaCarta: Liquid Biopsy Product Portfolio
- Table 8.7 Integrated DNA Technologies: Company Snapshot
- Table 8.8 Integrated DNA Technologies: Liquid Biopsy Product Portfolio
- Table 8.9 Integrated DNA Technologies: Recent Developments and Future Outlook
- Table 8.10 MDNA Life Sciences: Company Snapshot
- Table 8.11 MDNA Life Sciences: Liquid Biopsy Product Portfolio
- Table 8.12 NeoGenomics: Company Snapshot
- Table 8.13 NeoGenomics: Liquid Biopsy Product Portfolio
- Table 8.14 NeoGenomics: Recent Developments and Future Outlook
- Table 8.15 ONCODE Scientific: Company Snapshot
- Table 8.16 ONCODE Scientific: Liquid Biopsy Product Portfolio
- Table 8.17 QIAGEN: Company Snapshot
- Table 8.18 QIAGEN: Liquid Biopsy Product Portfolio
- Table 8.19 ScreenCell: Company Snapshot
- Table 8.20 ScreenCell: Liquid Biopsy Product Portfolio
- Table 8.21 Thermo Fisher Scientific: Company Snapshot
- Table 8.22 Thermo Fisher Scientific: Liquid Biopsy Product Portfolio
- Table 8.23 Thermo Fisher Scientific: Recent Developments and Future Outlook
- Table 8.24 Biocartis: Company Snapshot
- Table 8.25 Biocartis: Liquid Biopsy Product Portfolio
- Table 8.26 CellMax Life: Company Snapshot
- Table 8.27 CellMax Life: Liquid Biopsy Product Portfolio
- Table 8.28 Datar Cancer Genetics: Company Snapshot
- Table 8.29 Datar Cancer Genetics: Liquid Biopsy Product Portfolio
- Table 8.30 EONE-DIAGNOMICS: Company Snapshot
- Table 8.31 EONE-DIAGNOMICS: Liquid Biopsy Product Portfolio
- Table 8.32 Exosome Diagnostics: Company Snapshot
- Table 8.33 Exosome Diagnostics: Liquid Biopsy Product Portfolio
- Table 8.34 GeneCast Biotechnology: Company Snapshot
- Table 8.35 GeneCast Biotechnology: Liquid Biopsy Product Portfolio
- Table 8.36 Helio Genomics: Company Snapshot
- Table 8.37 Helio Genomics: Liquid Biopsy Product Portfolio
- Table 8.38 Lucence: Company Snapshot
- Table 8.39 Lucence: Liquid Biopsy Product Portfolio
- Table 8.40 Miltenyi Biotec: Company Snapshot
- Table 8.41 Miltenyi Biotec: Liquid Biopsy Product Portfolio
- Table 8.42 OncoDNA: Company Snapshot
- Table 8.43 OncoDNA: Liquid Biopsy Product Portfolio
- Table 8.44 PANAGENE: Company Snapshot
- Table 8.45 PANAGENE: Liquid Biopsy Product Portfolio
- Table 8.46 Personal Genome Diagnostics: Company Snapshot
- Table 8.47 Personal Genome Diagnostics: Liquid Biopsy Product Portfolio
- Table 8.48 Roche Diagnostics: Company Snapshot
- Table 8.49 Roche Diagnostics: Liquid Biopsy Product Portfolio
- Table 8.50 Tecan: Company Snapshot
- Table 8.51 Tecan: Liquid Biopsy Product Portfolio
- Table 9.1 Liquid Biopsy Market: List of Partnerships and Collaborations
- Table 9.2 Liquid Biopsy: Partnerships and Collaborations: Information on Type of Circulating Biomarker, Target Disease Indication, Type of Agreement (Country and Region)
- Table 10.1 Liquid Biopsy Market: List of Funding and Investments
- Table 11.1 Product Competitiveness Analysis: Information on Peer Groups
- Table 12.1 Liquid Biopsy: List of Key Acquisitions
- Table 12.2 Potential Strategic Acquisition Targets in North America
- Table 12.3 Potential Strategic Acquisition Targets in Europe
- Table 12.4 Potential Strategic Acquisition Targets in Asia-Pacific / Rest of the World
- Table 14.1 List of Other Non-Invasive Cancer Diagnostics
- Table 24.1 Survey Insights: Overview of Respondents
- Table 24.2 Survey Insights: Designation and Seniority Levels
- Table 24.3 Survey Insights: Type of Liquid Biopsy Product Portfolio
- Table 24.4 Survey Insights: Type of Products / Services Offered
- Table 24.5 Survey Insights: Stage of Development of the Products
- Table 24.6 Survey Insights: Application Area
- Table 24.7 Survey Insights: Likely Liquid Biopsy Market Size (2035)
- Table 24.8 Survey Insights: Likely Other Non-Invasive Cancer Diagnostics Market Size
- Table 27.1 Worldwide Incidence of Cancer: Distribution by Target Indication
- Table 27.2 Breast Cancer: Estimated New Cases (in Thousands)
- Table 27.3 Lung Cancer: Estimated New Cases (in Thousands)
- Table 27.4 Colorectal Cancer: Estimated New Cases (in Thousands)
- Table 27.5 Liquid Biopsy Products: Distribution by Stage of Development
- Table 27.6 Liquid Biopsy Products: Distribution by Type of Product
- Table 27.7 Liquid Biopsy Products: Distribution by Type of Sample
- Table 27.8 Liquid Biopsy Products: Distribution by Type of Technique
- Table 27.9 Liquid Biopsy Products: Distribution by Type of Circulating Biomarker
- Table 27.10 Liquid Biopsy Products: Distribution by Target Disease Indication
- Table 27.11 Liquid Biopsy Products: Distribution by Type of Tumor
- Table 27.12 Liquid Biopsy Products: Distribution by Application
- Table 27.13 Liquid Biopsy Products: Distribution by Application Area
- Table 27.14 Liquid Biopsy Manufacturers: Distribution by Year of Establishment
- Table 27.15 Liquid Biopsy Manufacturers: Distribution by Company Size
- Table 27.16. Liquid Biopsy Manufacturers: Distribution by Location of Headquarters (Region)
- Table 27.17 Liquid Biopsy Manufacturers: Distribution by Location of Headquarters (Country)
- Table 27.18 Most Active Players: Distribution by Number of Liquid Biopsy Products
- Table 27.19 NeoGenomics: Annual Revenues, FY 2018 Onwards (USD Million)
- Table 27.20 Thermo Fisher Scientific: Annual Revenues, FY 2018 Onwards (USD Billion)
- Table 27.21 Partnerships and Collaborations: Cumulative Year-wise Trend, since 2019
- Table 27.22 Partnerships and Collaborations: Distribution by Type of Partnership
- Table 27.23 Partnerships and Collaborations: Distribution by Year and Type of Partnership, since 2020
- Table 27.24 Partnerships and Collaborations: Distribution by Purpose of Agreement
- Table 27.25 Partnerships and Collaborations: Distribution by Type of Partner
- Table 27.26 Partnerships and Collaborations: Distribution by Year of Partnership and Type of Partner, since 2019
- Table 27.27 Partnerships and Collaborations: Distribution by Type of Circulating Biomarker
- Table 27.28 Partnerships and Collaborations: Distribution by Type of Target Disease Indication
- Table 27.29 Most Active Players: Distribution by Number of Partnerships
- Table 27.30 Partnerships and Collaborations: Local and International Agreements
- Table 27.31 Funding and Investment Analysis: Cumulative Year-wise Distribution of Funding Instances, since 2015
- Table 27.32 Funding and Investment Analysis: Cumulative Year-wise Distribution by Amount Invested, since 2015 (USD Million)
- Table 27.33 Funding and Investment Analysis: Distribution by Type of Funding
- Table 27.34. Funding and Investment Analysis: Distribution of Amount Invested by Type of Funding (USD Million)
- Table 27.35 Funding and Investment Analysis: Distribution by Type of Circulating Biomarker
- Table 27.37 Funding and Investment Analysis: Distribution by Application
- Table 27.38 Most Active Players: Distribution by Number of Funding Instances
- Table 27.39 Most Active Players: Distribution by Amount Raised
- Table 27.40 Most Active Investors: Distribution by Number of Instances
- Table 27.41 Liquid Biopsy Manufacturers: Distribution by Location of Headquarters (Region)
- Table 27.42 Global Liquid Biopsy Market, Historical Trends (since 2018) and Forecasted Estimates (till 2035) (USD Billion)
- Table 27.43 Global Liquid Biopsy Market, Forecasted Estimates (till 2035) (USD Billion), Conservative Scenario (USD Billion)
- Table 27.44 Global Liquid Biopsy Market, Forecasted Estimates (till 2035) (USD Billion), Optimistic Scenario (USD Billion)
- Table 27.45 Global Liquid Biopsy Market: Distribution by Application, 2018, 2023 and 2035
- Table 27.46 Liquid Biopsy Market for Early Cancer Diagnosis: Historical Trends (since 2018) and Forecasted Estimates (till 2035)
- Table 27.47 Liquid Biopsy Market for Patient Monitoring: Historical Trends (since 2018) and Forecasted Estimates (till 2035)
- Table 27.48 Liquid Biopsy Market for Recurrence Monitoring: Historical Trends (since 2018) and Forecasted Estimates (till 2035)
- Table 27.49 Global Liquid Biopsy Market: Distribution by Target Disease Indication, 2018, 2023 and 2035
- Table 27.50 Liquid Biopsy Market for Breast Cancer: Historical Trends (since 2018) and Forecasted Estimates (till 2035)
- Table 27.51 Liquid Biopsy Market for Colorectal Cancer: Historical Trends (since 2018) and Forecasted Estimates (till 2035)
- Table 27.52 Liquid Biopsy Market for Prostate Cancer: Historical Trends (since 2018) and Forecasted Estimates (till 2035)
- Table 27.53 Liquid Biopsy Market for Bladder Cancer: Historical Trends (since 2018) and Forecasted Estimates (till 2035)
- Table 27.54 Liquid Biopsy Market for Lung Cancer: Historical Trends (since 2018) and Forecasted Estimates (till 2035)
- Table 27.55 Liquid Biopsy Market for Gastric Cancer: Historical Trends (since 2018) and Forecasted Estimates (till 2035)
- Table 27.56 Liquid Biopsy Market for Thyroid Cancer: Historical Trends (since 2018) and Forecasted Estimates (till 2035)
- Table 27.57 Liquid Biopsy Market for Head and Neck Cancer: Historical Trends (since 2018) and Forecasted Estimates (till 2035)
- Table 27.58 Liquid Biopsy Market for Melanoma Cancer: Historical Trends (since 2018) and Forecasted Estimates (till 2035)
- Table 27.59 Liquid Biopsy Market for Leukemia Cancer: Historical Trends (since 2018) and Forecasted Estimates (till 2035)
- Table 27.60 Liquid Biopsy Market for Liver Cancer: Historical Trends (since 2018) and Forecasted Estimates (till 2035)
- Table 27.61 Liquid Biopsy Market for Cervical: Historical Trends (since 2018) and Forecasted Estimates (till 2035)
- Table 27.62 Liquid Biopsy Market for Ovarian Cancer: Historical Trends (since 2018) and Forecasted Estimates (till 2035)
- Table 27.63 Liquid Biopsy Market for Pancreatic Cancer: Historical Trends (since 2018) and Forecasted Estimates (till 2035)
- Table 27.64 Liquid Biopsy Market for Brain Cancer: Historical Trends (since 2018) and Forecasted Estimates (till 2035)
- Table 27.65 Liquid Biopsy Market for Esophagus Cancer: Historical Trends (since 2018) and Forecasted Estimates (till 2035)
- Table 27.66 Liquid Biopsy Market for Nasopharyngeal: Historical Trends (since 2018) and Forecasted Estimates (till 2035)
- Table 27.67 Liquid Biopsy Market for Sarcoma Cancer: Historical Trends (since 2018) and Forecasted Estimates (till 2035)
- Table 27.68 Liquid Biopsy Market: Distribution by Type of Circulating Biomarker, 2018, 2023 and 2035
- Table 27.69 Liquid Biopsy Market for Circulating Tumor DNA: Historical Trends (since 2018) and Forecasted Estimates (till 2035)
- Table 27.70 Liquid Biopsy Market for Cell Free DNA: Historical Trends (since 2018) and Forecasted Estimates (till 2035)
- Table 27.71 Liquid Biopsy Market for Cell Free RNA: Historical Trends (since 2018) and Forecasted Estimates (till 2035)
- Table 27.72 Liquid Biopsy Market for Exosomes: Historical Trends (since 2018) and Forecasted Estimates
- Table 27.73 Liquid Biopsy Market for Other Circulating Biomarkers: Historical Trends (since 2018) and Forecasted Estimates
- Table 27.74 Liquid Biopsy Market: Distribution by Type of Sample, 2018, 2023 and 2035
- Table 27.75 Liquid Biopsy Market for Blood / Plasma Samples: Historical Trends (since 2018) and Forecasted Estimates (till 2035)
- Table 27.76 Liquid Biopsy Market for Other Samples: Historical Trends (since 2018) and Forecasted Estimates (till 2035)
- Table 27.77 Liquid Biopsy Market: Distribution by Type of Technique, 2018, 2023 and 2035
- Table 27.78 Liquid Biopsy Market for Polymerase Chain Reaction: Historical Trends (since 2018) and Forecasted Estimates (till 2035) (USD Million)
- Table 27.79 Liquid Biopsy Market for Next Generation Sequencing: Historical Trends (since 2018) and Forecasted Estimates (till 2035) (USD Million)
- Table 27.80 Liquid Biopsy Market: Distribution by End user, 2018, 2023 and 2035
- Table 27.81 Liquid Biopsy Market for Hospitals / Laboratories: Historical Trends (since 2018) and Forecasted Estimates (till 2035)
- Table 27.82 Liquid Biopsy for Research Institutes: Historical Trends (since 2018) and Forecasted Estimates (till 2035)
- Table 27.83 Liquid Biopsy Market for Other End-users: Historical Trends (since 2018) and Forecasted Estimates (till 2035)
- Table 27.84 Liquid Biopsy Market: Distribution by Countries, 2018, 2023 and 2035
- Table 27.85 Liquid Biopsy Market in the US: Historical Trends (since 2018) and Forecasted Estimates (till 2035) (USD Million)
- Table 27.86 Liquid Biopsy Market in the UK: Historical Trends (since 2018) and Forecasted Estimates (till 2035) (USD Million)
- Table 27.87 Liquid Biopsy Market in Germany: Historical Trends (since 2018) and Forecasted Estimates (till 2035) (USD Million)
- Table 27.88 Liquid Biopsy Market in France: Historical Trends (since 2018) and Forecasted Estimates (till 2035) (USD Million)
- Table 27.89 Liquid Biopsy Market in Italy: Historical Trends (since 2018) and Forecasted Estimates (till 2035) (USD Million)
- Table 27.90 Liquid Biopsy Market in Spain: Historical Trends (since 2018) and Forecasted Estimates (till 2035) (USD Million)
- Table 27.91 Liquid Biopsy Market in Australia: Historical Trends (since 2018) and Forecasted Estimates (till 2035) (USD Million)
- Table 27.92 Liquid Biopsy Market in Japan: Historical Trends (since 2018) and Forecasted Estimates (till 2035) (USD Million)
- Table 27.93 Liquid Biopsy Market in China: Historical Trends (since 2018) and Forecasted Estimates (till 2035) (USD Million)
- Table 27.94 Liquid Biopsy Market in India: Historical Trends (since 2018) and Forecasted Estimates (till 2035) (USD Million)
List of Figures
- Figure 2.1 Executive Summary: Technology Landscape
- Figure 2.2 Executive Summary: Service Providers Landscape
- Figure 2.3 Executive Summary: Partnerships and Collaborations
- Figure 2.4 Executive Summary: Publication Analysis
- Figure 2.5 Executive Summary: Patent Analysis
- Figure 2.6 Executive Summary: Grant Analysis
- Figure 2.7 Executive Summary: Market Forecast and Opportunity Analysis (Technology)
- Figure 2.8 Executive Summary: Market Forecast and Opportunity Analysis (Service)
- Figure 3.1 Types of Long-Acting Drug Delivery Systems
- Figure 3.2 Principles and Strategies associated with Long-Acting Drug Delivery
- Figure 4.1 LADD Technologies: Distribution by Principle
- Figure 4.2 LADD Technologies: Distribution by Strategy
- Figure 4.3 LADD Technologies: Distribution by Type of Material Used
- Figure 4.4 LADD Technologies: Distribution by Compatible Dosage Form(s)
- Figure 4.5 LADD Technologies: Distribution by Extended Dosing Interval(s)
- Figure 4.6 LADD Technologies: Distribution by Type of Molecule(s) Delivered
- Figure 4.7 LADD Technologies: Distribution by Highest Phase of Development
- Figure 4.8 LADD Technologies: Distribution by Number of Approved Drugs
- Figure 4.9 LADD Technologies: Distribution by Therapeutic Area(s)
- Figure 4.10 LADD Technology Developers: Distribution by Year of Establishment
- Figure 4.11 LADD Technology Developers: Distribution by Company Size
- Figure 4.12 LADD Technology Developers: Distribution by Location of Headquarters
- Figure 4.13 Most Active Players: Distribution by Number of Technologies
- Figure 5.1 LADD Contract Service Providers: Distribution by Year of Establishment
- Figure 5.2 LADD Contract Service Providers: Distribution by Company Size
- Figure 5.3 LADD Contract Service Providers: Distribution by Location of Headquarters
- Figure 5.4 LADD Contract Service Providers: Distribution by Company Size and Location of Headquarters
- Figure 5.5 LADD Contract Service Providers: Distribution by Location of Facilities
- Figure 5.6 LADD Contract Service Providers: Distribution by Type of Service Provider(s)
- Figure 5.7 LADD Contract Service Providers: Distribution by Scale of Operation
- Figure 5.8 LADD Contract Service Providers: Distribution by Compatible Dosage Form(s)
- Figure 5.9 LADD Contract Service Providers: Distribution by Scale of Operation and Compatible Dosage Form(s)
- Figure 5.10 LADD Contract Service Providers: Distribution by Service(s) Offered
- Figure 5.11 LADD Contract Service Providers: Distribution by Company Size and Service(s) Offered
- Figure 5.12 LADD Contract Service Providers: Distribution by Year of Establishment, Location of Headquarters and Service(s) Offered
- Figure 5.13 LADD Contract Service Providers: Distribution by Type of Molecule(s) Supported
- Figure 5.14 LADD Contract Service Providers: Distribution by Type of Service Provider(s) and Type of Molecule(s) Supported
- Figure 6.1 Technology Competitiveness Analysis: LADD Technologies Offered by Small Companies
- Figure 6.2 Technology Competitiveness Analysis: LADD Technologies Offered by Mid-sized Companies
- Figure 6.3 Technology Competitiveness Analysis: LADD Technologies Offered by Large Companies
- Figure 6.4 Technology Competitiveness Analysis: LADD Technologies Offered by Very Large Companies
- Figure 7.1 Company Competitiveness Analysis: LADD Service Providers based in North America
- Figure 7.2 Company Competitiveness Analysis: LADD Service Providers based in Europe
- Figure 7.3 Company Competitiveness Analysis: LADD Service Providers based in Asia-Pacific
- Figure 8.1 Adare Pharma Solutions: Service Portfolio
- Figure 8.2 AMW: Service Portfolio
- Figure 8.3 Bostal Drug Delivery: Service Portfolio
- Figure 8.4 Creative Biolabs: Service Portfolio
- Figure 8.5 ForDoz Pharma: Service Portfolio
- Figure 8.6 InnoCore Pharmaceuticals: Service Portfolio
- Figure 8.7 Integral BioSystems: Service Portfolio
- Figure 8.8 LATITUDE Pharmaceuticals: Service Portfolio
- Figure 8.9 Navin Saxena Research and Technology Centre (NSRT): Service Portfolio
- Figure 8.10 Samyang Biopharm: Service Portfolio
- Figure 9.1 Partnerships and Collaborations: Cumulative Year-wise Trend, since 2018
- Figure 9.2 Partnerships and Collaborations: Distribution by Type of Partnership
- Figure 9.3 Partnerships and Collaborations: Distribution by Year and Type of Partnership
- Figure 9.4 Partnerships and Collaborations: Distribution by Type of Partner
- Figure 9.5 Partnerships and Collaborations: Distribution by Location of Headquarters of Partner
- Figure 9.6 Partnerships and Collaborations: Distribution by Type of Partnership and Location of Headquarters of Partner
- Figure 9.7 Most Active Players: Distribution by Number of Partnerships
- Figure 9.8 Partnerships and Collaborations: Regional Distribution
- Figure 9.9 Partnerships and Collaborations: Intercontinental and Intracontinental Agreements
- Figure 9.10 Partnerships and Collaborations: Local and International Agreements
- Figure 10.1 Publication Analysis: Cumulative Year-wise Trend, since 2017
- Figure 10.2 Publication Analysis: Distribution by Type of Publication
- Figure 10.3 Most Popular Journals: Distribution by Number of Publications
- Figure 10.4 Most Popular Publishers: Distribution by Number of Publications
- Figure 10.5 Most Popular Copyright Holders: Distribution by Number of Publications
- Figure 10.6 Most Popular Keywords: Distribution by Number of Publications
- Figure 10.7 Key Funding Institutes: Distribution by Number of Publications
- Figure 11.1 Patent Analysis: Distribution by Type of Patent
- Figure 11.2 Patent Analysis: Cumulative Distribution by Publication Year, since 2018
- Figure 11.3 Patent Analysis: Distribution by Type of Patent and Publication Year
- Figure 11.4 Patent Analysis: Distribution by Geography
- Figure 11.5 Patent Analysis: Distribution by CPC Symbols
- Figure 11.6 Leading Industry Players: Distribution by Number of Patents
- Figure 11.7 Patent Analysis: Cumulative Distribution by Type of Organization
- Figure 11.8 Leading Industrial Players: Benchmarking by Patent Characteristics (CPC Codes)
- Figure 11.9 Patent Analysis: Distribution by Patent Age (since 2018)
- Figure 11.10 Patent Analysis: Patent Valuation
- Figure 12.1 Grant Analysis: Cumulative Trend by Year of Grant, since 2018
- Figure 12.2 Grant Analysis: Distribution by Cumulative Amount Awarded (USD Million), since 2018
- Figure 12.3 Grant Analysis: Distribution by Support Period
- Figure 12.4 Grant Analysis: Distribution by Support Period and Funding Institute Center
- Figure 12.5 Grant Analysis: Distribution by Type of Grant Application
- Figure 12.6 Grant Analysis: Distribution by Purpose of Grant
- Figure 12.7 Grant Analysis: Distribution by Activity Code
- Figure 12.8 Word Cloud: NIH Spending Category
- Figure 12.9 Grant Analysis: Distribution by Study Section Involved
- Figure 12.10 Popular NIH Departments: Distribution by Number of Grants
- Figure 12.11 Grant Analysis: Distribution by Type of Recipient Organization
- Figure 12.12 Prominent Program Officers: Distribution by Number of Grants
- Figure 12.13 Popular Recipient Organizations: Distribution by Number of Grants
- Figure 12.14 Popular Recipient Organization: Distribution by Grant Amount (USD Million)
- Figure 12.15 Grant Analysis: Distribution by Region of Recipient Organization
- Figure 13.1 Licensing Agreements: Distribution of Financial Components
- Figure 13.2 Licensing Agreements: Illustrative Scenario based Opportunity Estimation
- Figure 13.3 Global Long-Acting Drug Delivery Technologies Market, till 2035 (USD Billion)
- Figure 13.4 Long-Acting Drug Delivery Technologies Market: Distribution by Type of Payment Model Employed, Current Year and 2035
- Figure 13.5 Long-Acting Drug Delivery Technologies Market for Upfront Payment, till 2035 (USD Million)
- Figure 13.6 Long-Acting Drug Delivery Technologies Market for Milestone Payment, till 2035 (USD Million)
- Figure 13.7 Long-Acting Drug Delivery Technologies Market: Distribution by Principle, Current Year and 2035
- Figure 13.8 Long-Acting Drug Delivery Technologies Market for Manipulation of Drug Release from Delivery Systems, till 2035 (USD Million)
- Figure 13.9 Long-Acting Drug Delivery Technologies Market for Manipulation of In Vivo Clearance, till 2035 (USD Million)
- Figure 13.10 Long-Acting Drug Delivery Technologies Market: Distribution by Strategy, Current Year and 2035
- Figure 13.11 Long-Acting Drug Delivery Technologies Market for Micro-encapsulation, till 2035 (USD Million)
- Figure 13.12 Long-Acting Drug Delivery Technologies Market for Long-Acting Implants, till 2035 (USD Million)
- Figure 13.13 Long-Acting Drug Delivery Technologies Market for Multivesicular Liposomes, till 2035
- Figure 13.14 Long-Acting Drug Delivery Technologies Market for Nanocrystal Suspensions, till 2035 (USD Million)
- Figure 13.15 Long-Acting Drug Delivery Technologies Market for Long-Acting Hydrogels, till 2035 (USD Million)
- Figure 13.16 Long-Acting Drug Delivery Technologies Market for Long-Acting Microneedles, till 2035 (USD Million)
- Figure 13.17 Long-Acting Drug Delivery Technologies Market for Chemical Modification, till 2035 (USD Million)
- Figure 13.18 Long-Acting Drug Delivery Technologies Market for Protein Fusion, till 2035 (USD Million)
- Figure 13.19 Long-Acting Drug Delivery Technologies Market: Distribution by Compatible Dosage Form, Current Year and 2035
- Figure 13.20 Long-Acting Drug Delivery Technologies Market for Injectables, till 2035 (USD Million)
- Figure 13.21 Long-Acting Drug Delivery Technologies Market for Implantables, till 2035 (USD Million)
- Figure 13.22 Long-Acting Drug Delivery Technologies Market for Vaginal Dosage Forms, till 2035 (USD Million)
- Figure 13.23 Long-Acting Drug Delivery Technologies Market for Topical / Transdermal Dosage Forms, till 2035 (USD Million)
- Figure 13.24 Long-Acting Drug Delivery Technologies Market for Oral Dosage Forms, till 2035 (USD Million)
- Figure 13.25 Long-Acting Drug Delivery Technologies Market for Other Dosage Forms, till 2035 (USD Million)
- Figure 13.26 Long-Acting Drug Delivery Technologies Market: Distribution by Type of Molecule Delivered, Current Year and 2035
- Figure 13.27 Long-Acting Drug Delivery Technologies Market for Small Molecules, till 2035 (USD Million)
- Figure 13.28 Long-Acting Drug Delivery Technologies Market for Biologics, till 2035 (USD Million)
- Figure 13.29 Long-Acting Drug Delivery Technologies Market for Other Molecules, till 2035 (USD Million)
- Figure 13.30 Long-Acting Drug Delivery Technologies Market: Distribution by Type of Material Used, Current Year and 2035
- Figure 13.31 Long-Acting Drug Delivery Technologies Market for Polymer based, till 2035 (USD Million)
- Figure 13.32 Long-Acting Drug Delivery Technologies Market for Non-polymer based, till 2035 (USD Million)
- Figure 13.33 Long-Acting Drug Delivery Technologies Market: Distribution by Region, Current Year and 2035
- Figure 13.34 Long-Acting Drug Delivery Technologies Market in North America, till 2035 (USD Million)
- Figure 13.35 Long-Acting Drug Delivery Technologies Market in Europe, till 2035 (USD Million)
- Figure 13.36 Long-Acting Drug Delivery Technologies Market in Asia-Pacific, till 2035 (USD Million)
- Figure 13.37 Long-Acting Drug Delivery Technologies Market in Middle East and North Africa, till 2035 (USD Million)
- Figure 13.38 Global Long-Acting Drug Delivery Services Market, till 2035 (USD Billion)
- Figure 13.39 Long-Acting Drug Delivery Services Market: Distribution by Compatible Dosage Form, Current Year and 2035
- Figure 13.40 Long-Acting Drug Delivery Services Market for Injectables, till 2035
- Figure 13.41 Long-Acting Drug Delivery Services Market for Implantables, till 2035
- Figure 13.42 Long-Acting Drug Delivery Services Market for Vaginal Dosage Forms, till 2035
- Figure 13.43 Long-Acting Drug Delivery Services Market for Topical / Transdermal Dosage Forms, till 2035
- Figure 13.44 Long-Acting Drug Delivery Services Market for Oral Dosage Forms, till 2035
- Figure 13.45 Long-Acting Drug Delivery Services Market for Other Dosage Forms, till 2035
- Figure 13.46 Long-Acting Drug Delivery Services Market: Distribution by Type of Molecule Supported, Current Year and 2035
- Figure 13.47 Long-Acting Drug Delivery Services Market for Small Molecules, till 2035
- Figure 13.48 Long-Acting Drug Delivery Services Market for Biologics, till 2035
- Figure 13.49 Long-Acting Drug Delivery Services Market for Other Molecules, till 2035
- Figure 13.50 Long-Acting Drug Delivery Services Market: Distribution by Region, Current Year and 2035
- Figure 13.51 Long-Acting Drug Delivery Services Market in North America, till 2035
- Figure 13.52 Long-Acting Drug Delivery Services Market in Europe, till 2035
- Figure 13.53 Long-Acting Drug Delivery Services Market in Asia-Pacific, till 2035
- Figure 14.1 Concluding Remarks: Overall Technology Landscape
- Figure 14.2 Concluding Remarks: Overall Service Providers Landscape
- Figure 14.3 Concluding Remarks: Partnerships and Collaborations
- Figure 14.4 Concluding Remarks: Publication Analysis
- Figure 14.5 Concluding Remarks: Patent Analysis
- Figure 14.6 Concluding Remarks: Grant Analysis
- Figure 14.7 Concluding Remarks: Market Forecast and Opportunity Analysis (Technology)
- Figure 14.8 Concluding Remarks: Market Forecast and Opportunity Analysis (Service)

