
PUBLISHER: Roots Analysis | PRODUCT CODE: 1883721

PUBLISHER: Roots Analysis | PRODUCT CODE: 1883721
Cell Therapy Media Market: Industry Trends and Global Forecasts, Till 2035 - Distribution by Type of Product, Type of Cell Therapy, Scale of Operation, Type of End User and Key Geographical Regions
CELL THERAPY MEDIA MARKET: OVERVIEW
As per Roots Analysis, the global cell therapy media market is estimated to grow from USD 1.6 billion in the current year to USD 4.5 billion by 2035, at a CAGR of 11.1% during the forecast period, till 2035.
The market sizing and opportunity analysis has been segmented across the following parameters:
Type of Product
- Culture Media, Kits
- Cell Culture Reagents
- Extracellular Matrices
Type of Cell Therapy
- T-Cell Therapy
- Stem Cell Therapy
- Dendritic Cell Therapy
- NK Cell Therapy
Scale of Operation
- Clinical
- Commercial
Type of End User
- Industry
- Non-Industry
Key Geographical Regions
- North America
- Europe
- Asia-Pacific
- Middle East and North Africa
- Latin America
CELL THERAPY MEDIA MARKET: GROWTH AND TRENDS
Fueled by significant advancements and the established efficacy of FDA-approved cell therapies for treating cancer, rare diseases, and chronic conditions, the cell therapy media market has garnered significant interest from stakeholders in the healthcare sector. Interestingly, over 1,000 clinical trials primarily focused on cell therapies have been registered since 2019. Further, more than 35 cell and gene therapies have been brought to market in different regions around the world. Recent cell therapy approval includes Breyanzi(R), Carvykti(TM), and Abecma(R).
With rising regulatory stringency associated with producing consumables for cell therapy, more than 90% of developers in this field opt to outsource culture media, kits, reagents, and extracellular matrices to suppliers with the required expertise to provide high-quality raw materials. Currently, over 80 companies are providing more than 450 research and / or therapeutic grade raw materials. Moreover, certain companies claim to have GMP-certified facilities for manufacturing consumables intended for various human cells, such as T-cells, stem cells, dendritic cells, and NK cells.
With the ongoing evolution of cell therapy, we expect a rise in innovation and partnerships in the industry, leading to new therapeutic alternatives with the potential to revolutionize patient care and broaden the scope of regenerative medicine.
CELL THERAPY MEDIA MARKET: KEY INSIGHTS
The report delves into the current state of the cell therapy media market and identifies potential growth opportunities within the industry. Some key findings from the report include:
1. Leveraging their expertise, over 450 types of kits, media, reagents and extracellular matrices have been manufactured by consumable providers for research and therapeutic purposes.
2. The market features the presence of over 80 firms across the globe; the majority of these stakeholders are emerging players based in North America.
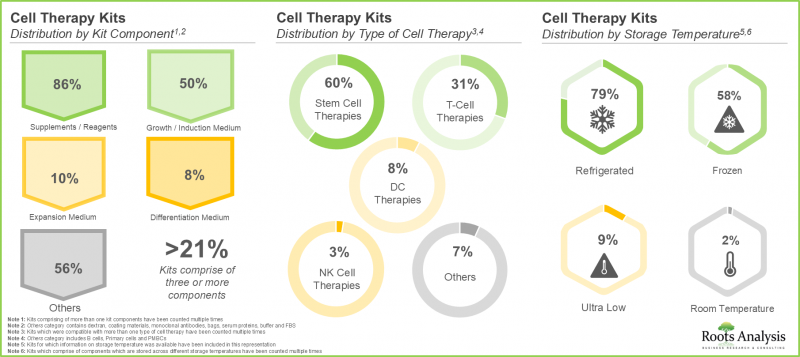
3. A larger proportion of the kits available in the cell therapy domain comprises different types of reagents; of these, 60% are intended for use with stem cell therapies and nearly 80% are stored in refrigerated conditions.
4. Media developers are offering products for a broad range of cell therapies; nearly 90% of such players are providing media in the volume range of 100 to 500 ml.
5. Predominantly, the cell therapy reagents are intended to be used at the discovery scale of operation for a wide spectrum of functions, including cell expansion and proliferation.
6. The market landscape of matrices, which typically have a shelf life of 1 to 1.5 years, is well distributed in terms of type of ECM coating and type of formulation.
7. In pursuit of gaining a competitive edge, cell therapy consumable providers are upgrading their existing technologies and expanding their product portfolios.
8. Many companies have undertaken strategic initiatives, including partnerships, acquisitions and expansions, to augment their existing capabilities.
9. We expect industry stakeholders to continue to forge strategic alliances with niche / specialized players engaged in this domain to further augment their respective product offerings.
10. Over the years, stakeholders within this industry have established strong brand positions by undertaking a range of initiatives to further advance the development of raw materials for cell therapies.
11. Cost is a key determinant for the adoption of consumables in a cell therapy manufacturing process.
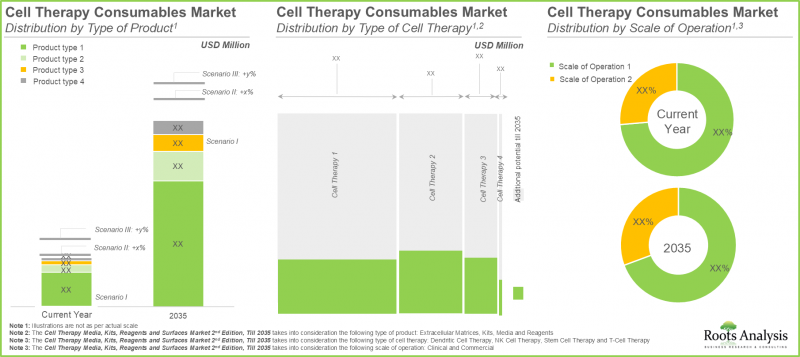
12. In 2035, the commercial scale of operation is likely to account for 75% of the total demand for cell therapy consumables; this is attributed to the expected surge in the anticipated approvals of multiple cell therapies.
13. A paradigm shift from animal-based to animal component free formulations, combined with stringent regulatory guidelines, is likely to drive the growth of the cell therapy consumables market at an annualized rate of 11.1%.
CELL THERAPY MEDIA MARKET: KEY SEGMENTS
Extracellular Matrices is the Fastest Growing Segment in the Cell Therapy Media Market
Based on the type of product, the market is segmented into culture media, kits, cell culture reagents and extracellular matrices. It is worth highlighting that majority of the current cell therapy media market is captured by culture media.
T-Cell Therapy is Likely to Dominate the Cell Therapy Media Market During the Forecast Period
Based on the type of cell therapy, the market is segmented into T-Cell therapy, stem cell therapy, dendritic cell therapy and NK cell therapy. It is worth highlighting that the cell therapy consumables market for NK cell therapies is likely to grow at a relatively higher CAGR, during the forecast period. This can be attributed to the fact that currently, more than 75 NK cell therapy focused clinical studies are being evaluated for a myriad of disease indications. In the coming years, this number is anticipated to increase further, and this is likely to boost the market opportunity for such therapies.
By Scale of Operation, Commercial Scale is Likely to Dominate the Cell Therapy Media Market During the Forecast Period
Based on the scale of operation, the market is segmented into clinical and commercial scales. It is worth highlighting that the commercial scale cell therapy media market is likely to drive the market in the near future.
Industry Players Segment Accounts for the Largest Share of the Cell Therapy Media Market
Based on the type of end user, the market is segmented into industry and non-industry. It is worth highlighting that the cell therapy media market for industry players is likely to drive the market in the near future. This can be attributed to the fact that the industry players contribute significantly to the overall commercial market as majority of the approved therapies have been developed by such players.
North America Accounts for the Largest Share of the Market
Based on key geographical regions, the market is segmented into North America, Europe, Asia-Pacific, Middle East and North Africa, and Latin America. It is worth highlighting that, over the years, the market in Latin America is expected to grow at a higher CAGR.
Example Players in the Cell Therapy Media Market
- BD Biosciences
- Bio-Techne
- CellGenix
- Corning
- Irvine Scientific (Acquired by FUJIFILM)
- Lonza
- Miltenyi Biotech
- Sartorius
- STEMCELL Technologies
- Thermo Fisher Scientific
Primary Research Overview
The opinions and insights presented in this study were influenced by discussions conducted with multiple stakeholders. The research report features detailed transcripts of interviews held with the following industry stakeholders:
- Vice President of Business Development, Company A
- Chief Operating Officer, Company B
- Director R&D, Cell Culture and Immunology, Company C
- Assistant R&D Manager, Animal Cell Culture, Company D
CELL THERAPY MEDIA MARKET: RESEARCH COVERAGE
- Market Forecast and Opportunity Analysis: The report features an in-depth analysis of the cell therapy media market, focusing on key market segments, including [A] type of product, [B] type of cell therapy, [C] scale of operation, [D] type of end user and [E] key geographical regions.
- Market Landscape: A comprehensive evaluation of companies offering cell culture consumables and cell culture media, considering various parameters, [A] such as year of establishment, [B] company size (in terms of number of employees), [C] location of headquarters, [D] type of product, [E] number and location of consumable facilities, [F] accreditations received, [G] type of end-user, [H] cell culture media compatibility, [I] type of cell therapy, [J] type of function, [K] kit components, [L] type of ECM coating, [M] type of formulation, [N] shelf life, [O] scale of operation, [P] application area, and [Q] storage temperature.
- Company Competitiveness Analysis: A comprehensive competitive analysis of companies operating in the cell culture consumable and cell culture media market, examining factors such as [A] supplier strength, [B] portfolio strength and [C] number of products offered.
- Brand Positioning Analysis: A detailed brand positioning analysis of prominent industry players, highlighting the current perceptions regarding their proprietary brands across different consumable classes.
- Company Profiles: In-depth profiles of key industry players in cell therapy consumables and cell culture media market, focusing on [A] company overviews, [B] product portfolio, [C] consumable facilities, [D] recent developments and an [E] informed future outlook.
- Recent Developments and Initiatives: An analysis of recent developments within the cell culture consumables and cell culture media market, [A] covering partnerships and collaborations, [B] mergers and acquisitions, and [B] expansion initiatives.
- Likely Partner Analysis: A detailed evaluation of over 250 cell therapy developers that are most likely to collaborate with cell culture consumables and cell culture media providers. This analysis considers various relevant parameters, including [A] developer strength (which takes into account a company's size and its experience in this field), [B] pipeline strength and [C] maturity (based on the number of pipeline drugs and affiliated stage of development), and availability of other cell therapy capabilities.
- Roots Analysis Pricing Strategy: A proprietary Roots Analysis competitive pricing framework, which analyzes the competitive position of various companies engaged in cell culture consumables and cell culture media market, by taking into consideration the prices and features of their consumable offerings (such as media and extracellular matrices).
- Demand Analysis: Informed estimates of the annual demand for cell culture consumables and cell culture media (in terms of volume of media required for total number of cells), based on [A] scale of operation and [B] key geographical regions.
- Upcoming Trends And Future Growth Opportunities: A comprehensive analysis of emerging trends and future growth prospects in the cell culture consumables and media market. It includes details related to the significance of automation in cell therapy manufacturing processes and the benefits of single use technologies for the production of cell therapies.
KEY QUESTIONS ANSWERED IN THIS REPORT
- What are the factors driving the cell therapy consumables market?
- How many players are engaged in offering cell culture media for manufacturing cell therapies?
- How many players are engaged in offering kits for manufacturing cell therapies?
- How many media products are available in the market for culturing cell therapies?
- What are the partnership and collaboration trends observed in the cell therapy consumables domain?
- Which geographical segment captures the largest market share in the current cell therapy consumables market?
- Which type of product contributes to the largest share of the cell therapy consumables market?
REASONS TO BUY THIS REPORT
- The report provides a comprehensive market analysis, offering detailed revenue projections of the overall market and its specific sub-segments. This information is valuable to both established market leaders and emerging entrants.
- Stakeholders can leverage the report to gain a deeper understanding of the competitive dynamics within the market. By analyzing the competitive landscape, businesses can make informed decisions to optimize their market positioning and develop effective go-to-market strategies.
- The report offers stakeholders a comprehensive overview of the market, including key drivers, barriers, opportunities, and challenges. This information empowers stakeholders to stay abreast of market trends and make data-driven decisions to capitalize on growth prospects.
ADDITIONAL BENEFITS
- Complimentary PPT Insights Packs
- Complimentary Excel Data Packs for all Analytical Modules in the Report
- 15% Free Content Customization
- Detailed Report Walkthrough Session with Research Team
- Free Updated report if the report is 6-12 months old or older
TABLE OF CONTENTS
1. PREFACE
- 1.1. Introduction
- 1.2. Key Market Insights
- 1.3. Scope of the Report
- 1.4. Research Methodology
- 1.5. Frequently Asked Questions
- 1.6. Chapter Outlines
2. EXECUTIVE SUMMARY
3. INTRODUCTION
- 3.1. Context and Background
- 3.2. Introduction to Cell Therapies
- 3.3. Comparison of Cell Therapies with Other Biopharmaceuticals
- 3.4. Classification of Cell Therapy Products
- 3.5. Overview of Cell Therapy Development and Manufacturing
- 3.6. Role of Raw Materials in Cell Therapy Development and Manufacturing
- 3.7. Types of Cell Therapy Consumables
- 3.8. Key Challenges Associated with Manufacturing of Cell Therapy Consumables
- 3.9. Future Perspectives
4. MARKET OVERVIEW
- 4.1. Chapter Overview
- 4.2. List of Cell Therapy Kit Providers
- 4.2.1. Analysis by Year of Establishment
- 4.2.2. Analysis by Company Size
- 4.2.3. Analysis by Location of Headquarters
- 4.2.4. Analysis by Location of Kits Manufacturing Facilities
- 4.2.5. Analysis by Certifications / Accreditations Received
- 4.2.6. Analysis by Type of End-User
- 4.2.7. Analysis by Type of Cell Therapy
- 4.2.8. Analysis by Type of Function
- 4.2.9. Analysis by Kit Components
- 4.2.10. Analysis by Storage Temperature
- 4.2.11. Analysis by Scale of Operation
- 4.2.12. Analysis by Application Area
- 4.2.13. Analysis by Application Area and Geography
- 4.3. List of Cell Therapy Media Providers
- 4.3.1. Analysis by Year of Establishment
- 4.3.2. Analysis by Company Size
- 4.3.3. Analysis by Location of Headquarters
- 4.3.4. Analysis by Location of Media Manufacturing Facilities
- 4.3.5. Analysis by Certifications / Accreditations Received
- 4.3.6. Analysis by Type of End-User
- 4.3.7. Analysis by Type of Cell Therapy
- 4.3.8. Analysis by Media Compatibility
- 4.3.9. Analysis by Type of Function
- 4.3.10. Analysis by Storage Temperature
- 4.3.11. Analysis by Volume of Media
- 4.3.12. Analysis by Scale of Operation
- 4.3.13. Analysis by Application Area
- 4.3.14. Analysis by Application Area and Geography
- 4.4. List of Cell Therapy Reagent Providers
- 4.4.1. Analysis by Year of Establishment
- 4.4.2. Analysis by Company Size
- 4.4.3. Analysis by Location of Headquarters
- 4.4.4. Analysis by Location of Reagent Manufacturing Facilities
- 4.4.5. Analysis by Certifications / Accreditations Received
- 4.4.6. Analysis by Type of End-User
- 4.4.7. Analysis by Type of Cell Therapy
- 4.4.8. Analysis by Type of Function
- 4.4.9. Analysis by Storage Temperature
- 4.4.10. Analysis by Volume of Reagent
- 4.4.11. Analysis by Scale of Operation
- 4.4.12. Analysis by Application Area
- 4.4.13. Analysis by Application Area and Geography
- 4.5. List of Cell Therapy Extracellular Matrix Providers
- 4.5.1. Analysis by Year of Establishment
- 4.5.2. Analysis by Company Size
- 4.5.3. Analysis by Location of Headquarters
- 4.5.4. Analysis by Location of Extracellular Matrix Manufacturing Facilities
- 4.5.5. Analysis by Certifications / Accreditations Received
- 4.5.6. Analysis by Type of End-User
- 4.5.7. Analysis by Type of Stem Cell Therapy
- 4.5.8. Analysis by Type of Function
- 4.5.9. Analysis by Type of ECM Coating
- 4.5.10. Analysis by Type of Formulation
- 4.5.11. Analysis by Shelf Life
- 4.5.12. Analysis by Storage Temperature
- 4.5.13. Analysis by Volume of Extracellular Matrix
- 4.5.14. Analysis by Scale of Operation
- 4.5.15. Analysis by Application Area
- 4.5.16. Analysis by Application Area and Geography
5. COMPANY COMPETITIVENESS ANALYSIS
- 5.1. Chapter Overview
- 5.2. Key Assumptions and Parameters
- 5.3. Methodology
- 5.4. Cell Therapy Consumables Providers: Company Competitiveness Analysis
- 5.5. Cell Therapy Kit Providers
- 5.6. Cell Therapy Media Providers
- 5.6.1. Cell Therapy Media Providers based in North America
- 5.6.2. Cell Therapy Media Providers based in Europe
- 5.6.3. Cell Therapy Media Providers based in Asia-Pacific
- 5.7. Cell Therapy Reagent Providers
- 5.8. Cell Therapy Extracellular Matrix Providers
6. BRAND POSITIONING OF KEY INDUSTRY PLAYERS
- 6.1. Chapter Overview
- 6.2. Scope and Methodology
- 6.3. Brand Positioning: STEMCELL Technologies
- 6.4. Brand Positioning: Miltenyi Biotec
- 6.5. Brand Positioning: Thermo Fisher Scientific
- 6.6. Brand Positioning: Takara Bio
- 6.7. Brand Positioning: GeminiBio
7. COMPANY PROFILES
- 7.1. Chapter Overview
- 7.2. STEMCELL Technologies
- 7.2.1. Company Overview
- 7.2.2. Product Portfolio
- 7.2.3. Recent Developments and Future Outlook
- 7.3. Miltenyi Biotec
- 7.3.1. Company Overview
- 7.3.2. Product Portfolio
- 7.3.3. Recent Developments and Future Outlook
- 7.4. Thermo Fisher Scientific
- 7.4.1. Company Overview
- 7.4.2. Product Portfolio
- 7.4.3. Recent Developments and Future Outlook
- 7.5. Bio-Techne
- 7.5.1. Company Overview
- 7.5.2. Product Portfolio
- 7.5.3. Recent Developments and Future Outlook
- 7.6. Irvine Scientific
- 7.6.1. Company Overview
- 7.6.2. Product Portfolio
- 7.6.3. Recent Developments and Future Outlook
- 7.7. Lonza
- 7.7.1. Company Overview
- 7.7.2. Product Portfolio
- 7.7.3. Recent Developments and Future Outlook
- 7.8. Sartorius
- 7.8.1. Company Overview
- 7.8.2. Product Portfolio
- 7.8.3. Recent Developments and Future Outlook
- 7.9. BD Biosciences
- 7.9.1. Company Overview
- 7.9.2. Product Portfolio
- 7.9.3. Recent Developments and Future Outlook
- 7.10. Corning
- 7.10.1. Company Overview
- 7.10.2. Product Portfolio
- 7.10.3. Recent Developments and Future Outlook
- 7.11. CellGenix
- 7.11.1. Company Overview
- 7.11.2. Product Portfolio
- 7.11.3. Recent Developments and Future Outlook
8. RECENT DEVELOPMENTS AND INITIATIVES
- 8.1. Chapter Overview
- 8.2. Partnership Models
- 8.3. Cell Therapy Consumables: Partnerships and Collaborations
- 8.3.1. Analysis by Year of Partnership
- 8.3.2. Analysis by Type of Partnership
- 8.3.3. Analysis by Year and Type of Partnership
- 8.3.4. Analysis by Type of Product
- 8.3.5. Analysis by Type of Partnership and Type of Product
- 8.3.6. Analysis by Type of Cell Therapy
- 8.3.7. Analysis by Type of Product and Type of Cell Therapy
- 8.3.8. Most Active Players: Analysis by Number of Partnerships
- 8.3.9. Analysis by Region
- 8.3.9.1. Intercontinental and Intracontinental Agreements
- 8.3.9.2. Local and International Agreements
- 8.4. Cell Therapy Consumables: Mergers and Acquisitions
- 8.4.1. Cumulative Year-wise Trend of Mergers and Acquisitions
- 8.4.2. Analysis by Type of Agreement
- 8.4.3. Analysis by Key Value Drivers
- 8.4.4. Analysis by Year of Acquisition and Key Value Drivers
- 8.5. Cell Therapy Consumables: Recent Expansions
- 8.5.1. Analysis by Year of Expansion
- 8.5.2. Analysis by Type of Expansion
- 8.5.3. Analysis by Year and Type of Expansion
- 8.5.4. Analysis by Type of Product
- 8.5.5. Analysis by Type of Expansion and Type of Product
- 8.5.6. Analysis by Area of Expansion
- 8.5.7. Most Active Players: Analysis by Number of Expansions
- 8.5.8. Analysis by Region
- 8.5.8.1. Analysis by Location of Facility (Continent-wise)
- 8.5.8.2. Analysis by Location of Facility (Country-wise)
- 8.5.9. Analysis by Type of Expansion and Location of Facility
9. LIKELY PARTNER ANALYSIS FOR CELL THERAPY CONSUMABLE PROVIDERS
- 9.1. Chapter Overview
- 9.2. Scoring Criteria and Key Assumptions
- 9.3. Scope and Methodology
- 9.4. Key Potential Strategic Partners for Cell Therapy Consumable Providers
- 9.4.1. Likely Partners for Dendritic Cell Therapy Consumable Providers
- 9.4.2. Likely Partners for NK Cell Therapy Consumable Providers
- 9.4.3. Likely Partners for Stem Cell Therapy Consumable Providers
- 9.4.4. Likely Partners for T-Cell Therapy Consumable Providers
10. ROOTS ANALYSIS PRICING STRATEGY
- 10.1. Chapter Overview
- 10.2. Roots Analysis Pricing Strategy Framework
- 10.2.1. Theoretical Framework and Price Evaluation Hypothesis for Cell Therapy Media
- 10.2.1.1. Methodology
- 10.2.1.2. Results and Interpretation
- 10.2.1.2.1. Cell Therapy Media Price Evaluation Matrix: Information on Volume of Media
- 10.2.1.2.2. Cell Therapy Media Price Evaluation Matrix: Information on Media Compatibility
- 10.2.1.2.3. Cell Therapy Media Price Evaluation Matrix: Information on Type of Product Manufacturing Practices
- 10.2.1.2.4. Cell Therapy Media Price Evaluation Matrix: Information on Application Area
- 10.2.1.2.5. Cell Therapy Media Price Evaluation Matrix: Information on Storage Temperature
- 10.2.1.2.6. Cell Therapy Media Price Evaluation Matrix: Information on Type of Cell Therapy
- 10.2.1.2.7. Cell Therapy Media Price Evaluation Matrix: Information on Type of Function
- 10.2.2. Theoretical Framework and Price Evaluation Hypothesis of Cell Therapy Extracellular Matrices
- 10.2.2.1. Methodology
- 10.2.2.2. Results and Interpretation
- 10.2.2.2.1. Cell Therapy Extracellular Matrices Price Evaluation Matrix: Information on Type of ECM Coating
- 10.2.2.2.2. Cell Therapy Extracellular Matrices Price Evaluation Matrix: Information on Type of Formulation
- 10.2.2.2.3. Cell Therapy Extracellular Matrices Price Evaluation Matrix: Information on Volume of Extracellular Matrices
- 10.2.2.2.4. Cell Therapy Extracellular Matrices Price Evaluation Matrix: Information on Storage Temperature
- 10.2.2.2.5. Cell Therapy Extracellular Matrices Price Evaluation Matrix: Information on Shelf Life
- 10.2.2.2.6. Cell Therapy Extracellular Matrices Price Evaluation Matrix: Information on Type of Stem Cell Therapy
- 10.2.2.2.7. Cell Therapy Extracellular Matrices Price Evaluation Matrix: Information on Type of Function
- 10.2.1. Theoretical Framework and Price Evaluation Hypothesis for Cell Therapy Media
11. DEMAND ANALYSIS
- 11.1. Chapter Overview
- 11.2. Scope and Methodology
- 11.3. Global Demand for Cell Therapy Consumables
- 11.3.1. Global Demand for Cell Therapy Consumables for Planar Processes
- 11.3.2. Global Demand for Cell Therapy Consumables for Suspension Processes
- 11.4. Analysis by Scale of Operation
- 11.5. Analysis by Geography
12. MARKET FORECAST AND OPPORTUNITY ANALYSIS
- 12.1. Chapter Overview
- 12.2. Key Assumptions and Methodology
- 12.3. Global Cell Therapy Consumables Market, Till 2035
- 12.4. Cell Therapy Consumables Market: Analysis by Type of Product
- 12.4.1. Cell Therapy Consumables Market for Extracellular Matrices, Till 2035
- 12.4.2. Cell Therapy Consumables Market for Kits, Till 2035
- 12.4.3. Cell Therapy Consumables Market for Media, Till 2035
- 12.4.4. Cell Therapy Consumables Market for Reagents, Till 2035
- 12.5. Cell Therapy Consumables Market: Analysis by Type of Cell Therapy
- 12.5.1. Cell Therapy Consumables Market for Dendritic Cell Therapies, Till 2035
- 12.5.2. Cell Therapy Consumables Market for NK Cell Therapies, Till 2035
- 12.5.3. Cell Therapy Consumables Market for Stem Cell Therapies, Till 2035
- 12.5.4. Cell Therapy Consumables Market for T-Cell Therapies, Till 2035
- 12.6. Cell Therapy Consumables Market: Analysis by Scale of Operation
- 12.6.1. Cell Therapy Consumables Market for Clinical Operations, Till 2035
- 12.6.2. Cell Therapy Consumables Market for Commercial Operations, Till 2035
- 12.7. Cell Therapy Consumables Market: Analysis by Type of End-User
- 12.7.1. Cell Therapy Consumables Market for Industry Players, Till 2035
- 12.7.2. Cell Therapy Consumables Market for Non-Industry Players, Till 2035
- 12.8. Cell Therapy Consumables Market: Analysis by Geography
- 12.8.1. Cell Therapy Consumables Market in North America, Till 2035
- 12.8.1.1. Cell Therapy Consumables Market in the US, Till 2035
- 12.8.1.2. Cell Therapy Consumables Market in Canada, Till 2035
- 12.8.1.3. Cell Therapy Consumables Market in Rest of North America, Till 2035
- 12.8.2. Cell Therapy Consumables Market in Europe, Till 2035
- 12.8.2.1. Cell Therapy Consumables Market in Spain, Till 2035
- 12.8.2.2. Cell Therapy Consumables Market in France, Till 2035
- 12.8.2.3. Cell Therapy Consumables Market in Germany, Till 2035
- 12.8.2.4. Cell Therapy Consumables Market in Italy, Till 2035
- 12.8.2.5. Cell Therapy Consumables Market in the Netherlands, Till 2035
- 12.8.2.6. Cell Therapy Consumables Market in the UK, Till 2035
- 12.8.2.7. Cell Therapy Consumables Market in Rest of Europe, Till 2035
- 12.8.3. Cell Therapy Consumables Market in Asia-Pacific, Till 2035
- 12.8.3.1. Cell Therapy Consumables Market in China, Till 2035
- 12.8.3.2. Cell Therapy Consumables Market in Korea, Till 2035
- 12.8.3.3. Cell Therapy Consumables Market in Rest of Asia-Pacific, Till 2035
- 12.8.4. Cell Therapy Consumables Market in Middle East and North Africa, Till 2035
- 12.8.5. Cell Therapy Consumables Market in Latin America, Till 2035
- 12.8.1. Cell Therapy Consumables Market in North America, Till 2035
13. UPCOMING TRENDS AND FUTURE GROWTH OPPORTUNITIES
- 13.1. Chapter Overview
- 13.2. Emerging Trends Related to Cell Culture Media
- 13.3. Automation of Cell Therapy Manufacturing Processes
- 13.4. Single Use Systems and Technologies in Cell Therapy Manufacturing
14. CONCLUDING REMARKS
15. INTERVIEW TRANSCRIPTS
- 15.1. Chapter Overview
- 15.2. Company A
- 15.2.1. Interview Transcript: Vice President of Business Development - Cell Therapy
- 15.3. Company B
- 15.3.1. Interview Transcript: Chief Operating Officer
- 15.4. Company C
- 15.4.1. Interview Transcript: Director R&D, Cell Culture and Immunology and, Assistant R&D Manager, Animal Cell Culture
16. APPENDIX I: TABULATED DATA
17. APPENDIX II: LIST OF COMPANIES AND ORGANIZATIONS
List of Tables
- Table 3.1 Cell Therapies: Applications
- Table 3.2 Differences between Cell Therapies and Other Biopharmaceuticals
- Table 3.3 Key Cell Therapy Manufacturing Steps
- Table 3.4 Types of Media Used in Cell Therapy Manufacturing
- Table 4.1 List of Cell Therapy Kit Providers
- Table 4.2 Cell Therapy Kits: Information on Type of Cell Therapy and Type of Function
- Table 4.3 Cell Therapy Kits: Information on Kit Components and Storage Temperature
- Table 4.4 Cell Therapy Kits: Information on Scale of Operation and Application Area
- Table 4.5 List of Cell Therapy Media Providers
- Table 4.6 Cell Therapy Media: Information on Type of Cell Therapy, Media Compatibility and Type of Function
- Table 4.7 Cell Therapy Media: Information on Storage Temperature and Volume of Media
- Table 4.8 Cell Therapy Media: Information on Scale of Operation and Application Area
- Table 4.9 List of Cell Therapy Reagent Providers
- Table 4.10 Cell Therapy Reagents: Information on Type of Cell Therapy and Type of Function
- Table 4.11 Cell Therapy Reagents: Information on Storage Temperature and Volume of Reagent
- Table 4.12 Cell Therapy Reagents: Information on Scale of Operation and Application Area
- Table 4.13 List of Cell Therapy Extracellular Matrix Providers
- Table 4.14 Cell Therapy Extracellular Matrices: Information on Type of Stem Cell Therapy and Type of Function
- Table 4.15 Cell Therapy Extracellular Matrices: Information on Type of ECM Coating and Type of Formulation
- Table 4.16 Cell Therapy Extracellular Matrices: Information on Shelf Life, Storage Temperature and Volume of Extracellular Matrix
- Table 4.17 Cell Therapy Extracellular Matrices: Information on Scale of Operation and Application Area
- Table 7.1 STEMCELL Technologies: Company Overview
- Table 7.2 STEMCELL Technologies: Recent Developments and Future Outlook
- Table 7.3 Miltenyi Biotec: Company Overview
- Table 7.4 Miltenyi Biotec: Recent Developments and Future Outlook
- Table 7.5 Thermo Fisher Scientific: Company Overview
- Table 7.6 Thermo Fisher Scientific: Recent Developments and Future Outlook
- Table 7.7 Bio-Techne: Company Overview
- Table 7.8 Bio-Techne: Recent Developments and Future Outlook
- Table 7.9 Irvine Scientific: Company Overview
- Table 7.10 Irvine Scientific: Recent Developments and Future Outlook
- Table 7.11 Lonza: Company Overview
- Table 7.12 Sartorius: Company Overview
- Table 7.13 Sartorius: Recent Developments and Future Outlook
- Table 7.14 BD Biosciences: Company Overview
- Table 7.15 BD Biosciences: Recent Developments and Future Outlook
- Table 7.16 Corning: Company Overview
- Table 7.17 CellGenix: Company Overview
- Table 7.18 CellGenix: Recent Developments and Future Outlook
- Table 8.1 Cell Therapy Consumables: List of Partnerships and Collaborations, Since 2015
- Table 8.2 Cell Therapy Consumables: Information on Location of Headquarters, 2015 Onwards
- Table 8.3 Mergers and Acquisitions: List of Mergers and Acquisitions, 2016 Onwards
- Table 8.4 Mergers and Acquisitions: Information on Key Value Drivers, 2016 Onwards
- Table 8.5 Cell Therapy Consumables: List of Recent Expansions, 2017 Onwards
- Table 9.1 Key Potential Strategic Partners for Cell Therapy Consumable Providers
- Table 9.2 Likely Partners for Dendritic Cell Therapy Consumable Providers
- Table 9.3 Likely Partners for NK Cell Therapy Consumable Providers
- Table 9.4 Likely Partners for Stem Cell Therapy Consumable Providers
- Table 9.5 Likely Partners for T-Cell Therapy Consumable Providers
- Table 10.1 Media Price Evaluation Matrix: Based on Volume of Media
- Table 10.2 Media Price Evaluation Matrix: Based on Media Compatibility
- Table 10.3 Media Price Evaluation Matrix: Based on Type of Product Manufacturing Practices
- Table 10.4 Media Price Evaluation Matrix: Based on Application Area
- Table 10.5 Media Price Evaluation Matrix: Based on Storage Temperature
- Table 10.6 Media Price Evaluation Matrix: Based on Type of Cell Therapy
- Table 10.7 Media Price Evaluation Matrix: Based on Type of Function
- Table 10.8 ECM Price Evaluation Matrix: Based on Type of ECM Coating
- Table 10.9 ECM Price Evaluation Matrix: Based on Type of Formulation
- Table 10.10 ECM Price Evaluation Matrix: Based on Volume of Extracellular Matrix
- Table 10.11 ECM Price Evaluation Matrix: Based on Storage Temperature
- Table 10.12 ECM Price Evaluation Matrix: Based on Shelf Life
- Table 10.13 ECM Price Evaluation Matrix: Based on Type of Stem Cell Therapy
- Table 10.14 ECM Price Evaluation Matrix: Based on Type of Function
- Table 15.1 Akadeum Life Sciences: Key Highlights
- Table 15.2 Cellular Engineering Technologies: Key Highlights
- Table 15.3 HiMedia Laboratories: Key Highlights
- Table 16.1 Cell Therapy Consumables: Distribution by Type of Product
- Table 16.2 Cell Therapy Consumable Providers: Distribution by Company Size and Location of Headquarters
- Table 16.3 Cell Therapy Kit Providers: Distribution by Year of Establishment
- Table 16.4 Cell Therapy Kit Providers: Distribution by Company Size
- Table 16.5 Cell Therapy Kit Providers: Distribution by Location of Headquarters
- Table 16.6 Cell Therapy Kit Providers: Distribution by Location of Kit Manufacturing Facilities
- Table 16.7 Cell Therapy Kit Providers: Distribution by Certifications / Accreditations Received
- Table 16.8 Cell Therapy Kit Providers: Distribution by Type of End-User
- Table 16.9 Cell Therapy Kits: Distribution by Type of Cell Therapy
- Table 16.10 Cell Therapy Kits: Distribution by Type of Function
- Table 16.11 Cell Therapy Kits: Distribution by Kit Components
- Table 16.12 Cell Therapy Kits: Distribution by Storage Temperature
- Table 16.13 Cell Therapy Kits: Distribution by Scale of Operation
- Table 16.14 Cell Therapy Kits: Distribution by Application Area
- Table 16.15 Cell Therapy Media Providers: Distribution by Year of Establishment
- Table 16.16 Cell Therapy Media Providers: Distribution by Company Size
- Table 16.17 Cell Therapy Media Providers: Distribution by Location of Headquarters
- Table 16.18 Cell Therapy Media Providers: Distribution by Location of Media Manufacturing Facilities
- Table 16.19 Cell Therapy Media Providers: Distribution by Certifications / Accreditations Received
- Table 16.20 Cell Therapy Media Providers: Distribution by Type of End-User
- Table 16.21 Cell Therapy Media: Distribution by Type of Cell Therapy
- Table 16.22 Cell Therapy Media: Distribution by Media Compatibility
- Table 16.23 Cell Therapy Media: Distribution by Type of Function
- Table 16.24 Cell Therapy Media: Distribution by Storage Temperature
- Table 16.25 Cell Therapy Media: Distribution by Volume of Media
- Table 16.26 Cell Therapy Media: Distribution by Scale of Operation
- Table 16.27 Cell Therapy Media: Distribution by Application Area
- Table 16.28 Cell Therapy Reagent Providers: Distribution by Year of Establishment
- Table 16.29 Cell Therapy Reagent Providers: Distribution by Company Size
- Table 16.30 Cell Therapy Reagent Providers: Distribution by Location of Headquarters
- Table 16.31 Cell Therapy Reagent Providers: Distribution by Location of Reagent Manufacturing Facilities
- Table 16.32 Cell Therapy Reagent Providers: Distribution by Certifications / Accreditations Received
- Table 16.33 Cell Therapy Reagent Providers: Distribution by Type of End-User
- Table 16.34 Cell Therapy Reagents: Distribution by Type of Cell Therapy
- Table 16.35 Cell Therapy Reagents: Distribution by Type of Function
- Table 16.36 Cell Therapy Reagents: Distribution by Storage Temperature
- Table 16.37 Cell Therapy Reagents: Distribution by Volume of Reagent
- Table 16.38 Cell Therapy Reagents: Distribution by Scale of Operation
- Table 16.39 Cell Therapy Reagents: Distribution by Application Area
- Table 16.40 Cell Therapy Extracellular Matrix Providers: Distribution by Year of Establishment
- Table 16.41 Cell Therapy Extracellular Matrix Providers: Distribution by Company Size
- Table 16.42 Cell Therapy Extracellular Matrix Providers: Distribution by Location of Headquarters
- Table 16.43 Cell Therapy Extracellular Matrix Providers: Distribution by Location of Extracellular Matrix Manufacturing Facilities
- Table 16.44 Cell Therapy Extracellular Matrix Providers: Distribution by Certifications / Accreditations Received
- Table 16.45 Cell Therapy Extracellular Matrix Providers: Distribution by Type of End-User
- Table 16.46 Cell Therapy Extracellular Matrices: Distribution by Type of Stem Cell Therapy
- Table 16.47 Cell Therapy Extracellular Matrices: Distribution by Type of Function
- Table 16.48 Cell Therapy Extracellular Matrices: Distribution by Type of ECM Coating
- Table 16.49 Cell Therapy Extracellular Matrices: Distribution by Type of Formulation
- Table 16.50 Cell Therapy Extracellular Matrices: Distribution by Shelf Life
- Table 16.51 Cell Therapy Extracellular Matrices: Distribution by Storage Temperature
- Table 16.52 Cell Therapy Extracellular Matrices: Distribution by Volume of Extracellular Matrix
- Table 16.53 Cell Therapy Extracellular Matrices: Distribution by Scale of Operation
- Table 16.54 Cell Therapy Extracellular Matrices: Distribution by Application Area
- Table 16.55 Partnerships and Collaborations: Cumulative Year-wise Trend, 2015 Onwards
- Table 16.56 Partnerships and Collaborations: Distribution by Type of Partnership
- Table 16.57 Partnerships and Collaborations: Distribution by Year of Partnership and Type of Partnership, 2015 Onwards
- Table 16.58 Partnerships and Collaborations: Distribution by Type of Product
- Table 16.59 Partnerships and Collaborations: Distribution by Type of Partnership and Type of Product
- Table 16.60 Partnerships and Collaborations: Distribution by Type of Cell Therapy
- Table 16.61Partnerships and Collaborations: Distribution by Type of Product and Type of Cell Therapy
- Table 16.62 Most Active Players: Distribution by Number of Partnerships
- Table 16.63 Partnerships and Collaborations: Intercontinental and Intracontinental Agreements
- Table 16.64 Partnerships and Collaborations: Local and International Agreements
- Table 16.65 Mergers and Acquisitions: Cumulative Year-wise Trend, 2016 Onwards
- Table 16.66 Mergers and Acquisitions: Distribution by Type of Agreement
- Table 16.67 Mergers and Acquisitions: Distribution by Key Value Drivers
- Table 16.68 Mergers and Acquisitions: Distribution by Year of Acquisition and Key Value Drivers, 2016 Onwards
- Table 16.69 Recent Expansions: Cumulative Year-wise Trend, 2017 Onwards
- Table 16.70 Recent Expansions: Distribution by Type of Expansion
- Table 16.71 Recent Expansions: Distribution by Year and Type of Expansion, 2017 Onwards
- Table 16.72 Recent Expansions: Distribution by Type of Product
- Table 16.73 Recent Expansions: Distribution by Type of Expansion and Type of Product
- Table 16.74 Recent Expansions: Distribution by Area of Expansion
- Table 16.75 Most Active Players: Distribution by Number of Expansions
- Table 16.76 Recent Expansions: Distribution by Location of Facility (Continent-wise)
- Table 16.77 Recent Expansions: Distribution by Location of Facility (Country-wise)
- Table 16.78 Recent Expansions: Distribution by Type of Expansion and Location of Facility
- Table 16.79 Global Demand for Cell Therapy Consumables, Till 2035 (Thousand Liters)
- Table 16.80 Global Demand for Cell Therapy Consumables for Planar Process, Till 2035 (Thousand Liters)
- Table 16.81 Global Demand for Cell Therapy Consumables for Suspension Process, Till 2035 (Thousand Liters)
- Table 16.82 Global Demand for Cell Therapy Consumables for Planar Process, Till 2035: Distribution by Scale of Operation (Thousand Liters)
- Table 16.83 Global Demand for Cell Therapy Consumables for Suspension Process, Till 2035: Distribution by Scale of Operation (Thousand Liters)
- Table 16.84 Global Demand for Cell Therapy Consumables: Distribution by Geography, Current Year and 2035
- Table 16.85 Global Demand for Cell Therapy Consumables for Planar Process, Till 2035: Distribution by Geography (Thousand Liters)
- Table 16.86 Global Demand for Cell Therapy Consumables for Suspension Process, Till 2035: Distribution by Geography (Thousand Liters)
- Table 16.87 Global Cell Therapy Consumables Market, Till 2035 (USD Million)
- Table 16.88 Cell Therapy Consumables Market: Distribution by Type of Product, Current Year and 2035
- Table 16.89 Cell Therapy Consumables Market for Extracellular Matrices, Till 2035 (USD Million)
- Table 16.90 Cell Therapy Consumables Market for Kits, Till 2035 (USD Million)
- Table 16.91 Cell Therapy Consumables Market for Media, Till 2035 (USD Million)
- Table 16.92 Cell Therapy Consumables Market for Reagents, Till 2035 (USD Million)
- Table 16.93 Cell Therapy Consumables Market: Distribution by Type of Cell Therapy, 2023, 2028 and 2035
- Table 16.94 Cell Therapy Consumables Market for Dendritic Cell Therapies, Till 2035 (USD Million)
- Table 16.95 Cell Therapy Consumables Market for NK Cell Therapies, Till 2035 (USD Million)
- Table 16.96 Cell Therapy Consumables Market for Stem Cell Therapies, Till 2035 (USD Million)
- Table 16.97 Cell Therapy Consumables Market for T-Cell Therapies, Till 2035 (USD Million)
- Table 16.98 Cell Therapy Consumables Market: Distribution by Scale of Operation, Current Year and 2035
- Table 16.99 Cell Therapy Consumables Market for Clinical Operations, Till 2035 (USD Million)
- Table 16.100 Cell Therapy Consumables Market for Commercial Operations, Till 2035 (USD Million)
- Table 16.101 Cell Therapy Consumables Market: Distribution by Type of End-User, Current Year and 2035
- Table 16.102 Cell Therapy Consumables Market for Industry Players, Till 2035 (USD Million)
- Table 16.103 Cell Therapy Consumables Market for Non-Industry Players, Till 2035 (USD Million)
- Table 16.104 Cell Therapy Consumables Market: Distribution by Geography, Current Year and 2035
- Table 16.105 Cell Therapy Consumables Market in North America, Till 2035 (USD Million)
- Table 16.106 Cell Therapy Consumables Market in the US, Till 2035 (USD Million)
- Table 16.107 Cell Therapy Consumables Market in Canada, Till 2035 (USD Million)
- Table 16.108 Cell Therapy Consumables Market in Rest of North America, Till 2035 (USD Million)
- Table 16.109 Cell Therapy Consumables Market in Europe, Till 2035 (USD Million)
- Table 16.110 Cell Therapy Consumables Market in Spain, Till 2035 (USD Million)
- Table 16.111 Cell Therapy Consumables Market in France, Till 2035 (USD Million)
- Table 16.112 Cell Therapy Consumables Market in Germany, Till 2035 (USD Million)
- Table 16.113 Cell Therapy Consumables Market in Italy, Till 2035 (USD Million)
- Table 16.114 Cell Therapy Consumables Market in the Netherlands, Till 2035 (USD Million)
- Table 16.115 Cell Therapy Consumables Market in the UK, Till 2035 (USD Million)
- Table 16.116 Cell Therapy Consumables Market in Rest of Europe, Till 2035 (USD Million)
- Table 16.117 Cell Therapy Consumables Market in Asia-Pacific, Till 2035 (USD Million)
- Table 16.118 Cell Therapy Consumables Market in China, Till 2035 (USD Million)
- Table 16.119 Cell Therapy Consumables Market in Korea, Till 2035 (USD Million)
- Table 16.120 Cell Therapy Consumables Market in Rest of Asia-Pacific, Till 2035 (USD Million)
- Table 16.121 Cell Therapy Consumables Market in Middle East and North Africa, Till 2035 (USD Million)
- Table 16.122 Cell Therapy Consumables Market in Latin America, Till 2035 (USD Million)
List of Figures
- Figure 2.1 Executive Summary: Market Landscape
- Figure 2.2 Executive Summary: Recent Developments and Initiatives
- Figure 2.3 Executive Summary: Demand Analysis
- Figure 2.4 Executive Summary: Market Forecast and Opportunity Analysis
- Figure 3.1 Types of Cell Therapy Consumables
- Figure 4.1 Cell Therapy Consumables: Distribution by Type of Product
- Figure 4.2 Cell Therapy Consumable Providers: Distribution by Company Size and Location of Headquarters
- Figure 4.3 Cell Therapy Kit Providers: Distribution by Year of Establishment
- Figure 4.4 Cell Therapy Kit Providers: Distribution by Company Size
- Figure 4.5 Cell Therapy Kit Providers: Distribution by Location of Headquarters
- Figure 4.6 Cell Therapy Kit Providers: Distribution by Location of Kit Manufacturing Facilities
- Figure 4.7 Cell Therapy Kit Providers: Distribution by Certifications / Accreditations Received
- Figure 4.8 Cell Therapy Kit Providers: Distribution by Type of End-User
- Figure 4.9 Cell Therapy Kits: Distribution by Type of Cell Therapy
- Figure 4.10 Cell Therapy Kits: Distribution by Type of Function
- Figure 4.11 Cell Therapy Kits: Distribution by Kit Components
- Figure 4.12 Cell Therapy Kits: Distribution by Storage Temperature
- Figure 4.13 Cell Therapy Kits: Distribution by Scale of Operation
- Figure 4.14 Cell Therapy Kits: Distribution by Application Area
- Figure 4.15 Cell Therapy Kit Providers: Distribution by Application Area and Geography
- Figure 4.16 Cell Therapy Media Providers: Distribution by Year of Establishment
- Figure 4.17 Cell Therapy Media Providers: Distribution by Company Size
- Figure 4.18 Cell Therapy Media Providers: Distribution by Location of Headquarters
- Figure 4.19 Cell Therapy Media Providers: Distribution by Location of Media Manufacturing Facilities
- Figure 4.20 Cell Therapy Media Providers: Distribution by Certifications / Accreditations Received
- Figure 4.21 Cell Therapy Media Providers: Distribution by Type of End-User
- Figure 4.22 Cell Therapy Media: Distribution by Type of Cell Therapy
- Figure 4.23 Cell Therapy Media: Distribution by Media Compatibility
- Figure 4.24 Cell Therapy Media: Distribution by Type of Function
- Figure 4.25 Cell Therapy Media: Distribution by Storage Temperature
- Figure 4.26 Cell Therapy Media: Distribution by Volume of Media
- Figure 4.27 Cell Therapy Media: Distribution by Scale of Operation
- Figure 4.28 Cell Therapy Media: Distribution by Application Area
- Figure 4.29 Cell Therapy Media Providers: Distribution by Application Area and Geography
- Figure 4.30 Cell Therapy Reagent Providers: Distribution by Year of Establishment
- Figure 4.31 Cell Therapy Reagent Providers: Distribution by Company Size
- Figure 4.32 Cell Therapy Reagent Providers: Distribution by Location of Headquarters
- Figure 4.33 Cell Therapy Reagent Providers: Distribution by Location of Reagent Manufacturing Facilities
- Figure 4.34 Cell Therapy Reagent Providers: Distribution by Certifications / Accreditations Received
- Figure 4.35 Cell Therapy Reagent Providers: Distribution by Type of End-User
- Figure 4.36 Cell Therapy Reagents: Distribution by Type of Cell Therapy
- Figure 4.37 Cell Therapy Reagents: Distribution by Type of Function
- Figure 4.38 Cell Therapy Reagents: Distribution by Storage Temperature
- Figure 4.39 Cell Therapy Reagents: Distribution by Volume of Reagent
- Figure 4.40 Cell Therapy Reagents: Distribution by Scale of Operation
- Figure 4.41 Cell Therapy Reagents: Distribution by Application Area
- Figure 4.42 Cell Therapy Reagent Providers: Distribution by Application Area and Geography
- Figure 4.43 Cell Therapy Extracellular Matrix Providers: Distribution by Year of Establishment
- Figure 4.44 Cell Therapy Extracellular Matrix Providers: Distribution by Company Size
- Figure 4.45 Cell Therapy Extracellular Matrix Providers: Distribution by Location of Headquarters
- Figure 4.46 Cell Therapy Extracellular Matrix Providers: Distribution by Location of Extracellular Matrix Manufacturing Facilities
- Figure 4.47 Cell Therapy Extracellular Matrix Providers: Distribution by Certifications / Accreditations Received
- Figure 4.48 Cell Therapy Extracellular Matrix Providers: Distribution by Type of End-User
- Figure 4.49 Cell Therapy Extracellular Matrices: Distribution by Type of Stem Cell Therapy
- Figure 4.50 Cell Therapy Extracellular Matrices: Distribution by Type of Function
- Figure 4.51 Cell Therapy Extracellular Matrices: Distribution by Type of ECM Coating
- Figure 4.52 Cell Therapy Extracellular Matrices: Distribution by Type of Formulation
- Figure 4.53 Cell Therapy Extracellular Matrices: Distribution by Shelf Life
- Figure 4.54 Cell Therapy Extracellular Matrices: Distribution by Storage Temperature
- Figure 4.55 Cell Therapy Extracellular Matrices: Distribution by Volume of Extracellular Matrices
- Figure 4.56 Cell Therapy Extracellular Matrices: Distribution by Scale of Operation
- Figure 4.57 Cell Therapy Extracellular Matrices: Distribution by Application Area
- Figure 4.58 Cell Therapy Extracellular Matrix Providers: Distribution by Application Area and Geography
- Figure 5.1 Company Competitiveness Analysis: Cell Therapy Kit Providers
- Figure 5.2 Company Competitiveness Analysis: Cell Therapy Media Providers based in North America
- Figure 5.3 Company Competitiveness Analysis: Cell Therapy Media Providers based in Europe
- Figure 5.4 Company Competitiveness Analysis: Cell Therapy Media Providers based in Asia-Pacific
- Figure 5.5 Company Competitiveness Analysis: Cell Therapy Reagent Providers
- Figure 5.6 Company Competitiveness Analysis: Cell Therapy Extracellular Matrix Providers
- Figure 6.1 Brand Positioning Matrix: STEMCELL Technologies
- Figure 6.2 Brand Positioning Matrix: Miltenyi Biotec
- Figure 6.3 Brand Positioning Matrix: Thermo Fisher Scientific
- Figure 6.4 Brand Positioning Matrix: Takara Bio
- Figure 6.5 Brand Positioning Matrix: GeminiBio
- Figure 7.1 STEMCELL Technologies: Product Portfolio
- Figure 7.2 Miltenyi Biotec: Product Portfolio
- Figure 7.3 Thermo Fisher Scientific: Product Portfolio
- Figure 7.4 Bio-Techne: Product Portfolio
- Figure 7.5 Irvine Scientific: Product Portfolio
- Figure 7.6 Lonza: Product Portfolio
- Figure 7.7 Sartorius: Product Portfolio
- Figure 7.8 BD Biosciences: Product Portfolio
- Figure 7.9 Corning: Product Portfolio
- Figure 7.10 CellGenix: Product Portfolio
- Figure 8.1 Partnerships and Collaborations: Cumulative Year-wise Trend, Since 2015
- Figure 8.2 Partnerships and Collaborations: Distribution by Type of Partnership
- Figure 8.3 Partnerships and Collaborations: Distribution by Year and Type of Partnership
- Figure 8.4 Partnerships and Collaborations: Distribution by Type of Product
- Figure 8.5 Partnerships and Collaborations: Distribution by Type of Partnership and Type of Product
- Figure 8.6 Partnerships and Collaborations: Distribution by Type of Cell Therapy
- Figure 8.7 Partnerships and Collaborations: Distribution by Type of Product and Type of Cell Therapy
- Figure 8.8 Most Active Players: Distribution by Number of Partnerships
- Figure 8.9 Partnerships and Collaborations: Intercontinental and Intracontinental Agreements
- Figure 8.10 Partnerships and Collaborations: Local and International Agreements
- Figure 8.11 Mergers and Acquisitions: Cumulative Year-wise Trend, Since 2016
- Figure 8.12 Mergers and Acquisitions: Distribution by Type of Agreement
- Figure 8.13 Mergers and Acquisitions: Distribution by Key Value Drivers
- Figure 8.14 Mergers and Acquisitions: Distribution by Year of Acquisition and Key Value Drivers
- Figure 8.15 Recent Expansions: Cumulative Year-wise Trend, 2017 Onwards
- Figure 8.16 Recent Expansions: Distribution by Type of Expansion
- Figure 8.17 Recent Expansions: Distribution by Year and Type of Expansion
- Figure 8.18 Recent Expansions: Distribution by Type of Product
- Figure 8.19 Recent Expansions: Distribution by Type of Expansion and Type of Product
- Figure 8.20 Recent Expansions: Distribution by Area of Expansion (Sq. Ft.)
- Figure 8.21 Most Active Players: Distribution by Number of Expansions
- Figure 8.22 Recent Expansions: Distribution by Location of Facility (Continent-wise)
- Figure 8.23 Recent Expansions: Distribution by Location of Facility (Country-wise)
- Figure 8.24 Recent Expansions: Distribution by Type of Expansion and Location of Facility
- Figure 10.1 Cell Therapy Media: Roots Analysis Pricing Strategy Matrix
- Figure 10.2 Cell Therapy Media: Roots Analysis Pricing Strategy Graphical Interpretation
- Figure 10.3 Cell Therapy Extracellular Matrices: Roots Analysis Pricing Strategy Matrix
- Figure 10.4 Cell Therapy Extracellular Matrices: Roots Analysis Pricing Strategy Graphical Interpretation
- Figure 11.1 Global Demand for Cell Therapy Consumables, Till 2035 (Thousand Liters)
- Figure 11.2 Global Demand for Cell Therapy Consumables for Planar Process, Till 2035 (Thousand Liters)
- Figure 11.3 Global Demand for Cell Therapy Consumables for Suspension Process, Till 2035 (Thousand Liters)
- Figure 11.4 Global Demand for Cell Therapy Consumables for Planar Process, Till 2035: Distribution by Scale of Operation (Thousand Liters)
- Figure 11.5 Global Demand for Cell Therapy Consumables for Suspension Process, Till 2035: Distribution by Scale of Operation (Thousand Lite
- Figure 11.6 Global Demand for Cell Therapy Consumables: Distribution by Geography, Current Year and 2035
- Figure 11.7 Global Demand for Cell Therapy Consumables for Planar Process, Till 2035: Distribution by Geography (Thousand Liters)
- Figure 11.8 Global Demand for Cell Therapy Consumables for Suspension Process, Till 2035: Distribution by Geography (Thousand Liters)
- Figure 12.1 Global Cell Therapy Consumables Market, Till 2035 (USD Million)
- Figure 12.2 Cell Therapy Consumables Market: Distribution by Type of Product, Current Year and 2035
- Figure 12.3 Cell Therapy Consumables Market for Extracellular Matrices, Till 2035 (USD Million)
- Figure 12.4 Cell Therapy Consumables Market for Kits, Till 2035 (USD Million)
- Figure 12.5 Cell Therapy Consumables Market for Media, Till 2035 (USD Million)
- Figure 12.6 Cell Therapy Consumables Market for Reagents, Till 2035 (USD Million)
- Figure 12.7 Cell Therapy Consumables Market: Distribution by Type of Cell Therapy, 2023, 2028 and 2035
- Figure 12.8 Cell Therapy Consumables Market for Dendritic Cell Therapies, Till 2035 (USD Million)
- Figure 12.9 Cell Therapy Consumables Market for NK Cell Therapies, Till 2035 (USD Million)
- Figure 12.10 Cell Therapy Consumables Market for Stem Cell Therapies, Till 2035 (USD Million)
- Figure 12.11 Cell Therapy Consumables Market for T-Cell Therapies, Till 2035 (USD Million)
- Figure 12.12 Cell Therapy Consumables Market: Distribution by Scale of Operation, Current Year and 2035
- Figure 12.13 Cell Therapy Consumables Market for Clinical Operations, Till 2035 (USD Million)
- Figure 12.14 Cell Therapy Consumables Market for Commercial Operations, Till 2035 (USD Million)
- Figure 12.15 Cell Therapy Consumables Market: Distribution by Type of End-User, Current Year and 2035
- Figure 12.16 Cell Therapy Consumables Market for Industry Players, Till 2035 (USD Million)
- Figure 12.17 Cell Therapy Consumables Market for Non-Industry Players, Till 2035 (USD Million)
- Figure 12.18 Cell Therapy Consumables Market: Distribution by Geography, Current Year and 2035
- Figure 12.19 Cell Therapy Consumables Market in North America, Till 2035 (USD Million)
- Figure 12.20 Cell Therapy Consumables Market in the US, Till 2035 (USD Million)
- Figure 12.21 Cell Therapy Consumables Market in Canada, Till 2035 (USD Million)
- Figure 12.22 Cell Therapy Consumables Market in Rest of North America, Till 2035 (USD Million)
- Figure 12.23 Cell Therapy Consumables Market in Europe, Till 2035 (USD Million)
- Figure 12.24 Cell Therapy Consumables Market in Spain, Till 2035 (USD Million)
- Figure 12.25 Cell Therapy Consumables Market in France, Till 2035 (USD Million)
- Figure 12.26 Cell Therapy Consumables Market in Germany, Till 2035 (USD Million)
- Figure 12.27 Cell Therapy Consumables Market in Italy, Till 2035 (USD Million)
- Figure 12.28 Cell Therapy Consumables Market in the Netherlands, Till 2035 (USD Million)
- Figure 12.29 Cell Therapy Consumables Market in the UK, Till 2035 (USD Million)
- Figure 12.30 Cell Therapy Consumables Market in Rest of Europe, Till 2035 (USD Million)
- Figure 12.31 Cell Therapy Consumables Market in Asia-Pacific, Till 2035 (USD Million)
- Figure 12.32 Cell Therapy Consumables Market in China, Till 2035 (USD Million)
- Figure 12.33 Cell Therapy Consumables Market in Korea, Till 2035 (USD Million)
- Figure 12.34 Cell Therapy Consumables Market in Rest of Asia-Pacific, Till 2035 (USD Million)
- Figure 12.35 Cell Therapy Consumables Market in Middle East and North Africa, Till 2035 (USD Million)
- Figure 12.36 Cell Therapy Consumables Market in Latin America, Till 2035 (USD Million)
- Figure 14.1 Concluding Remarks: Overall Market Landscape
- Figure 14.2 Concluding Remarks: Recent Developments
- Figure 14.3 Concluding Remarks: Demand Analysis
- Figure 14.4 Concluding Remarks: Market Forecast and Opportunity Analysis
- Figure 14.5 Concluding Remarks: Market Forecast and Opportunity Analysis

