Picture
SEARCH
What are you looking for?
Need help finding what you are looking for? Contact Us
Compare

PUBLISHER: Roots Analysis | PRODUCT CODE: 1737049

Cover Image

PUBLISHER: Roots Analysis | PRODUCT CODE: 1737049

AI in Drug Discovery Market Distribution by Drug Discovery Steps, Therapeutic Area and Key Geographies

PUBLISHED:
PAGES: 387 Pages
DELIVERY TIME: 1-2 business days
SELECT AN OPTION
PDF (Single User License)
USD 4799
PDF (One-Location Site License)
USD 6999
PDF (Department License)
USD 10599
PDF (Enterprise License)
USD 17999

Add to Cart

AI IN DRUG DISCOVERY MARKET: OVERVIEW

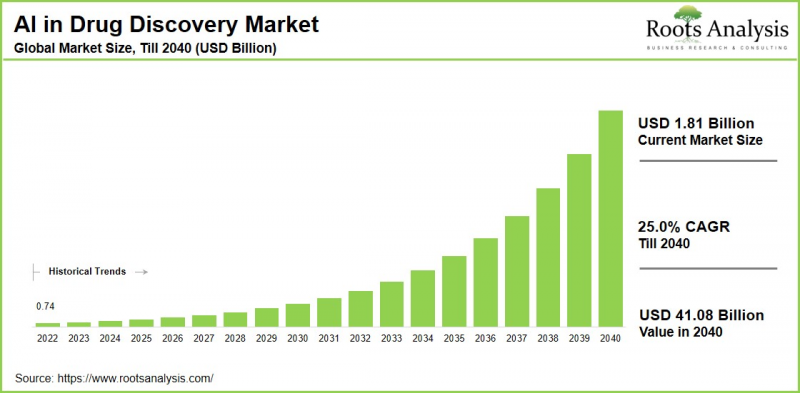
As per Roots Analysis, the global AI in drug discovery market is estimated to grow from USD 1.8 billion in the current year to USD 13.4 billion by 2035, at a CAGR of 16.5% during the forecast period, till 2035.

The market sizing and opportunity analysis has been segmented across the following parameters:

Drug Discovery Steps

  • Target identification / validation
  • Hit generation / lead identification
  • Lead optimization

Therapeutic Area

  • Oncological disorders
  • CNS disorders
  • Infectious diseases
  • Respiratory disorders
  • Cardiovascular disorders
  • Endocrine disorders
  • Gastrointestinal disorders
  • Musculoskeletal disorders
  • Immunological disorders
  • Dermatological disorders
  • Others

Key Geographical Regions

  • North America
  • Europe
  • Asia-Pacific
  • Latin America
  • Middle East and North Africa
  • Rest of the World

AI IN DRUG DISCOVERY MARKET: GROWTH AND TRENDS

Drug discovery is a complex process that involves significant utilization of time and resources. As per several sources, on average, the entire drug development process (from initial proof-of-concept to commercial launch) takes around 10-15 years and capital investments worth USD 4-10 billion to develop a drug from concept to commercial launch. The early stages, including target discovery and lead molecule identification, play an important role in the success of the drug in both preclinical and clinical studies. Despite the advances in technology and improved understanding of biological systems, the drug discovery process is still considered to be inefficient. In order to optimize the ongoing and future drug development projects, stakeholders are exploring advanced technology solutions (such as artificial intelligence in drug discovery) in order to facilitate better decision-making during the various stages of drug discovery and development.

AI in Drug Discovery Market - IMG1

Artificial intelligence-based tools, such as big data analytics, deep learning, and machine learning help to collect data in real-time with seamless accuracy. This capability aids in reducing clinical failures and ensuring safety during the early stages of development. Notably, over 50% of investments have been made in this domain over the last two years, reflecting a rapid inclination towards AI-based tools for drug discovery and development. In fact, several industry players, namely Pfizer, Sanofi and Genentech, are already using different AI-enabled platforms for internal drug discovery efforts. Considering the ongoing interest and rising adoption of AI in drug discovery, it is anticipated that the market will expand at a steady rate during the forecast period.

AI IN DRUG DISCOVERY MARKET: KEY INSIGHTS

The report delves into the current state of the AI in drug discovery market and identifies potential growth opportunities within the industry. Some key findings from the report include:

  • Presently, around 210 players across the globe claim to use AI-based technologies across various steps of the drug discovery and development process.
  • Majority of the stakeholders have the required AI-related expertise for lead identification and optimization of drug candidates targeting a range of therapeutic areas.
  • Foreseeing the lucrative potential, a large number of players have made significant investments to advance the initiatives of industry stakeholders across multiple funding instances.
AI in Drug Discovery Market - IMG2
  • A rise in partnerships focused on research and development of drugs using AI-based technologies validate the growing interest of stakeholders in this market.
  • Some players have managed to establish strong competitive positions; in future, we expect multiple acquisitions to take place wherein the relative valuation of a firm is likely to be a key determinant.
  • Over 260 patents related to AI-based drug discovery have recently been filed / granted, indicating the growing pace of innovation in this domain.
  • The adoption of AI-enabled tools and operational approaches, across different stages of drug discovery and development, is likely to have an impact on R&D expenditure, enabling significant cost savings worldwide.
  • The market is expected to grow at a CAGR of 16.5% in the coming years; the opportunity is anticipated to be well distributed across various drug discovery steps, therapeutic areas and regions.
AI in Drug Discovery Market - IMG3

AI IN DRUG DISCOVERY MARKET: KEY SEGMENTS

Lead Optimization Segment Occupies the Largest Share of AI in drug discovery market

Based on the drug discovery steps, the market is segmented into target identification / validation, hit generation / lead identification and lead optimization. At present, the lead optimization segment holds the maximum share of global AI in drug discovery market. Further, the lead optimization segment is likely to grow at a faster pace compared to the other segments.

By Therapeutic Area, Infectious Diseases is the Fastest Growing Segment of the Global AI in Drug Discovery Market During the Forecast Period

Based on the therapeutic area, the market is segmented into oncological disorders, CNS disorders, infectious diseases, respiratory disorders, cardiovascular disorders, endocrine disorders, gastrointestinal disorders, musculoskeletal disorders, immunological disorders, dermatological disorders, and others. Currently, the oncological disorders segment captures the highest proportion of the global AI in drug discovery market. The growth of the oncological disorders segment stems from the widespread adoption of artificial intelligence in oncology to identify targeted therapeutics and biomarkers. Further, it is worth highlighting that the AI in drug discovery market for the infectious diseases segment is likely to grow at a relatively higher CAGR.

North America Accounts for the Largest Share of the Market

Based on key geographical regions, the market is segmented into North America, Europe, and Asia-Pacific, Latin America, Middle East and North Africa and Rest of the World. Currently, North America dominates the AI in drug discovery market and accounts for the largest revenue share. Additionally, the market in Asia-Pacific is likely to grow at a higher CAGR in the future.

Example Players in the AI in Drug Discovery Market

  • Aiforia Technologies
  • Atomwise
  • BioSyntagma
  • Chemalive
  • Collaborations Pharmaceuticals
  • Cyclica
  • DeepMatter
  • Recursion
  • InveniAI
  • MAbSilico
  • Optibrium
  • Recursion Pharmaceuticals
  • Sensyne Health
  • Valo Health

AI IN DRUG DISCOVERY MARKET: RESEARCH COVERAGE

  • Market Sizing and Opportunity Analysis: The report features an in-depth analysis of the global AI in drug discovery market, focusing on key market segments, including [A] drug discovery steps, [B] therapeutic area, and [C] key geographical regions.
  • Market Landscape: A comprehensive evaluation of AI drug discovery companies, based on several relevant parameters, such as [A] year of establishment, [B] company size, [C] location of headquarters, [D] type of company, [E] type of AI technology, [F] type of drug molecule and [G] target therapeutic area.
  • Company Profiles: In-depth profiles of key players engaged in the domain of AI in drug discovery, focusing on [A] overview of the company, [B] technology portfolio, and [C] recent developments and an informed future outlook.
  • Partnerships and Collaborations: An insightful analysis of the deals inked by stakeholders in the AI in drug discovery market, based on several parameters, such as [A] year of partnership, [B] type of partnership, [C] target therapeutic area, [D] focus area, [E] type of partner company, [F] most active players (in terms of the number of partnerships signed) and [G] geographical distribution of partnership activity.
  • Funding and Investments: An in-depth analysis of the fundings raised by AI in drug discovery companies, based on relevant parameters, such as [A] year of funding, [B] amount invested by year, [C] type of funding, [D] amount invested by company size, [E] type of investor, [F] amount invested by type of investor, [G] most active players, [H] most active investors and [I] geographical analysis.
  • Patent Analysis: An in-depth analysis of patents filed / granted till date in the AI in drug discovery domain, based on various relevant parameters, such as [A] type of patent, [B] patent application year, [C] patent publication year, [D] geography, [E] CPC symbols, [F] emerging focus area, [G] type of applicant, [H] leading players, [I] patent age, [J] patent benchmarking, and [K] patent valuation analysis.
  • PORTER'S Five Forces Analysis: A detailed analysis of the five competitive forces prevalent in AI in the drug discovery market, including [A] threats for new entrants, [B] bargaining power of drug developers, [C] bargaining power of AI-based drug discovery companies, [D] threats of substitute technologies, and [E] rivalry among existing competitors.
  • Company Valuation Analysis: An in-depth analysis of the companies engaged in the AI in drug discovery market, based on [A] our proprietary, multi-variable dependent valuation model to estimate the current valuation / net worth of industry players.
  • Cost Saving Analysis: An in-depth analysis of the likely cost-saving potential associated with the use of AI in the drug discovery sector, based on various parameters, such as [A] pharmaceutical R&D expenditure, [B] drug discovery expenditure / budget, and [C] adoption of AI across various drug discovery steps.
  • Market Impact Analysis: A thorough analysis of various factors, such as drivers, restraints, opportunities, and existing challenges that are likely to impact market growth.

KEY QUESTIONS ANSWERED IN THIS REPORT

  • How many companies are currently engaged in this market?
  • Which are the leading companies in this market?
  • What factors are likely to influence the evolution of this market?
  • What is the current and future market size?
  • What is the CAGR of this market?
  • How is the current and future market opportunity likely to be distributed across key market segments?

REASONS TO BUY THIS REPORT

  • The report provides a comprehensive market analysis, offering detailed revenue projections of the overall market and its specific sub-segments. This information is valuable to both established market leaders and emerging entrants.
  • Stakeholders can leverage the report to gain a deeper understanding of the competitive dynamics within the market. By analyzing the competitive landscape, businesses can make informed decisions to optimize their market positioning and develop effective go-to-market strategies.
  • The report offers stakeholders a comprehensive overview of the market, including key drivers, barriers, opportunities, and challenges. This information empowers stakeholders to stay abreast of market trends and make data-driven decisions to capitalize on growth prospects.

ADDITIONAL BENEFITS

  • Complimentary PPT Insights Packs
  • Complimentary Excel Data Packs for all Analytical Modules in the Report
  • 15% Free Content Customization
  • Detailed Report Walkthrough Session with Research Team
  • Free Updated report if the report is 6-12 months old or older
Product Code: RA100342

TABLE OF CONTENTS

1. PREFACE

  • 1.1. Scope of the Report
  • 1.2. Research Methodology
  • 1.3. Key Questions Answered
  • 1.4. Chapter Outlines

2. EXECUTIVE SUMMARY

3. INTRODUCTION

  • 3.1. Chapter Overview
  • 3.2. Artificial Intelligence
  • 3.3. Subsets of AI
    • 3.3.1. Machine Learning
      • 3.3.1.1. Supervised Learning
      • 3.3.1.2. Unsupervised Learning
      • 3.3.1.3. Reinforced / Reinforcement Learning
      • 3.3.1.4. Deep Learning
      • 3.3.1.5. Natural Language Processing (NLP)
  • 3.4. Data Science
  • 3.5. Applications of AI in Healthcare
    • 3.5.1. Drug Discovery
    • 3.5.2. Disease Prediction, Diagnosis and Treatment
    • 3.5.3. Manufacturing and Supply Chain Operations
    • 3.5.4. Marketing
    • 3.5.5. Clinical Trials
  • 3.6. AI in Drug Discovery
    • 3.6.1. Identification of Pathway and Target
    • 3.6.2. Identification of Hit or Lead
    • 3.6.3. Lead Optimization
    • 3.6.4. Synthesis of Drug-Like Compounds
  • 3.7. Advantages of Using AI in the Drug Discovery Process
  • 3.8. Challenges Associated with the Adoption of AI
  • 3.9. Concluding Remarks

4. COMPETITIVE LANDSCAPE

  • 4.1. Chapter Overview
  • 4.2. AI-based Drug Discovery: Overall Market Landscape
    • 4.2.1. Analysis by Year of Establishment
    • 4.2.2. Analysis by Company Size
    • 4.2.3. Analysis by Location of Headquarters
    • 4.2.4. Analysis by Type of Company
    • 4.2.5. Analysis by Type of Technology
    • 4.2.6. Analysis by Drug Discovery Steps
    • 4.2.7. Analysis by Type of Drug Molecule
    • 4.2.8. Analysis by Drug Development Initiatives
    • 4.2.9. Analysis by Technology Licensing Option
    • 4.2.10. Analysis by Target Therapeutic Area
    • 4.2.11. Key Players: Analysis by Number of Platforms / Tools Available

5. COMPANY PROFILES: AI-BASED DRUG DISCOVERY PROVIDERS IN NORTH AMERICA

  • 5.1. Chapter Overview
  • 5.2. Atomwise
    • 5.2.1. Company Overview
    • 5.2.2. AI-based Drug Discovery Technology Portfolio
    • 5.2.3. Recent Developments and Future Outlook
  • 5.3. BioSyntagma
    • 5.3.1. Company Overview
    • 5.3.2. AI-based Drug Discovery Technology Portfolio
    • 5.3.3. Recent Developments and Future Outlook
  • 5.4. Collaborations Pharmaceuticals
    • 5.4.1. Company Overview
    • 5.4.2. AI-based Drug Discovery Technology Portfolio
    • 5.4.3. Recent Developments and Future Outlook
  • 5.5. Cyclica
    • 5.5.1. Company Overview
    • 5.5.2. AI-based Drug Discovery Technology Portfolio
    • 5.5.3. Recent Developments and Future Outlook
  • 5.6. InveniAI
    • 5.6.1. Company Overview
    • 5.6.2. AI-based Drug Discovery Technology Portfolio
    • 5.6.3. Recent Developments and Future Outlook
  • 5.7. Recursion Pharmaceuticals
    • 5.7.1. Company Overview
    • 5.7.2. AI-based Drug Discovery Technology Portfolio
    • 5.7.3. Recent Developments and Future Outlook
  • 5.8. Valo Health
    • 5.8.1. Company Overview
    • 5.8.2. AI-based Drug Discovery Technology Portfolio
    • 5.8.3. Recent Developments and Future Outlook

6. COMPANY PROFILES: AI-BASED DRUG DISOCVERY SERVICE PROVIDERS IN EUROPE

  • 6.1. Chapter Overview
  • 6.2. iforia Technologies
    • 6.2.1. Company Overview
    • 6.2.2. AI-based Drug Discovery Technology Portfolio
    • 6.2.3. Recent Developments and Future Outlook
  • 6.3. Chemalive
    • 6.3.1. Company Overview
    • 6.3.2. AI-based Drug Discovery Technology Portfolio
    • 6.3.3. Recent Developments and Future Outlook
  • 6.4. DeepMatter
    • 6.4.1. Company Overview
    • 6.4.2. AI-based Drug Discovery Technology Portfolio
    • 6.4.3. Recent Developments and Future Outlook
  • 6.5. Exscientia
    • 6.5.1. Company Overview
    • 6.5.2. AI-based Drug Discovery Technology Portfolio
    • 6.5.3. Recent Developments and Future Outlook
  • 6.6. MAbSilico
    • 6.6.1. Company Overview
    • 6.6.2. AI-based Drug Discovery Technology Portfolio
    • 6.6.3. Recent Developments and Future Outlook
  • 6.7. Optibrium
    • 6.7.1. Company Overview
    • 6.7.2. AI-based Drug Discovery Technology Portfolio
    • 6.7.3. Recent Developments and Future Outlook
  • 6.8. Sensyne Health
    • 6.8.1. Company Overview
    • 6.8.2. AI-based Drug Discovery Technology Portfolio
    • 6.8.3. Recent Developments and Future Outlook

7. COMPANY PROFILES: AI-BASED DRUG DISOCVERY SERVICE PROVIDERS IN ASIA PACIFIC

  • 7.1. Chapter Overview
  • 7.2. 3BIGS
    • 7.2.1. Company Overview
    • 7.2.2. AI-based Drug Discovery Technology Portfolio
    • 7.2.3. Recent Developments and Future Outlook
  • 7.3. Gero
    • 7.3.1. Company Overview
    • 7.3.2. AI-based Drug Discovery Technology Portfolio
    • 7.3.3. Recent Developments and Future Outlook
  • 7.4. Insilico Medicine
    • 7.4.1. Company Overview
    • 7.4.2. AI-based Drug Discovery Technology Portfolio
    • 7.4.3. Recent Developments and Future Outlook
  • 7.5. KeenEye
    • 7.5.1. Company Overview
    • 7.5.2. AI-based Drug Discovery Technology Portfolio
    • 7.5.3. Recent Developments and Future Outlook

8. PARTNERSHIPS AND COLLABORATIONS

  • 8.1. Chapter Overview
  • 8.2. Partnership Models
  • 8.3. AI-based Drug Discovery: Partnerships and Collaborations
    • 8.3.1. Analysis by Year of Partnership
    • 8.3.2. Analysis by Type of Partnership
    • 8.3.3. Analysis by Year and Type of Partnership
    • 8.3.4. Analysis by Target Therapeutic Area
    • 8.3.5. Analysis by Focus Area
    • 8.3.6. Analysis by Year of Partnership and Focus Area
    • 8.3.7. Analysis by Type of Partner Company
    • 8.3.8. Analysis by Type of Partnership and Type of Partner Company
    • 8.3.9. Most Active Players: Analysis by Number of Partnerships
    • 8.3.10. Analysis by Region
      • 8.3.10.1. Intercontinental and Intracontinental Deals
      • 8.3.10.2. International and Local Deals

9. FUNDING AND INVESTMENT ANALYSIS

  • 9.1. Chapter Overview
  • 9.2. Types of Funding
  • 9.3. AI-based Drug Discovery: Funding and Investments
    • 9.3.1. Analysis of Number of Funding Instances by Year
    • 9.3.2. Analysis of Amount Invested by Year
    • 9.3.3. Analysis by Type of Funding
    • 9.3.4. Analysis of Amount Invested and Type of Funding
    • 9.3.5. Analysis of Amount Invested by Company Size
    • 9.3.6. Analysis by Type of Investor
    • 9.3.7. Analysis of Amount Invested by Type of Investor
    • 9.3.8. Most Active Players: Analysis by Number of Funding Instances
    • 9.3.9. Most Active Players: Analysis by Amount Invested
    • 9.3.10. Most Active Investors: Analysis by Number of Funding Instances
    • 9.3.11. Analysis of Amount Invested by Geography
      • 9.3.11.1. Analysis by Region
      • 9.3.11.2. Analysis by Country

10. PATENT ANALYSIS

  • 10.1. Chapter Overview
  • 10.2. Scope and Methodology
  • 10.3. AI-based Drug Discovery: Patent Analysis
    • 10.3.1. Analysis by Application Year
    • 10.3.2. Analysis by Geography
    • 10.3.3. Analysis by CPC Symbols
    • 10.3.4. Analysis by Emerging Focus Areas
    • 10.3.5. Analysis by Type of Applicant
    • 10.3.6. Leading Players: Analysis by Number of Patents
  • 10.4. AI-based Drug Discovery: Patent Benchmarking
    • 10.4.1. Analysis by Patent Characteristics
  • 10.5. AI-based Drug Discovery: Patent Valuation
  • 10.6. Leading Patents: Analysis by Number of Citations

11. PORTER'S FIVE FORCES ANALYSIS

  • 11.1. Chapter Overview
  • 11.2. Methodology and Assumptions
  • 11.3. Key Parameters
    • 11.3.1. Threats of New Entrants
    • 11.3.2. Bargaining Power of Drug Developers
    • 11.3.3. Bargaining Power of Companies Using AI for Drug Discovery
    • 11.3.4. Threats of Substitute Technologies
    • 11.3.5. Rivalry Among Existing Competitors
  • 11.4. Concluding Remarks

12. COMPANY VALUATION ANALYSIS

  • 12.1. Chapter Overview
  • 12.2. Company Valuation Analysis: Key Parameters
  • 12.3. Methodology
  • 12.4. Company Valuation Analysis: Roots Analysis Proprietary Scores

13. AI-BASED HEALTHCARE INITIATIVES OF TECHNOLOGY GIANTS

  • 13.1. Chapter Overview
    • 13.1.1. Amazon Web Services
    • 13.1.2. Microsoft
    • 13.1.3. Intel
    • 13.1.4. Alibaba Cloud
    • 13.1.5. Siemens
    • 13.1.6. Google
    • 13.1.7. IBM

14. COST SAVING ANALYSIS

  • 14.1. Chapter Overview
  • 14.2. Key Assumptions and Methodology
  • 14.3. Overall Cost Saving Potential Associated with Use of AI-based Solutions in Drug Discovery, till 2035
    • 14.3.1. Likely Cost Savings: Analysis by Drug Discovery Steps, till 2035
      • 14.3.1.1. Likely Cost Savings During Target Identification / Validation, till 2035
      • 14.3.1.2. Likely Cost Savings During Hit Generation / Lead Identification, till 2035
      • 14.3.1.3. Likely Cost Savings During Lead Optimization, till 2035
    • 14.3.2. Likely Cost Savings: Analysis by Target Therapeutic Area, till 2035
      • 14.3.2.1. Likely Cost Savings for Drugs Targeting Oncological Disorders, till 2035
      • 14.3.2.2. Likely Cost Savings for Drugs Targeting Neurological Disorders, till 2035
      • 14.3.2.3. Likely Cost Savings for Drugs Targeting Infectious Diseases, till 2035
      • 14.3.2.4. Likely Cost Savings for Drugs Targeting Respiratory Disorders, till 2035
      • 14.3.2.5. Likely Cost Savings for Drugs Targeting Cardiovascular Disorders, till 2035
      • 14.3.2.6. Likely Cost Savings for Drugs Targeting Endocrine Disorders, till 2035
      • 14.3.2.7. Likely Cost Savings for Drugs Targeting Gastrointestinal Disorders, till 2035
      • 14.3.2.8. Likely Cost Savings for Drugs Targeting Musculoskeletal Disorders, till 2035
      • 14.3.2.9. Likely Cost Savings for Drugs Targeting Immunological Disorders, till 2035
      • 14.3.2.10. Likely Cost Savings for Drugs Targeting Dermatological Disorders, till 2035
      • 14.3.2.11. Likely Cost Savings for Drugs Targeting Other Disorders, till 2035
    • 14.3.3. Likely Cost Savings: Analysis by Geography, till 2035
      • 14.3.3.1. Likely Cost Savings in North America, till 2035
      • 14.3.3.2. Likely Cost Savings in Europe, till 2035
      • 14.3.3.3. Likely Cost Savings in Asia Pacific, till 2035
      • 14.3.3.4. Likely Cost Savings in MENA, till 2035
      • 14.3.3.5. Likely Cost Savings in Latin America, till 2035
      • 14.3.3.6. Likely Cost Savings in Rest of the World, till 2035

15. MARKET FORECAST

  • 15.1. Chapter Overview
  • 15.2. Key Assumptions and Methodology
  • 15.3. Global AI-based Drug Discovery Market, till 2035
    • 15.3.1. AI-based Drug Discovery Market: Distribution by Drug Discovery Steps, till 2035
      • 15.3.1.1. AI-based Drug Discovery Market for Target Identification / Validation, till 2035
      • 15.3.1.2. AI-based Drug Discovery Market for Hit Generation / Lead Identification, till 2035
      • 15.3.1.3. AI-based Drug Discovery Market for Lead Optimization, till 2035
    • 15.3.2. AI-based Drug Discovery Market: Distribution by Target Therapeutic Area, till 2035
      • 15.3.2.1. AI-based Drug Discovery Market for Oncological Disorders, till 2035
      • 15.3.2.2. AI-based Drug Discovery Market for Neurological Disorders, till 2035
      • 15.3.2.3. AI-based Drug Discovery Market for Infectious Diseases, till 2035
      • 15.3.2.4. AI-based Drug Discovery Market for Respiratory Disorders, till 2035
      • 15.3.2.5. AI-based Drug Discovery Market for Cardiovascular Disorders, till 2035
      • 15.3.2.6. AI-based Drug Discovery Market for Endocrine Disorders, till 2035
      • 15.3.2.7. AI-based Drug Discovery Market for Gastrointestinal Disorders, till 2035
      • 15.3.2.8. AI-based Drug Discovery Market for Musculoskeletal Disorders, till 2035
      • 15.3.2.9. AI-based Drug Discovery Market for Immunological Disorders, till 2035
      • 15.3.2.10. AI-based Drug Discovery Market for Dermatological Disorders, till 2035
      • 15.3.2.11. AI-based Drug Discovery Market for Other Disorders, till 2035
    • 15.3.3. AI-based Drug Discovery Market: Distribution by Geography, till 2035
      • 15.3.3.1. AI-based Drug Discovery Market in North America, till 2035
        • 15.3.3.1.1. AI-based Drug Discovery Market in the US, till 2035
        • 15.3.3.1.2. AI-based Drug Discovery Market in Canada, till 2035
      • 15.3.3.2. AI-based Drug Discovery Market in Europe, till 2035
        • 15.3.3.2.1. AI-based Drug Discovery Market in the UK, till 2035
        • 15.3.3.2.2. AI-based Drug Discovery Market in France, till 2035
        • 15.3.3.2.3. AI-based Drug Discovery Market in Germany, till 2035
        • 15.3.3.2.4. AI-based Drug Discovery Market in Spain, till 2035
        • 15.3.3.2.5. AI-based Drug Discovery Market in Italy, till 2035
        • 15.3.3.2.6. AI-based Drug Discovery Market in Rest of Europe, till 2035
      • 15.3.3.3. AI-based Drug Discovery Market in Asia Pacific, 2020-2035
        • 15.3.3.3.1. AI-based Drug Discovery Market in China, till 2035
        • 15.3.3.3.2. AI-based Drug Discovery Market in India, till 2035
        • 15.3.3.3.3. AI-based Drug Discovery Market in Japan, till 2035
        • 15.3.3.3.4. AI-based Drug Discovery Market in Australia, till 2035
        • 15.3.3.3.5. AI-based Drug Discovery Market in South Korea, till 2035
      • 15.3.3.4. AI-based Drug Discovery Market in MENA, till 2035
        • 15.3.3.4.1. AI-based Drug Discovery Market in Saudi Arabia, till 2035
        • 15.3.3.4.2. AI-based Drug Discovery Market in UAE, till 2035
        • 15.3.3.4.3. AI-based Drug Discovery Market in Iran, till 2035
      • 15.3.3.5. AI-based Drug Discovery Market in Latin America, till 2035
        • 15.3.3.5.1. AI-based Drug Discovery Market in Argentina, till 2035
      • 15.3.3.6. AI-based Drug Discovery Market in Rest of the World, till 2035

16. CONCLUSION

17. EXECUTIVE INSIGHTS

  • 17.1. Chapter Overview
  • 17.2. Aigenpulse
    • 17.2.1. Company Snapshot
    • 17.2.2. Interview Transcript: Steve Yemm (Chief Commercial Officer) and Satnam Surae (Chief Product Officer)
  • 17.3. Cloud Pharmaceuticals
    • 17.3.1. Company Snapshot
    • 17.3.2. Interview Transcript: Ed Addison (Co-founder, Chairman and Chief Executive Officer)
  • 17.4. DEARGEN
    • 17.4.1. Company Snapshot
    • 17.4.2. Interview Transcript: Bo Ram Beck (Head Researcher)
  • 17.5. Intelligent Omics
    • 17.5.1. Company Snapshot
    • 17.5.2. Interview Transcript: Simon Haworth (Chief Executive Officer)
  • 17.6. Pepticom
    • 17.6.1. Company Snapshot
    • 17.6.2. Interview Transcript: Immanuel Lerner (Chief Executive Officer, Co-Founder)
  • 17.7. Sage-N Research
    • 17.7.1. Company Snapshot
    • 17.7.2. Interview Transcript: David Chiang (Chairman)

18. APPENDIX I: TABULATED DATA

19. APPENDIX II: LIST OF COMPANIES AND ORGANIZATIONS

Product Code: RA100342

List of Tables

  • Table 4.1 AI-based Drug Discovery Services / Technology Providers: Information on Year of Establishment, Company Size, Location of Headquarters, Number and Name of Platforms / Tools Available
  • Table 4.2 AI-based Drug Discovery Services / Technology Providers: Information on Type of AI Technology and Drug Discovery Steps
  • Table 4.3 AI-based Drug Discovery Services / Technology Providers: Information on Type of Drug Molecule and Target Therapeutic Area
  • Table 5.1 Leading AI-based Drug Discovery Services / Technology Providers in North America
  • Table 5.2 Atomwise: Company Snapshot
  • Table 5.3 Atomwise: AI-based Drug Discovery Technologies
  • Table 5.4 Atomwise: Recent Developments and Future Outlook
  • Table 5.5 BioSyntagma: Company Snapshot
  • Table 5.6 BioSyntagma: AI-based Drug Discovery Technologies
  • Table 5.7 BioSyntagma: Recent Developments and Future Outlook
  • Table 5.8 Collaborations Pharmaceuticals: Company Snapshot
  • Table 5.9 Collaborations Pharmaceuticals: AI-based Drug Discovery Technologies
  • Table 5.10 Collaborations Pharmaceuticals: Recent Developments and Future Outlook
  • Table 5.11 Cyclica: Company Snapshot
  • Table 5.12 Cyclica: AI-based Drug Discovery Technologies
  • Table 5.13 Cyclica: Recent Developments and Future Outlook
  • Table 5.14 InveniAI: Company Snapshot
  • Table 5.15 InveniAI: AI-based Drug Discovery Technologies
  • Table 5.16 InveniAI: Recent Developments and Future Outlook
  • Table 5.17 Recursion Pharmaceuticals: Company Snapshot
  • Table 5.18 Recursion Pharmaceuticals: AI-based Drug Discovery Technologies
  • Table 5.19 Recursion Pharmaceuticals: Recent Developments and Future Outlook
  • Table 5.20 Valo Health: Company Snapshot
  • Table 5.21 Valo Health: AI-based Drug Discovery Technologies
  • Table 5.22 Valo Health: Recent Developments and Future Outlook
  • Table 6.1 Leading AI-based Drug Discovery Service / Technology Providers in Europe
  • Table 6.2 Aiforia Technologies: Company Snapshot
  • Table 6.3 Aiforia Technologies: AI-based Drug Discovery Technologies
  • Table 6.4 Aiforia Technologies: Recent Developments and Future Outlook
  • Table 6.5 Chemalive: Company Snapshot
  • Table 6.6 Chemalive: AI-based Drug Discovery Technologies
  • Table 6.7 Chemalive: Recent Developments and Future Outlook
  • Table 6.8 DeepMatter: Company Snapshot
  • Table 6.9 DeepMatter: AI-based Drug Discovery Technologies
  • Table 6.10 DeepMatter: Recent Developments and Future Outlook
  • Table 6.11 Exscientia: Company Snapshot
  • Table 6.12 Exscientia: AI-based Drug Discovery Technologies
  • Table 6.13 Exscientia: Recent Developments and Future Outlook
  • Table 6.14 MAbSilico: Company Snapshot
  • Table 6.15 MAbSilico: AI-based Drug Discovery Technologies
  • Table 6.16 MAbSilico: Recent Developments and Future Outlook
  • Table 6.17 Optibrium: Company Snapshot
  • Table 6.18 Optibrium: AI-based Drug Discovery Technologies
  • Table 6.19 Optibrium: Recent Developments and Future Outlook
  • Table 6.20 Sensyne Health: Company Snapshot
  • Table 6.21 Sensyne Health: AI-based Drug Discovery Technologies
  • Table 6.22 Sensyne Health: Recent Developments and Future Outlook
  • Table 7.1 Leading AI-based Drug Discovery Service / Technology Providers in Asia Pacific
  • Table 7.2 3BIGS: Company Snapshot
  • Table 7.3 3BIGS: AI-based Drug Discovery Technologies
  • Table 7.4 3BIGS: Recent Developments and Future Outlook
  • Table 7.5 Gero: Company Snapshot
  • Table 7.6 Gero: AI-based Drug Discovery Technologies
  • Table 7.7 Gero: Recent Developments and Future Outlook
  • Table 7.8 Insilico Medicine: Company Snapshot
  • Table 7.9 Insilico Medicine: AI-based Drug Discovery Technologies
  • Table 7.10 Insilico Medicine: Recent Developments and Future Outlook
  • Table 7.11 KeenEye: Company Snapshot
  • Table 7.12 KeenEye: AI-based Drug Discovery Technologies
  • Table 7.13 KeenEye: Recent Developments and Future Outlook
  • Table 8.1 AI-based Drug Discovery: List of Partnerships and Collaborations, Since 2009
  • Table 9.1 AI-based Drug Discovery: List of Funding and Investments, Since 2006
  • Table 10.1 Patent Analysis: Prominent CPC Symbols
  • Table 10.2 Patent Analysis: Most Popular CPC Symbols
  • Table 10.3 Patent Analysis: List of Top CPC Symbols
  • Table 10.4 Patent Analysis: Summary of Benchmarking Analysis
  • Table 10.5 Patent Analysis: Categorization based on Weighted Valuation Scores
  • Table 10.6 Patent Portfolio: List of Leading Patents (in terms of Highest Relative Valuation)
  • Table 10.7 Patent Portfolio: List of Leading Patents (in terms of Number of Citations)
  • Table 12.1. Company Valuation Analysis: Scoring Sheet
  • Table 12.2. Company Valuation Analysis: Estimated Valuation
  • Table 17.1 Aigenpulse: Company Snapshot
  • Table 17.2 Cloud Pharmaceuticals: Company Snapshot
  • Table 17.3 DEARGEN: Company Snapshot
  • Table 17.4 Intelligent Omics: Company Snapshot
  • Table 17.5 Pepticom: Company Snapshot
  • Table 17.6 Sage-N Research: Company Snapshot
  • Table 18.1 AI-based Drug Discovery: Distribution by Year of Establishment
  • Table 18.2 AI-based Drug Discovery: Distribution by Company Size
  • Table 18.3 AI-based Drug Discovery: Distribution by Location of Headquarters (Region-Wise)
  • Table 18.4 AI-based Drug Discovery: Distribution by Location of Headquarters (Country-Wise)
  • Table 18.5 AI-based Drug Discovery: Distribution by Company Size and Location of Headquarters
  • Table 18.6 AI-based Drug Discovery: Distribution by Type of Company
  • Table 18.7 AI-based Drug Discovery: Distribution by Type of AI Technology
  • Table 18.8 AI-based Drug Discovery: Distribution by Drug Discovery Steps
  • Table 18.9 AI-based Drug Discovery: Distribution by Type of Drug Molecule
  • Table 18.10. AI-based Drug Discovery: Distribution by Drug Development Initiatives
  • Table 18.11 AI-based Drug Discovery: Distribution by Technology Licensing Option
  • Table 18.12 AI-based Drug Discovery: Distribution by Target Therapeutic Area
  • Table 18.13 Most Active Players: Distribution by Number of Platforms / Tools Offered
  • Table 18.14 Partnerships and Collaborations: Cumulative Year-wise Trend
  • Table 18.15 Partnerships and Collaborations: Distribution by Type of Partnership
  • Table 18.16 Partnerships and Collaborations: Distribution by Year and Type of Partnership
  • Table 18.17 Partnerships and Collaborations: Distribution by Target Therapeutic Area
  • Table 18.18 Partnerships and Collaborations: Distribution by Focus Area
  • Table 18.19 Partnerships and Collaborations: Distribution by Year of Partnership and Focus Area
  • Table 18.20 Partnerships and Collaborations: Distribution by Type of Partner Company
  • Table 18.21 Partnerships and Collaborations: Distribution by Type of Partner Company and Type of Agreement
  • Table 18.22 Most Active Players: Distribution by Number of Partnerships
  • Table 18.23 Partnerships and Collaborations: Distribution of Intercontinental and Intracontinental Deals
  • Table 18.24 Partnerships and Collaborations: Distribution of International and Local Deals
  • Table 18.25 Funding and Investment Analysis: Cumulative Year-wise Distribution of Funding Instances, Since Pre-2015
  • Table 18.26 Funding and Investment Analysis: Cumulative Year-wise Distribution of Amount Invested Since Pre-2015, (USD Million),
  • Table 18.27 Funding and Investment Analysis: Distribution of Instances by Type of Funding
  • Table 18.28 Funding and Investment Analysis: Distribution of Amount Invested by Type of Funding (USD Million)
  • Table 18.29 Funding and Investment Analysis: Distribution of Amount Invested by Year and Type of Funding (USD Million)
  • Table 18.30 Funding and Investment Analysis: Distribution of Amount Invested by Company Size (USD Million)
  • Table 18.31 Funding and Investment Analysis: Distribution of Funding Instances by Type of Investor
  • Table 18.32 Funding and Investment Analysis: Distribution of Amount Invested by Type of Investor (USD Million)
  • Table 18.33 Most Active Players: Distribution by Number of Funding Instances
  • Table 18.34 Most Active Players: Distribution by Amount Raised
  • Table 18.35 Most Active Investors: Distribution by Number of Funding Instances
  • Table 18.36 Funding and Investment: Distribution of Amount Invested by Region (USD Million)
  • Table 18.37 Funding and Investment: Distribution of Amount Invested by Geography (Country-wise) (USD Million)
  • Table 18.38 Patent Analysis: Distribution by Type of Patent
  • Table 18.39 Patent Analysis: Distribution by Application Year
  • Table 18.40 Patent Analysis: Distribution by Location of Patent Jurisdiction (Region-wise)
  • Table 18.41 Patent Analysis: Distribution by Location of Patent Jurisdiction (Country-wise)
  • Table 18.42 Patent Analysis: Cumulative Year-wise Distribution by Type of Applicant
  • Table 18.43 Leading Industry Players: Distribution by Number of Patents
  • Table 18.44 Leading Non-Industry Players: Distribution by Number of Patents
  • Table 18.45 Leading Patent Assignees: Distribution by Number of Patents
  • Table 18.46 Patent Analysis: Distribution by Age
  • Table 18.47 Patent Analysis: Patent Valuation
  • Table 18.48 Overall Cost Saving Potential Associated with Use of AI-based Solutions in Drug Discovery, Till 2035 (USD Billion)
  • Table 18.49 Likely Cost Savings: Distribution by Drug Discovery Steps, Till 2035 (USD Billion)
  • Table 18.50 Likely Cost Savings During Target Identification / Validation, Till 2035 (USD Billion)
  • Table 18.51 Likely Cost Savings During Hit Generation / Lead Identification, Till 2035 (USD Billion)
  • Table 18.52 Likely Cost Savings During Lead Optimization, Till 2035 (USD Billion)
  • Table 18.53 Likely Cost Savings: Distribution by Target Therapeutic Area, Till 2035 (USD Billion)
  • Table 18.54 Likely Cost Savings for Drugs Targeting Oncological Disorders, Till 2035 (USD Billion)
  • Table 18.55 Likely Cost Savings for Drugs Targeting Neurological Disorders, Till 2035 (USD Billion)
  • Table 18.56 Likely Cost Savings for Drugs Targeting Infectious Diseases, Till 2035 (USD Billion)
  • Table 18.57 Likely Cost Savings for Drugs Targeting Respiratory Disorders, Till 2035 (USD Billion)
  • Table 18.58 Likely Cost Savings for Drugs Targeting Cardiovascular Disorders, Till 2035 (USD Billion)
  • Table 18.59 Likely Cost Savings for Drugs Targeting Endocrine Disorders, Till 2035 (USD Billion)
  • Table 18.60 Likely Cost Savings for Drugs Targeting Gastrointestinal Disorders, Till 2035 (USD Billion)
  • Table 18.61 Likely Cost Savings for Drugs Targeting Musculoskeletal Disorders, Till 2035 (USD Billion)
  • Table 18.62 Likely Cost Savings for Drugs Targeting Immunological Disorders, Till 2035 (USD Billion)
  • Table 18.63 Likely Cost Savings for Drugs Targeting Dermatological Disorders, Till 2035 (USD Billion)
  • Table 18.64 Likely Cost Savings for Drugs Targeting Other Disorders, Till 2035 (USD Billion)
  • Table 18.65 Likely Cost Savings: Distribution by Geography (USD Billion)
  • Table 18.66 Likely Cost Savings in North America, Till 2035 (USD Billion)
  • Table 18.67 Likely Cost Savings in Europe, Till 2035 (USD Billion)
  • Table 18.68 Likely Cost Savings in Asia Pacific, Till 2035 (USD Billion)
  • Table 18.69 Likely Cost Savings in MENA, Till 2035 (USD Billion)
  • Table 18.70 Likely Cost Savings in Latin America, Till 2035 (USD Billion)
  • Table 18.71 Likely Cost Savings in Rest of the World, Till 2035 (USD Billion)
  • Table 18.72 Global AI-based Drug Discovery Market, Conservative, Base and Optimistic Scenarios, Till 2035 (USD Billion)
  • Table 18.73 AI-based Drug Discovery Market: Distribution by Drug Discovery Steps (USD Billion)
  • Table 18.74 AI-based Drug Discovery Market for Target Identification / Validation, Conservative, Base and Optimistic Scenarios, Till 2035 (USD Billion)
  • Table 18.75 AI-based Drug Discovery Market for Hit Generation / Lead Identification, Conservative, Base and Optimistic Scenarios, Till 2035 (USD Billion)
  • Table 18.76 AI-based Drug Discovery Market for Lead Optimization, Conservative, Base and Optimistic Scenarios, Till 2035 (USD Billion)
  • Table 18.77 AI-based Drug Discovery Market: Distribution by Target Therapeutic Area (USD Billion)
  • Table 18.78 AI-based Drug Discovery Market for Oncological Disorders, Conservative, Base and Optimistic Scenarios, Till 2035 (USD Billion)
  • Table 18.79 AI-based Drug Discovery Market for Neurological Disorders Conservative, Base and Optimistic Scenarios, Till 2035 (USD Billion)
  • Table 18.80 AI-based Drug Discovery Market for Infectious Diseases, Conservative, Base and Optimistic Scenarios, Till 2035 (USD Billion)
  • Table 18.81 AI-based Drug Discovery Market for Respiratory Disorders, Conservative, Base and Optimistic Scenarios, Till 2035 (USD Billion)
  • Table 18.82 AI-based Drug Discovery Market for Cardiovascular Disorders, Conservative, Base and Optimistic Scenarios, Till 2035 (USD Billion)
  • Table 18.83 AI-based Drug Discovery Market for Endocrine Disorders, Conservative, Base and Optimistic Scenarios, Till 2035 (USD Billion)
  • Table 18.84 AI-based Drug Discovery Market for Gastrointestinal Disorders, Conservative, Base and Optimistic Scenarios, Till 2035 (USD Billion)
  • Table 18.85 AI-based Drug Discovery Market for Musculoskeletal Disorders, Conservative, Base and Optimistic Scenarios, Till 2035 (USD Billion)
  • Table 18.86 AI-based Drug Discovery Market for Immunological Disorders, Conservative, Base and Optimistic Scenarios, Till 2035 (USD Billion)
  • Table 18.87 AI-based Drug Discovery Market for Dermatological Disorders, Conservative, Base and Optimistic Scenarios, Till 2035 (USD Billion)
  • Table 18.88 AI-based Drug Discovery Market for Other Disorders, Conservative, Base and Optimistic Scenarios, Till 2035 (USD Billion)
  • Table 18.89 AI-based Drug Discovery Market: Distribution by Geography, Till 2035 (USD Billion)
  • Table 18.90 AI-based Drug Discovery Market in North America, Conservative, Base and Optimistic Scenarios, Till 2035 (USD Billion)
  • Table 18.91 AI-based Drug Discovery Market in the US, Conservative, Base and Optimistic Scenarios, Till 2035 (USD Billion)
  • Table 18.92 AI-based Drug Discovery Market in Canada, Conservative, Base and Optimistic Scenarios, Till 2035 (USD Billion)
  • Table 18.93 AI-based Drug Discovery Market in Europe, Conservative, Base and Optimistic Scenarios, Till 2035 (USD Billion)
  • Table 18.94 AI-based Drug Discovery Market in UK, Conservative, Base and Optimistic Scenarios, Till 2035 (USD Billion)
  • Table 18.95 AI-based Drug Discovery Market in France, Conservative, Base and Optimistic Scenarios, Till 2035 (USD Billion)
  • Table 18.96 AI-based Drug Discovery Market in Germany, Conservative, Base and Optimistic Scenarios, Till 2035 (USD Billion)
  • Table 18.97 AI-based Drug Discovery Market in Spain, Conservative, Base and Optimistic Scenarios, Till 2035 (USD Billion)
  • Table 18.98 AI-based Drug Discovery Market in Italy, Conservative, Base and Optimistic Scenarios, Till 2035 (USD Billion)
  • Table 18.99 AI-based Drug Discovery Market in Rest of Europe, Conservative, Base and Optimistic Scenarios, Till 2035 (USD Billion)
  • Table 18.100 AI-based Drug Discovery Market in Asia Pacific, Conservative, Base and Optimistic Scenarios, Till 2035 (USD Billion)
  • Table 18.101 AI-based Drug Discovery Market in China, Conservative, Base and Optimistic Scenarios, Till 2035 (USD Billion)
  • Table 18.102 AI-based Drug Discovery Market in India, Conservative, Base and Optimistic Scenarios, Till 2035 (USD Billion)
  • Table 18.103 AI-based Drug Discovery Market in Japan, Conservative, Base and Optimistic Scenarios, Till 2035 (USD Billion)
  • Table 18.104 AI-based Drug Discovery Market in Australia, Conservative, Base and Optimistic Scenarios, Till 2035 (USD Billion)
  • Table 18.105 AI-based Drug Discovery Market in South Korea, Conservative, Base and Optimistic Scenarios, Till 2035 (USD Billion)
  • Table 18.106 AI-based Drug Discovery Market in MENA, Conservative, Base and Optimistic Scenarios, Till 2035 (USD Billion)
  • Table 18.107 AI-based Drug Discovery Market in Saudi Arabia, Conservative, Base and Optimistic Scenarios, Till 2035 (USD Billion)
  • Table 18.108 AI-based Drug Discovery Market in UAE, Conservative, Base and Optimistic Scenarios, Till 2035 (USD Billion)
  • Table 18.109 AI-based Drug Discovery Market in Iran, Conservative, Base and Optimistic Scenarios, Till 2035 (USD Billion)
  • Table 18.110 AI-based Drug Discovery Market in Latin America, Conservative, Base and Optimistic Scenarios, Till 2035 (USD Billion)
  • Table 18.111 AI-based Drug Discovery Market in Argentina, Conservative, Base and Optimistic Scenarios, Till 2035 (USD Billion)
  • Table 18.112 AI-based Drug Discovery Market in Rest of the World, Conservative, Base and Optimistic Scenarios, Till 2035 (USD Billion)

List of Figures

  • Figure 2.1 Executive Summary: Overall Market Landscape
  • Figure 2.2 Executive Summary: Partnerships and Collaborations
  • Figure 2.3 Executive Summary: Funding and Investment Analysis
  • Figure 2.4 Executive Summary: Patent Analysis
  • Figure 2.5 Executive Summary: Cost Saving Analysis
  • Figure 2.6 Executive Summary: Market Forecast
  • Figure 3.1 Evolution of AI
  • Figure 3.2. Key Segments of AI
  • Figure 3.3. Interconnection between Data Science, Artificial Intelligence and Big Data
  • Figure 3.4. Applications of AI
  • Figure 4.1. AI-based Drug Discovery: Distribution by Year of Establishment
  • Figure 4.2. AI-based Drug Discovery: Distribution by Company Size
  • Figure 4.3. AI-based Drug Discovery: Distribution by Location of Headquarters (Region-Wise)
  • Figure 4.4. AI-based Drug Discovery: Distribution by Location of Headquarters (Country-Wise)
  • Figure 4.5. AI-based Drug Discovery: Distribution by Company Size and Location of Headquarters
  • Figure 4.6. AI-based Drug Discovery: Distribution by Type of Company
  • Figure 4.7. AI-based Drug Discovery: Distribution by Type of AI Technology
  • Figure 4.8. AI-based Drug Discovery: Distribution by Drug Discovery Steps
  • Figure 4.9. AI-based Drug Discovery: Distribution by Type of Molecule
  • Figure 4.10. AI-based Drug Discovery: Distribution by Drug Development Initiatives
  • Figure 4.11. AI-based Drug Discovery: Distribution by Technology Licensing Option
  • Figure 4.12. AI-based Drug Discovery: Distribution by Target Therapeutic Area
  • Figure 4.13. Key Players: Distribution by Number of Platforms / Tools Available
  • Figure 8.1 Partnerships and Collaborations: Cumulative Year-Wise Trend
  • Figure 8.2 Partnerships and Collaborations: Distribution by Type of Partnership
  • Figure 8.3 Partnerships and Collaborations: Distribution by Year and Type of Partnership
  • Figure 8.4 Partnerships and Collaborations: Distribution by Target Therapeutic Area
  • Figure 8.5 Partnerships and Collaborations: Distribution by Focus Area
  • Figure 8.6 Partnerships and Collaborations: Distribution by Year of Partnership and Focus Area
  • Figure 8.7 Partnerships and Collaborations: Distribution by Type of Partner Company
  • Figure 8.8 Partnerships and Collaborations: Distribution by Type of Partner Company and Type of Partnerships
  • Figure 8.9 Most Active Players: Distribution by Number of Partnerships
  • Figure 8.10 Partnerships and Collaborations: Distribution of Intercontinental and Intracontinental Deals
  • Figure 8.11 Partnerships and Collaborations: Distribution of International and Local Deals
  • Figure 9.1 Funding and Investment Analysis: Cumulative Year-wise Trend Distribution of Funding Instances, Since 2006
  • Figure 9.2 Funding and Investment Analysis: Cumulative Distribution of Amount Invested (USD Million), Since 2006
  • Figure 9.3 Funding and Investment Analysis: Distribution of Instances by Type of Funding
  • Figure 9.4 Funding and Investment Analysis: Distribution of Amount Invested by Type of Funding (USD Million)
  • Figure 9.5 Funding and Investment Analysis: Distribution of Amount Invested by Company Size (USD Million)
  • Figure 9.6 Funding and Investment Analysis: Distribution of Number of Funding Instances by Type of Investor
  • Figure 9.7 Funding and Investment Analysis: Distribution of Amount Invested by Type of Investor (USD Million)
  • Figure 9.8 Most Active Players: Distribution by Number of Funding Instances
  • Figure 9.9 Most Active Players: Distribution by Amount Invested
  • Figure 9.10 Most Active Investors: Distribution by Number of Funding Instances
  • Figure 9.11 Funding and Investment: Distribution of Amount Invested by Region (USD Million)
  • Figure 9.12 Funding and Investment: Distribution of Amount Invested by Country (USD Million)
  • Figure 10.1 Patent Analysis: Distribution by Type of Patent
  • Figure 10.2 Patent Analysis: Distribution by Application Year
  • Figure 10.3 Patent Analysis: Distribution by Location of Patent Jurisdiction (Region-wise)
  • Figure 10.4 Patent Analysis: Distribution by Location of Patent Jurisdiction (Country-wise)
  • Figure 10.5 Patent Analysis: Distribution by CPC Symbols
  • Figure 10.6 Patent Analysis: Emerging Focus Area
  • Figure 10.7 Patent Analysis: Cumulative Year-wise Distribution by Type of Applicant
  • Figure 10.8 Leading Industry Players: Distribution by Number of Patents
  • Figure 10.9 Leading Non-Industry Players: Distribution by Number of Patents
  • Figure 10.10 Leading Patent Assignees: Distribution by Number of Patents
  • Figure 10.11 Patent Benchmarking: Distribution of Leading Industry Players by Patent Characteristics (CPC Symbols)
  • Figure 10.12 Patent Analysis: Distribution by Age
  • Figure 10.13 Patent Analysis: Patent Valuation
  • Figure 11.1 Porters Five Forces: Key Parameters
  • Figure 11.2 Porters Five Forces: Harvey Ball Analysis
  • Figure 14.1 Overall Cost Saving Potential Associated with Use of AI-based Solutions in Drug Discovery, Till 2035 (USD Billion)
  • Figure 14.2 Likely Cost Savings: Distribution by Drug Discovery Steps (USD Billion)
  • Figure 14.3 Likely Cost Savings During Target Identification / Validation, Till 2035 (USD Billion)
  • Figure 14.4 Likely Cost Savings During Hit Generation / Lead Identification, Till 2035 (USD Billion)
  • Figure 14.5 Likely Cost Savings During Lead Optimization, Till 2035 (USD Billion)
  • Figure 14.6 Likely Cost Savings: Distribution by Target Therapeutic Area (USD Billion)
  • Figure 14.7 Likely Cost Savings for Drugs Targeting Oncological Disorders, Till 2035 (USD Billion)
  • Figure 14.8 Likely Cost Savings for Drugs Targeting Neurological Disorders, Till 2035 (USD Billion)
  • Figure 14.9 Likely Cost Savings for Drugs Targeting Infectious Diseases, Till 2035 (USD Billion)
  • Figure 14.10 Likely Cost Savings for Drugs Targeting Respiratory Disorders, Till 2035 (USD Billion)
  • Figure 14.11 Likely Cost Savings for Drugs Targeting Cardiovascular Disorders, Till 2035 (USD Billion)
  • Figure 14.12 Likely Cost Savings for Drugs Targeting Endocrine Disorders, Till 2035 (USD Billion)
  • Figure 14.13 Likely Cost Savings for Drugs Targeting Gastrointestinal Disorders, Till 2035 (USD Billion)
  • Figure 14.14 Likely Cost Savings for Drugs Targeting Musculoskeletal Disorders, Till 2035 (USD Billion)
  • Figure 14.15 Likely Cost Savings for Drugs Targeting Immunological Disorders, Till 2035 (USD Billion)
  • Figure 14.16 Likely Cost Savings for Drugs Targeting Dermatological Disorders, Till 2035 (USD Billion)
  • Figure 14.17 Likely Cost Savings for Drugs Targeting Other Disorders, Till 2035 (USD Billion)
  • Figure 14.18 Likely Cost Savings: Distribution by Geography (USD Billion)
  • Figure 14.19 Likely Cost Savings in North America, Till 2035 (USD Billion)
  • Figure 14.20 Likely Cost Savings in Europe, Till 2035 (USD Billion)
  • Figure 14.21 Likely Cost Savings in Asia Pacific, Till 2035 (USD Billion)
  • Figure 14.22 Likely Cost Savings in MENA, Till 2035 (USD Billion)
  • Figure 14.23 Likely Cost Savings in Latin America, Till 2035 (USD Billion)
  • Figure 14.24 Likely Cost Savings in Rest of the World, Till 2035 (USD Billion)
  • Figure 15.1 Global AI-based Drug Discovery Market, Till 2035 (USD Billion)
  • Figure 15.2 AI-based Drug Discovery Market: Distribution by Drug Discovery Steps (USD Billion)
  • Figure 15.3 AI-based Drug Discovery Market for Target Identification / Validation, Till 2035 (USD Billion)
  • Figure 15.4 AI-based Drug Discovery Market for Hit Generation / Lead Identification, Till 2035 (USD Billion)
  • Figure 15.5 AI-based Drug Discovery Market for Lead Optimization, Till 2035 (USD Billion)
  • Figure 15.6 AI-based Drug Discovery Market: Distribution by Target Therapeutic Area (USD Billion)
  • Figure 15.7 AI-based Drug Discovery Market for Oncological Disorders, Till 2035 (USD Billion)
  • Figure 15.8 AI-based Drug Discovery Market for Neurological Disorders Till 2035 (USD Billion)
  • Figure 15.9 AI-based Drug Discovery Market for Infectious Diseases, Till 2035 (USD Billion)
  • Figure 15.10 AI-based Drug Discovery Market for Respiratory Disorders, Till 2035 (USD Billion)
  • Figure 15.11 AI-based Drug Discovery Market for Cardiovascular Disorders, Till 2035 (USD Billion)
  • Figure 15.12 AI-based Drug Discovery Market for Endocrine Disorders, Till 2035 (USD Billion)
  • Figure 15.13 AI-based Drug Discovery Market for Gastrointestinal Disorders, Till 2035 (USD Billion)
  • Figure 15.14 AI-based Drug Discovery Market for Musculoskeletal Disorders, Till 2035 (USD Billion)
  • Figure 15.15 AI-based Drug Discovery Market for Immunological Disorders, Till 2035 (USD Billion)
  • Figure 15.16 AI-based Drug Discovery Market for Dermatological Disorders, Till 2035 (USD Billion)
  • Figure 15.17 AI-based Drug Discovery Market for Other Disorders, Till 2035 (USD Billion)
  • Figure 15.18 AI-based Drug Discovery Market: Distribution by Geography, Till 2035 (USD Billion)
  • Figure 15.19 AI-based Drug Discovery Market in North America, Till 2035 (USD Billion)
  • Figure 15.20 AI-based Drug Discovery Market in the US, Till 2035 (USD Billion)
  • Figure 15.21 AI-based Drug Discovery Market in Canada, Till 2035 (USD Billion)
  • Figure 15.22 AI-based Drug Discovery Market in Europe, Till 2035 (USD Billion)
  • Figure 15.23 AI-based Drug Discovery Market in UK, Till 2035 (USD Billion)
  • Figure 15.24 AI-based Drug Discovery Market in France, Till 2035 (USD Billion)
  • Figure 15.25 AI-based Drug Discovery Market in Germany, Till 2035 (USD Billion)
  • Figure 15.26 AI-based Drug Discovery Market in Spain, Till 2035 (USD Billion)
  • Figure 15.27 AI-based Drug Discovery Market in Italy, Till 2035 (USD Billion)
  • Figure 15.28 AI-based Drug Discovery Market in Rest of Europe (USD Billion)
  • Figure 15.29 AI-based Drug Discovery Market in Asia Pacific, Till 2035 (USD Billion)
  • Figure 15.30 AI-based Drug Discovery Market in China, Till 2035 (USD Billion)
  • Figure 15.31 AI-based Drug Discovery Market in India, Till 2035 (USD Billion)
  • Figure 15.32 AI-based Drug Discovery Market in Japan, Till 2035 (USD Billion)
  • Figure 15.33 AI-based Drug Discovery Market in Australia, Till 2035 (USD Billion)
  • Figure 15.34 AI-based Drug Discovery Market in South Korea, Till 2035 (USD Billion)
  • Figure 15.35 AI-based Drug Discovery Market in MENA, Till 2035 (USD Billion)
  • Figure 15.36 AI-based Drug Discovery Market in Saudi Arabia, Till 2035 (USD Billion)
  • Figure 15.37 AI-based Drug Discovery Market in UAE, Till 2035 (USD Billion)
  • Figure 15.38 AI-based Drug Discovery Market in Iran, Till 2035 (USD Billion)
  • Figure 15.39 AI-based Drug Discovery Market in Latin America, Till 2035 (USD Billion)
  • Figure 15.40 AI-based Drug Discovery Market in Argentina, Till 2035 (USD Billion)
  • Figure 15.41 AI-based Drug Discovery Market in Rest of the World, Till 2035 (USD Billion)
  • Figure 16.1 Concluding Remarks: Current Market Landscape
  • Figure 16.2 Concluding Remarks: Partnerships and Collaborations
  • Figure 16.3 Concluding Remarks: Funding and Investments
  • Figure 16.4 Concluding Remarks: Patent Analysis
  • Figure 16.5 Concluding Remarks: Company Valuation Analysis
  • Figure 16.6 Concluding Remarks: Cost Saving Analysis
  • Figure 16.7 Concluding Remarks: Market Forecast
Have a question?
Picture

Jeroen Van Heghe

Manager - EMEA

+32-2-535-7543

Picture

Christine Sirois

Manager - Americas

+1-860-674-8796

Questions? Please give us a call or visit the contact form.
Hi, how can we help?
Contact us!