
PUBLISHER: Roots Analysis | PRODUCT CODE: 1737053

PUBLISHER: Roots Analysis | PRODUCT CODE: 1737053
RNAi Therapeutics and Technology Market by Target Therapeutic Areas, Route of Administration, Type of RNAi Molecule, Geographical Regions and Leading Industry Players
RNAi THERAPEUTICS AND TECHNOLOGY MARKET: OVERVIEW
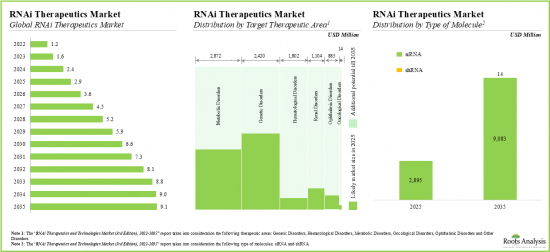
As per Roots Analysis, the global RNAi therapeutics and technology market is estimated to grow from USD 1.2 billion in the current year to USD 9.2 billion by 2035, at a CAGR of 17% during the forecast period, till 2035.
The market sizing and opportunity analysis has been segmented across the following parameters:
Target Therapeutic Areas
- Genetic Disorders
- Metabolic Disorders
- Oncological Disorders
- Genetic Disorders
- Hematological Disorders
- Ophthalmic Disorders
- Other Disorders
Route of Administration
- Subcutaneous
- Intravenous
- Ophthalmic
- Intradermal
Type of RNAi Molecule
- siRNA
- shRNA
Geographical Regions
- North America
- Europe
- Asia-Pacific and Rest of the World
Sales Forecast
- Onpattro(R)
- Givlaari(TM)
- Leqvio(R)
- Oxlumo(TM)
- Fitusiran
- Vutrisiran
- SYL-1001
- Vigil-EWS
- Nedosiran
RNAi THERAPEUTICS AND TECHNOLOGY MARKET: GROWTH AND TRENDS
RNAi therapeutics refer to the novel class of innovative drugs that harness the RNA interference (RNAi) property of genes for the regulation of the expression system naturally inside the cells. Fundamentally, RNAi is a natural process of post-transcriptional gene silencing, involving short strands of nucleic acids. Cells use this process to silence and / or inhibit gene expression, via targeted degradation of specific (unwanted) mRNA molecules. From an application perspective, the gene specificity of RNAi is the primary reason for it being used in the development of therapies. In theory, RNAi-based therapeutics are capable of treating a myriad of disease indications, such as age-related macular degeneration (AMD), hepatitis C and various forms of cancer, which are actually hard to treat, using conventional pharmacological options.
It is interesting to note that in, 2018, Patisiran became the first RNAi-based therapy to receive approval from the FDA to treat patients suffering from chronic diseases. Since then, six novel RNAi-based therapies, namely, Givosiran (2019), Lumasiran (2020), Inclisiran (2021), Vutrisiran (2022) and Nedosiran (2023), have received approval from the FDA. Notably, more than 200 RNAi therapeutics are currently being evaluated across different clinical trials for the treatment of a broad array of disease indications. Additionally, several industrial players are increasing their research efforts for the development of RNA interference technology, aiming to enhance efficacy and reduce effector molecule concentrations based on the anti-sense approach. Driven by ongoing research, it is estimated that the market will grow significantly during the forecast period.
RNAI THERAPEUTICS AND TECHNOLOGY MARKET: KEY INSIGHTS
The report delves into the current state of the RNAi therapeutics and technology market and identifies potential growth opportunities within industry. Some key findings from the report include:
- Presently, more than 200 RNAi drug candidates are being investigated across various stages of development for the treatment of a myriad of disease indications; six such drug products have already received approval.
- Nearly 80% of the drug candidates are being developed using siRNA molecules; over 40% of the RNAi drugs are designed for delivery via the subcutaneous route.
- More than 45 companies, including several startups, are engaged in the development of RNAi therapeutics; the R&D efforts are being led by players located in the US.
- The market is characterized by the presence of well-established players; the relatively less experienced players also possess a robust pipeline of early-stage candidates.
- The rising interest in this rapidly evolving domain can be validated by the partnerships inked in recent years; the majority of the deals were signed for research and development purposes.
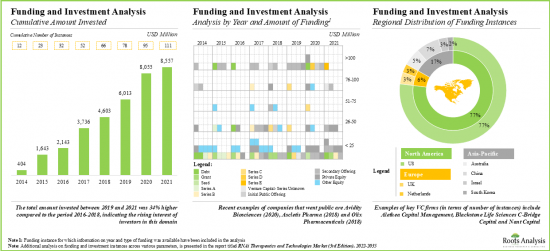
- In order to tap the lucrative opportunity, venture capital firms / strategic investors have actively supported the ongoing initiatives; over USD 8.5 billion has been invested across 110+ instances in the past few years.
- Notably, significant clinical activity, in terms of registered clinical trials, was observed; over 60% of the clinical studies are being conducted in parallel comparison of two groups of treatments.
- A number of scientists from renowned universities, presently involved in several clinical development efforts of RNAi therapeutics, have emerged as key opinion leaders.
- More than 55 innovative drug development and delivery technology platforms are presently being leveraged by industry stakeholders for the discovery, development and delivery of RNAi therapeutics.
- The healthy growth in published scientific literature over the last few years signifies the focused efforts being led by researchers to identify and develop novel technologies and therapeutic interventions.
- Over 2,100 patents have been granted / filed by academia and industry stakeholders in the last six years, exclusively for RNAi therapeutics and associated delivery technologies.
- In 2035, close to 60% of the demand for siRNA drugs is likely to be generated in North America for the treatment of patients suffering from various genetic disorders.
- In order to efficiently monetize their proprietary offerings, drug developers are actively exploring diverse commercialization strategies applicable across different stages of a product's launch cycle.
- The market opportunity associated with RNAi therapeutics is anticipated to witness an annualized growth rate of 17%, over the coming decade.
- The overall opportunity is likely to be well distributed across different routes of administration, market players and countries / regions.
RNAI THERAPEUTICS AND TECHNOLOGY MARKET: KEY SEGMENTS
Genetic Disorders Occupy the Largest Share of the Global RNAi Therapeutics and Technology Market
Based on the target therapeutic area, the market is segmented into oncological disorders, genetic disorders, metabolic disorders, hematological disorders, ophthalmic disorders and other disorders. At present, the genetic disorders segment holds the maximum share of the global RNAi therapeutics and technology market. This trend is likely to change in the forthcoming years.
By Route of Administration, RNAi Therapeutics and Technology focused on Intradermal Route of Administration is the Fastest Growing Segment of the Global RNAi Therapeutics and Technology Market During the Forecast Period
Based on the route of administration, the market is segmented into subcutaneous, intramuscular, ophthalmic and intradermal routes. Currently, the RNAi therapeutics and technology market is dominated by subcutaneous route of administration segment, capturing the highest proportion of the global RNAi therapeutics and technology market. It is worth highlighting that the global RNAi therapeutics and technology market for intradermal route of administration segment is likely to grow at a relatively higher CAGR.
siRNA Segment Occupies the Largest Share of the RNAi Therapeutics and Technology Market by Type of RNAi Molecule
Based on the type of RNAi molecule, the market is segmented into siRNA and shRNA. At present, siRNA segment by type of RNAi molecule holds the maximum share of the global RNAi therapeutics and technology market. Notably, shRNA segment is likely to grow at a relatively higher CAGR.
North America Accounts for the Largest Share of the Market
Based on the geographical regions, the market is segmented into North America, Europe, and Asia-Pacific and Rest of the World. The majority share is expected to be captured by players based in North America and Europe.
Example Players in the RNAi Therapeutics and Technology Market
- AgelessRx
- ANOVA Institute for Regenerative Medicine
- Betterhumans
- BioAge Labs
- BioXcellerator
- Cambrian Biopharma
- Gero.ai
- Mayo Clinic
- Rejuvenate Bio
- UT Health San Antonio
RNAI THERAPEUTICS AND TECHNOLOGY MARKET: RESEARCH COVERAGE
- Market Sizing and Opportunity Analysis: The report features an in-depth analysis of the global RNAi therapeutics and technology market, focusing on key market segments, including [A] key therapeutic areas, [B] route of administration, [C] type of RNAi molecule, [D] geographical regions and [E] leading players.
- RNAi Therapeutics Market Landscape: A comprehensive evaluation of the RNAi pipeline candidates, based on several relevant parameters, such as [A] phase of development (marketed, clinical, and preclinical / discovery stage) of pipeline candidates, [B] target disease indication(s), [C] key therapeutic areas (oncological disorders, infectious diseases, genetic disorders, ophthalmic diseases, respiratory disorders, hepatic disorders, metabolic disorders, cardiovascular disorders, dermatological disorders and other disorders), [D] type of RNAi molecule (siRNA, miRNA, shRNA, shRNA and DNA), [E] target gene, [F] route of administration and [G] special drug designations (if any).
- RNAi Therapeutics Developers Market Landscape: A comprehensive evaluation of the companies engaged in this domain, based on several relevant parameters, such as [A] year of establishment, [B] company size and [C] location of headquarters.
- Company Competitiveness Analysis: A comprehensive competitive analysis of RNAi therapeutic developers, examining factors, such as [A] developer strength and [B] product portfolio strength.
- Drug Profiles: In-depth profiles of key RNAi therapeutic drugs, focusing on [A] current development status of the drug, [B] developer details, [C] mechanism of action, [D] route of administration, [E] affiliated technology / platform (if available), [F] dosage and [G] and recent clinical trial results.
- RNAi Therapeutics Technology Platforms Market Landscape: A comprehensive evaluation of the RNAi therapeutics technology platforms and their developers, based on several relevant parameters, such as [A] purpose of technology, [B] type of molecule (s) delivered and [C] type of cell (s) / tissue (s) targeted, [D] year of their establishment, [E] company size and [F] location of headquarters. Additionally, a brief overview of the profiles of key RNAi-based drug discovery / development technology platforms and drug delivery technologies (shortlisted on the basis of competitiveness score).
- Technology Competitiveness Analysis: A comprehensive competitive analysis of RNAi technologies, examining factors, such as [A] supplier power and [B] key technology specifications.
- Target Indications: A comprehensive analysis of target indications (segregated by various therapeutic areas) that are currently being focused on the companies engaged in the development of RNAi therapeutics.
- Clinical Trial Analysis: An insightful analysis of clinical studies, based on several parameters, such as [A] trial registration year, [B] current status, [C] phase of development, [D] type of RNAi molecule, [E] enrolled patient population and [F] regional distribution of trials.
- Key Opinion Leaders (KOLs]: An in-depth 2X2 analysis that emphasizes the key opinion leaders in this domain, shortlisted based on their contributions (in terms of involvement in various clinical studies) in this field.
- Patent Analysis: An in-depth analysis of patents filed / granted till date in the RNAi therapeutics domain, based on various relevant parameters, such as [A] type of patent, [B] publication year, [C] regional applicability, [D] CPC symbols, [E] emerging focus areas, [F] leading industry / non-industry players and [G] patent valuation.
- Publication Analysis: An insightful analysis of 3,000 peer-reviewed scientific articles in the RNAi therapeutics domain, based on various relevant parameters, such as [A] year of publication, [B] type of publication, [C] popular keywords, [D] top journals, [E] top publishers, [F] key copyright holders and [G] key funding institutes.
- Partnerships and Collaborations: An in-depth analysis of the deals inked by stakeholders in the RNAi therapeutics and technology market, based on several parameters, such as [A] year of partnership, [B] type of partnership, [C] target disease indication, [D] therapeutic area, [E] type of RNAi molecule, [F] financial details (wherever applicable), [G] focus area of collaboration and [E] most active players (in terms of number of partnerships).
- Funding and Investment Analysis: An in-depth analysis of the fundings raised by RNAi therapeutics and technology companies, based on relevant parameters, such as [A] year of funding, [B] type of funding, [C] amount invested, [D] type of RNAi molecule, [E] most active players and [F] key investors.
- Case Study 1: A detailed discussion on the various commercialization strategies that can be adopted by the companies engaged in this domain, based on [A] different stages of therapy development, including prior to drug launch, at / during drug launch and post-marketing of the drug.
- Case Study 2: An in-depth discussion on the use of miRNA as a potential biomarker, along with a list of diagnostic kits that are either available in the market, or likely to be approved in the foreseen future.
- RNAi Therapeutics Service Providers Market Landscape: A comprehensive analysis of the companies that are actively supporting the development of RNAi therapeutics market, including contract manufacturers, contract researcher organizations and other service providers based on various parameters, such as [A] type of service provider, [B] location of their headquarters and [C] type of RNAi molecule developed.
- Demand Analysis: A detailed analysis of the annual clinical and commercial demand for RNAi therapeutics, based on the target patient population in ongoing and planned clinical trials of RNAi therapeutics, sponsored by both industry and non-industry players.
- SWOT Analysis: An analysis of industry affiliated trends, opportunities and challenges, which are likely to impact the evolution of RNAi therapeutics market; it includes a Harvey ball analysis, assessing the relative impact of each SWOT parameter on industry dynamics.
KEY QUESTIONS ANSWERED IN THIS REPORT
- How many companies are currently engaged in this market?
- Which are the leading companies in this market?
- What factors are likely to influence the evolution of this market?
- What is the current and future market size?
- What is the CAGR of this market?
- How is the current and future market opportunity likely to be distributed across key market segments?
REASONS TO BUY THIS REPORT
- The report provides a comprehensive market analysis, offering detailed revenue projections of the overall market and its specific sub-segments. This information is valuable to both established market leaders and emerging entrants.
- Stakeholders can leverage the report to gain a deeper understanding of the competitive dynamics within the market. By analyzing the competitive landscape, businesses can make informed decisions to optimize their market positioning and develop effective go-to-market strategies.
- The report offers stakeholders a comprehensive overview of the market, including key drivers, barriers, opportunities, and challenges. This information empowers stakeholders to stay abreast of market trends and make data-driven decisions to capitalize on growth prospects.
ADDITIONAL BENEFITS
- Complimentary PPT Insights Packs
- Complimentary Excel Data Packs for all Analytical Modules in the Report
- 15% Free Content Customization
- Detailed Report Walkthrough Session with Research Team
- Free Updated report if the report is 6-12 months old or older
TABLE OF CONTENTS
1. PREFACE
- 1.1. Scope of the Report
- 1.2. Research Methodology
- 1.3. Market Segmentations
- 1.4. Key Questions Answered
- 1.5. Chapter Outlines
2. EXECUTIVE SUMMARY
3. INTRODUCTION
- 3.1. Chapter Overview
- 3.2. Key Milestones and Historical Trends
- 3.2.1. Discovery of RNAi
- 3.2.2. RNAi Therapy Development Efforts
- 3.3. Mechanism of RNAi
- 3.3.1. Components of RNAi
- 3.3.2. Cellular Mechanism
- 3.4. Types of RNAi Molecules
- 3.4.1. siRNA
- 3.4.2. miRNA
- 3.4.3. shRNA
- 3.5. Applications of RNAi
- 3.5.1. Functional Genomics
- 3.5.2. Therapeutics
- 3.5.3. Biotechnology
- 3.5.4. Genome-scale Screening
- 3.6. Advantages and Disadvantages of RNAi
- 3.6.1. Advantages of RNAi
- 3.6.2. Disadvantages of RNAi
- 3.6.3. Case Study: Concerns Discussed During Regulatory Submissions in Clinic
- 3.7. Future Perspectives
4. MARKET OVERVIEW
- 4.1. Chapter Overview
- 4.2. RNAi Therapeutics: Marketed and Development Pipeline
- 4.2.1. Analysis by Type of RNAi Molecule
- 4.2.2. Analysis by Phase of Development
- 4.2.3. Analysis by Type of Molecule and Phase of Development
- 4.2.4. Analysis by Target Gene
- 4.2.5. Analysis by Therapeutic Area
- 4.2.6. Analysis by Route of Administration
- 4.2.7. RNAi Therapeutics: Special Designations
- 4.2.8. Key Players
5. COMPETITIVE LANDSCAPE
- 5.1. Chapter Overview
- 5.2. RNAi Therapeutics: Developer Landscape
- 5.2.1. Analysis by Year of Establishment
- 5.2.2. Analysis by Company Size
- 5.2.3. Analysis by Location of Headquarters
- 5.2.4. Analysis by Location of Headquarters (Country-wise)
- 5.2.5. Key Players: Analysis by Number of Drug Candidates
- 5.3. RNAi Therapeutics: Regional Landscape
6. COMPANY COMPETITIVENESS ANALYSIS
- 6.1. Chapter Overview
- 6.2. Assumptions / Key Parameters
- 6.3. Methodology
- 6.4. Company Competitive Analysis: RNAi Therapeutics Developers
- 6.5. Developers based in North America
- 6.6. Developers based in Europe
- 6.7. Developers based in Asia-Pacific
7. APPROVED AND LATE-STAGE RNAi THERAPEUTICS
- 7.1. Chapter Overview
- 7.2. Onpattro(R)
- 7.2.1. Drug Overview
- 7.2.2. Technology Overview
- 7.2.3. Current Development Status
- 7.2.4. Recent Clinical Trial Results
- 7.2.5. Recent Partnerships
- 7.3. Givlaari(R)
- 7.3.1. Drug Overview
- 7.3.2. Technology Overview
- 7.3.3. Current Development Status
- 7.3.4. Recent Clinical Trial Results
- 7.3.5. Recent Partnerships
- 7.4. Leqvio(R)
- 7.4.1. Drug Overview
- 7.4.2. Technology Overview
- 7.4.3. Current Development Status
- 7.4.4. Recent Clinical Trial Results
- 7.4.5. Recent Partnerships
- 7.5. Oxlumo(TM)
- 7.5.1. Drug Overview
- 7.5.2. Technology Overview
- 7.5.3. Current Development Status
- 7.5.4. Recent Clinical Trial Results
- 7.5.5. Recent Partnerships
- 7.6. Fitusiran
- 7.6.1. Drug Overview
- 7.6.2. Technology Overview
- 7.6.3. Current Development Status
- 7.6.4. Recent Clinical Trial Results
- 7.7. Vutrisiran
- 7.7.1. Drug Overview
- 7.7.2. Technology Overview
- 7.7.3. Current Development Status
- 7.7.4. Recent Clinical Trial Results
- 7.8. SYL 1001
- 7.8.1. Drug Overview
- 7.8.2. Technology Overview
- 7.8.3. Current Development Status
- 7.8.4. Recent Clinical Trial Results
- 7.9. Vigil-EWS
- 7.9.1. Drug Overview
- 7.9.2. Technology Overview
- 7.9.3. Current Development Status
- 7.9.4. Recent Clinical Trial Results
- 7.10. SR-061
- 7.10.1. Drug Overview
- 7.10.2. Technology Overview
- 7.10.3. Current Development Status
- 7.11. Nedosiran
- 7.11.1. Drug Overview
- 7.11.2. Technology Overview
- 7.11.3. Current Development Status
- 7.11.4. Recent Clinical Trial Results
8. TECHNOLOGY PLATFORMS AND DELIVERY SYSTEMS
- 8.1. Chapter Overview
- 8.2. Components of RNAi Delivery Systems
- 8.2.1. RNAi Triggers
- 8.2.1.1. Asymmetric siRNA (cp-siRNA)
- 8.2.1.2. DNA Directed RNAi (ddRNAi)
- 8.2.1.3. Dicer Substrate siRNA (DsiRNA)
- 8.2.1.4. Naked siRNA
- 8.2.1.5. Self-Deliverable RNA (sd-RNA)
- 8.2.1.6. Self-Deliverable rxRNA (sd-rxRNA)
- 8.2.1.7. Unlocked Nucleobase Analog (UNA) Containing siRNA (UsiRNA)
- 8.2.2. Technology Platforms and Delivery Systems
- 8.2.2.1. Analysis by Purpose of Technology
- 8.2.2.2. Analysis by Type of Molecule (s) Delivered
- 8.2.2.3. Analysis by Type of Cell (s) / Tissue (s) Targeted
- 8.2.3. Technology Platforms: List of Developers
- 8.2.3.1. Analysis by Year of Establishment
- 8.2.3.2. Analysis by Company Size
- 8.2.3.3. Analysis by Location of Headquarters (Continent-wise)
- 8.2.3.4. Analysis by Location of Headquarters (Country-wise)
- 8.2.4. Technology Platform: Profiles
- 8.2.4.1. Conjugated Delivery Technologies
- 8.2.4.1.1. GalNAc Conjugate Delivery System, Alnylam Pharmaceuticals
- 8.2.4.1.1.1. Technology Overview
- 8.2.4.1.1.2. Pipeline Molecules in Development
- 8.2.4.1.1.3. Analyst's Perspective
- 8.2.4.1.2. Protein Nanoparticle (PNP) Delivery Technology, Ariz Precision Medicine
- 8.2.4.1.2.1. Technology Overview
- 8.2.4.1.2.2. Pipeline Molecules in Development
- 8.2.4.1.2.3. Analyst's Perspective
- 8.2.4.1.3 Targeted RNAi Molecule (TRiM) Platform, Arrowhead Pharmaceuticals
- 8.2.4.1.3.1. Technology Overview
- 8.2.4.1.3.2. Pipeline Molecules in Development
- 8.2.4.1.3.3. Analyst's Perspective
- 8.2.4.1.1. GalNAc Conjugate Delivery System, Alnylam Pharmaceuticals
- 8.2.4.2. Drug Discovery and Development Technologies
- 8.2.4.2.1. GalXC Conjugated RNAi Technology Platform, Dicerna Pharmaceuticals
- 8.2.4.2.1.1. Technology Overview
- 8.2.4.2.1.2. Pipeline Molecules in Development
- 8.2.4.2.1.3. Analyst's Perspective
- 8.2.4.2.2. The Vigil Platform, Gradalis
- 8.2.4.2.2.1. Technology Overview
- 8.2.4.2.2.2. Pipeline Molecules in Development
- 8.2.4.2.2.3. Analyst's Perspective
- 8.2.4.2.3. mRNAi GOLD Platform, Silence Therapeutics
- 8.2.4.2.3.1. Technology Overview
- 8.2.4.2.3.2. Pipeline Molecules in Development
- 8.2.4.2.3.3. Analyst's Perspective
- 8.2.4.2.1. GalXC Conjugated RNAi Technology Platform, Dicerna Pharmaceuticals
- 8.2.4.1. Conjugated Delivery Technologies
- 8.2.1. RNAi Triggers
9. TECHNOLOGY COMPETITIVENESS ANALYSIS
- 9.1. Chapter Overview
- 9.2. Assumptions / Key Parameters
- 9.3. Methodology
- 9.4. Technology Competitiveness Analysis: RNAi Therapeutics Technologies
- 9.4.1. Technology Competitiveness Analysis: Drug Delivery Technologies
- 9.4.2. Technology Competitiveness Analysis: Drug Discovery / Development Technologies
10. KEY THERAPEUTIC INDICATIONS
- 10.1. Chapter Overview
- 10.2. Oncological Disorders
- 10.2.1. Analysis by Target Indication and Phase of Development
- 10.2.2. Analysis by Type of RNAi Molecule
- 10.3. Infectious Diseases
- 10.3.1. Analysis by Target Indication and Phase of Development
- 10.3.2. Analysis by Type of RNAi Molecule
- 10.4. Metabolic Disorders
- 10.4.1. Analysis by Target Indication and Phase of Development
- 10.4.2. Analysis by Type of RNAi Molecule
- 10.5. Ophthalmic Diseases
- 10.5.1. Analysis by Target Indication and Phase of Development
- 10.5.2. Analysis by Type of RNAi Molecule
- 10.6. Genetic Disorders
- 10.6.1. Analysis by Target Indication and Phase of Development
- 10.6.2. Analysis by Type of RNAi Molecule
11. CLINICAL TRIAL ANALYSIS
- 11.1. Chapter Overview
- 11.2. Scope and Methodology
- 11.3. RNAi Therapeutics: Clinical Trial Analysis
- 11.3.1. Analysis by Trial Registration Year
- 11.3.2. Analysis by Trial Phase
- 11.3.3. Analysis by Trial Recruitment Status
- 11.3.4. Analysis by Type of Sponsor / Collaborator
- 11.3.5. Analysis by Type of RNAi Molecule and Trial Recruitment Status
- 11.3.6. Analysis by Therapeutic Area
- 11.3.7. Geographical Analysis by Number of Clinical Trials
- 11.3.8. Geographical Analysis by Number of Clinical Trials, Trial Phase and Recruitment Status
- 11.3.9. Geographical Analysis by Number of Clinical Trials and Type of RNAi Molecule
- 11.3.10. Geographical Analysis by Number of Clinical Trials, Type of RNAi Molecule and Trial Phase
- 11.3.11. Geographical Analysis by Number of Clinical Trials and Therapeutic Area
- 11.3.12. Geographical Analysis by Number of Clinical Trials, Therapeutic Area and Trial Phase
- 11.3.13. Geographical Analysis of Enrolled Patient Population by Location of Trial
- 11.3.14. Geographical Analysis of Enrolled Patient Population by Trial Phase and Trial Recruitment Status
- 11.3.15. Geographical Analysis of Enrolled Patient Population by Type of RNAi Molecule and Location of Trial
- 11.3.16. Geographical Analysis of Enrolled Patient Population by Type of RNAi Molecule, Trial Phase and Location of Trial
- 11.3.17. Geographical Analysis of Enrolled Patient Population by Therapeutic Area and Location of Trial
- 11.3.18. Geographical Analysis of Enrolled Patient Population by Therapeutic Area. Trial Phase and Location of Trial
- 11.4. Concluding Remarks
- 11.4.1. Key Therapeutic Candidates
- 11.4.2. Key Clinical Trials
12. KEY OPINION LEADERS
- 12.1. Chapter Overview
- 12.2. RNAi Therapeutics: Key Opinion Leaders
- 12.2.1. Analysis by Type of Organization
- 12.2.2. Analysis by Qualification
- 12.2.3. Analysis by Geographical Location of KOLs
- 12.2.4. Most Prominent Organizations: Analysis by Number of KOLs
- 12.2.5. KOL Activeness v/s KOL Strength
- 12.2.6. Most Prominent KOLs: Analysis by KOL Strength
- 12.2.7. Most Prominent KOLs: Comparison of RA Score and Third-Party Score
13. PATENT ANALYSIS
- 13.1. Chapter Overview
- 13.2. Scope and Methodology
- 13.3. RNAi Therapeutics: Patent Analysis
- 13.3.1. Analysis by Publication Year
- 13.3.2. Analysis by Patent Type and Publication Year
- 13.3.3. Analysis by CPC Code
- 13.3.4. Analysis by Type of Applicant
- 13.3.5. Analysis by Geography
- 13.3.5.1. Analysis by Geography: North American Scenario
- 13.3.5.2. Analysis by Geography: European Scenario
- 13.3.5.3. Analysis by Geography: Asia-Pacific Scenario
- 13.3.6. Emerging Focus Areas
- 13.3.7. Leading Players: Analysis by Number of Patents
- 13.4. RNAi Therapeutics: Patent Benchmarking Analysis
- 13.4.1. Analysis by Key Patent Characteristics
- 13.4.1.1. Arrowhead Pharmaceuticals and Sirna Therapeutics
- 13.4.1.2. Other Leading Patent Assignees
- 13.4.1. Analysis by Key Patent Characteristics
- 13.5. RNAi Therapeutics: Patent Valuation Analysis
14. PUBLICATION ANALYSIS
- 14.1. Chapter Overview
- 14.2. Scope and Methodology
- 14.3. Analysis by Year of Publication
- 14.4. Analysis by Type of Publication
- 14.5. Most Popular Keywords
- 14.6. Most Popular Journals: Analysis by Number of Publications
- 14.7. Most Popular Publisher: Analysis by Number of Publications
- 14.8. Most Popular Copyright Holders: Analysis by Number of Publications
- 14.9. Key Funding Institutes: Analysis by Number of Publications
15. PARTNERSHIPS AND COLLABORATIONS
- 15.1. Chapter Overview
- 15.2. Partnership Models
- 15.3. RNAi Therapeutics: Recent Partnerships and Collaborations
- 15.3.1. Analysis by Year of Partnership
- 15.3.2. Analysis by Type of Partnership
- 15.3.3. Analysis by Type of RNAi Molecule
- 15.3.4. Analysis by Scale of Partnership
- 15.3.5. Analysis by Therapeutic Area
- 15.3.6. Most Active Players: Analysis by Number of Partnerships
- 15.3.7. Regional Analysis
- 15.3.7.1. Country-wise Distribution
- 15.3.7.2. Intercontinental and Intracontinental Deals
16. FUNDING AND INVESTMENT ANALYSIS
- 16.1. Chapter Overview
- 16.2. Types of Funding
- 16.3. RNAi Therapeutics: Funding and Investment Analysis
- 16.3.1. Analysis by Cumulative Funding Instances, 2014-2021
- 16.3.2. Analysis by Amount Invested
- 16.3.3. Analysis by Type of Funding
- 16.3.4. Analysis by Year and Type of Funding
- 16.3.5. Analysis of Amount Invested Across Different Types of RNAi Molecules
- 16.3.6. Regional Analysis by Amount Invested
- 16.3.7. Most Active Players
- 16.3.8. Key Investors
- 16.4. Concluding Remarks
17. KEY COMMERCIALIZATION STRATEGIES
- 17.1. Chapter Overview
- 17.2. Successful Drug Launch Strategy: ROOTS Framework
- 17.3. Successful Drug Launch Strategy: Product Differentiation
- 17.4. Commonly Adopted Commercialization Strategies based on Stage of Development of the Product
- 17.5. Approved RNAi Therapeutics
- 17.6. Key Commercialization Strategies Adopted by RNAi-based Therapy Developers
- 17.6.1. Strategies Adopted Before Therapy Approval
- 17.6.1.1. Participation in Global Events
- 17.6.1.1.1. Onpattro
- 17.6.1.1.2. Givlaari
- 17.6.1.1.3. Oxlumo
- 17.6.1.2. Collaboration with Stakeholders and Pharmaceutical Firms
- 17.6.1.2.1. Leqvio
- 17.6.1.3. Indication Expansion
- 17.6.1.3.1. Onpattro
- 17.6.1.3.2. Givlaari
- 17.6.1.3.3. Oxlumo
- 17.6.1.3.4. Leqvio
- 17.6.1.1. Participation in Global Events
- 17.6.2. Strategies Adopted During / Post Therapy Approval
- 17.6.2.1. Participation in Global Events
- 17.6.2.1.1. Onpattro
- 17.6.2.1.2. Leqvio
- 17.6.2.2. Geographical Expansion
- 17.6.2.2.1. Onpattro
- 17.6.2.2.2. Givlaari
- 17.6.2.2.3. Oxlumo
- 17.6.2.2.4. Leqvio
- 17.6.2.3. Patient Assistance Programs
- 17.6.2.3.1. Onpattro
- 17.6.2.3.2. Givlaari
- 17.6.2.3.3. Oxlumo
- 17.6.2.4. Awareness Through Product Websites
- 17.6.2.5. Collaboration with Stakeholders and Pharmaceutical Firms
- 17.6.2.5.1. Onpattro
- 17.6.2.5.2. Givlaari
- 17.6.2.5.3. Oxlumo
- 17.6.2.5.4. Leqvio
- 17.6.2.6. Aligning with Government Initiatives to Ensure High Adoption Rate
- 17.6.2.6.1. Onpattro
- 17.6.2.6.2. Givlaari
- 17.6.2.6.3. Leqvio
- 17.6.2.1. Participation in Global Events
- 17.6.1. Strategies Adopted Before Therapy Approval
- 17.7. Concluding Remarks
18. RNAi IN DIAGNOSTICS
- 18.1. Chapter Overview
- 18.2. Key Characteristics of Biomarkers
- 18.3. Circulating miRNA Biomarkers
- 18.4. miRNA Biomarkers in Oncological Disorders
- 18.4.1. Importance of Early Cancer Detection
- 18.4.2. Cancer Screening and Diagnosis
- 18.4.3. Conventional Cancer Diagnostics
- 18.4.3.1. Biopsy
- 18.4.4. Need for Non-Invasive Approaches
- 18.4.5. Key Indications
- 18.4.5.1. Breast Cancer
- 18.4.5.2. Colorectal Cancer
- 18.4.5.3. Gastric Cancer
- 18.4.5.4. Hematological Cancer
- 18.4.5.4.1. Acute Myeloid Leukemia
- 18.4.5.4.2 Lymphoma
- 18.4.5.5. Lung Cancer
- 18.4.5.6. Prostate Cancer
- 18.5. miRNA Biomarkers in Cardiovascular Diseases
- 18.5.1. Key Indications
- 18.5.1.1. Coronary Artery Disease
- 18.5.1.2. Myocardial Infarction
- 18.5.1. Key Indications
- 18.6. miRNA Based Diagnostic Tests
19. RNAi THERAPEUTICS SERVICE PROVIDERS
- 19.1. Chapter Overview
- 19.2. Analysis by Types of Service Providers
- 19.3. RNAi Therapeutics: List of CROs
- 19.3.1. Analysis by Year of Establishment
- 19.3.2. Analysis by Location of Headquarters
- 19.3.3. Analysis by Company Size
- 19.3.4. Analysis by Type of RNAi Molecule
- 19.4. RNAi Therapeutics: List of CMOs
- 19.4.1. Analysis by Year of Establishment
- 19.4.2. Analysis by Location of Headquarters
- 19.4.3. Analysis by Company Size
- 19.4.4. Analysis by Type of RNAi Molecule
- 19.5. RNAi Therapeutics: List of Consumables and Other Service Providers
- 19.5.1. Analysis by Year of Establishment
- 19.5.2. Analysis by Location of Headquarters
- 19.5.3. Analysis by Company Size
- 19.5.4. Analysis by Type of RNAi Molecule
20. DEMAND ANALYSIS
- 20.1. Chapter Overview
- 20.2. Methodology
- 20.3. Global Demand for RNAi Therapeutics, 2022-2035
- 20.3.1. Analysis by Therapeutic Approach
- 20.3.2. Analysis by Target Therapeutic Area
- 20.3.3. Analysis by Route of Administration
- 20.3.4. Analysis by Key Players
- 20.3.5. Analysis by Geography
21. MARKET SIZING AND OPPORTUNITY ANALYSIS
- 21.1. Chapter Overview
- 21.2. Scope and Limitations
- 21.3. Key Assumptions and Forecast Methodology
- 21.4. Overall RNAi Therapeutics Market, 2022-2035
- 21.4.1. RNAi Therapeutics Market: Analysis by Type of RNAi Molecule
- 21.4.2. RNAi Therapeutics Market: Analysis by Therapeutic Area
- 21.4.3. RNAi Therapeutics Market: Analysis by Route of Administration
- 21.4.4. RNAi Therapeutics Market: Share of Leading Players
- 21.4.5. RNAi Therapeutics Market: Analysis by Geography
- 21.5. RNAi Therapeutics Market: Value Creation Analysis
- 21.6. RNAi Therapeutics Market: Product-wise Sales Forecasts
- 21.6.1. Onpattro(R)
- 21.6.1.1. Target Patient Population
- 21.6.1.2. Sales Forecast
- 21.6.1.3. Net Present Value
- 21.6.1.4. Value Creation Analysis
- 21.6.2. Givlaari(TM)
- 21.6.2.1. Target Patient Population
- 21.6.2.2. Sales Forecast
- 21.6.2.3. Net Present Value
- 21.6.2.4. Value Creation Analysis
- 21.6.3. Leqvio(R)
- 21.6.3.1. Target Patient Population
- 21.6.3.2. Sales Forecast
- 21.6.3.3. Net Present Value
- 21.6.3.4. Value Creation Analysis
- 21.6.4. Oxlumo(TM)
- 21.6.4.1. Target Patient Population
- 21.6.4.2. Sales Forecast
- 21.6.4.3. Net Present Value
- 21.6.4.4. Value Creation Analysis
- 21.6.5. Fitusiran
- 21.6.5.1. Target Patient Population
- 21.6.5.2. Sales Forecast
- 21.6.5.3. Net Present Value
- 21.6.5.4. Value Creation Analysis
- 21.6.6. Vutrisiran
- 21.6.6.1. Target Patient Population
- 21.6.6.2. Sales Forecast
- 21.6.6.3. Net Present Value
- 21.6.6.4. Value Creation Analysis
- 21.6.7. SYL-1001
- 21.6.7.1. Target Patient Population
- 21.6.7.2. Sales Forecast
- 21.6.7.3. Net Present Value
- 21.6.7.4. Value Creation Analysis
- 21.6.8. Vigil-EWS
- 21.6.8.1. Target Patient Population
- 21.6.8.2. Sales Forecast
- 21.6.8.3. Net Present Value
- 21.6.8.4. Value Creation Analysis
- 21.6.9. Nedosiran
- 21.6.9.1. Target Patient Population
- 21.6.9.2. Sales Forecast
- 21.6.9.3. Net Present Value
- 21.6.9.4. Value Creation Analysis
- 21.6.1. Onpattro(R)
22. SWOT ANALYSIS
- 22.1. Chapter Overview
- 22.2. Strengths
- 22.3. Weaknesses
- 22.4. Opportunities
- 22.5. Threats
- 22.6. Comparison of SWOT Factors
- 22.6.1 Concluding Remarks
23. INTERVIEW TRANSCRIPT(S)
24. CONCLUSION
- 24.1. Chapter Overview
- 24.2. Key Takeaways
25. APPENDIX 1: TABULATED DATA
26. APPENDIX 2: LIST OF COMPANIES AND ORGANIZATIONS
List of Tables
- Table 3.1 Merits and Demerits of RNAi Delivery Systems
- Table 3.2 Comparison between siRNA, miRNA and shRNA
- Table 4.1 RNAi Therapeutics: Marketed and Development Pipeline
- Table 4.2 RNAi Therapeutics: Information on Special Drug Designation
- Table 5.1 RNAi Therapeutics: List of Developers
- Table 7.1 RNAi Therapeutics: List of Marketed and Approved Products
- Table 7.2 Onpattro(R) (Patisiran): Drug Overview
- Table 7.3 Onpattro(R) (Patisiran): Information on Completed and Active Clinical Trials
- Table 7.4 Givlaari(R) (ALN-AS1): Drug Overview
- Table 7.5 Givlaari(R): Information on Completed and Active Clinical Trials
- Table 7.6 Leqvio(R) (Inclisiran): Drug Overview
- Table 7.7 Leqvio(R) (Inclisiran): Information on Completed and Active Clinical Trials
- Table 7.8 Oxlumo(R) (Lumasiran): Drug Overview
- Table 7.9 Oxlumo(R) (Lumasiran): Information on Completed and Active Clinical Trials
- Table 7.10 Fitusiran (ALN-AT3): Drug Overview
- Table 7.11 Fitusiran (ALN-AT3): Information on Completed and Active Clinical Trials
- Table 7.12 Vutrisiran (ALN-TTRsc02): Drug Overview
- Table 7.13 Vutrisiran (ALN-TTRsc02): Information on Completed and Active Clinical Trials
- Table 7.14 SYL1001(Tivanisiran): Drug Overview
- Table 7.15 SYL1001(Tivanisiran): Information on Completed and Active Clinical Trials
- Table 7.16 Vigil-EWS: Drug Overview
- Table 7.17 Vigil-EWS: Information on Completed and Active Clinical Trials
- Table 7.18 Nedosiran: Drug Overview
- Table 7.19 Nedosiran: Completed and Active Clinical Trials
- Table 8.1 Self-deliverable RNA molecules
- Table 8.2 List of RNAi Technology / Platforms
- Table 8.3 List of RNAi Technology Developers
- Table 8.4 ESC-GalNAc: Pipeline Molecules
- Table 8.5 Protein Nanoparticle Delivery Technology: Pipeline Molecules
- Table 8.6 TRiM: Pipeline Molecules
- Table 8.7 GalXC: Pipeline Molecules
- Table 8.8 Vigil: Pipeline Molecules
- Table 8.9 mRNAi GOLD Platform: Pipeline Molecules
- Table 11.1 Clinical Trial Analysis: Key Therapeutic Candidates
- Table 11.2 Clinical Trial Analysis: Key Clinical Trials
- Table 12.1 Key Opinion Leaders: List of Principal Investigators Involved in Clinical Trials
- Table 13.1 Patent Analysis: CPC Code Definitions
- Table 13.2 Patent Analysis: Most Popular CPC Codes
- Table 13.3 Patent Analysis: List of Top CPC Codes
- Table 13.4 Patent Analysis: Summary of Benchmarking Analysis
- Table 13.5 Patent Analysis: List of Leading Patents (by Highest Relative Valuation)
- Table 14.1 RNAi Therapeutics: List of Publications
- Table 15.1 RNAi Therapeutics: List of Partnerships, Since 2014
- Table 16.1 RNAi Therapeutics: List of Funding and Investments, Since 2014
- Table 16.2 Funding and Investment Analysis: Summary of Investments
- Table 17.1 Onpattro(R): Presentations in Conferences Before Product Approval
- Table 17.2 Givlaari(R): Presentations in Conferences Before Product Approval
- Table 17.3 Oxlumo(R): Presentations in Conferences Before Product Approval
- Table 17.4 Onpattro(R): Presentations in Conferences After Product Approval
- Table 17.5 Leqvio(R): Presentations in Conferences Before Product Approval
- Table 17.6 Approved RNAi Therapies: Patient Support Services Available on Product Websites (Comparative Analysis)
- Table 17.7 Leqvio(R): Presentations in Conferences After Product Approval
- Table 17.8 Approved RNAi Therapies: Patient Support Services Available on Product Websites (Comparative Analysis)
- Table 18.1 Survival on Early Diagnosis of Cancer
- Table 18.2 Cost of Biopsy for Different Cancer Indications (in USD)
- Table 18.3 Breast Cancer: Reported miRNA Biomarkers
- Table 18.4 Colorectal Cancer: Reported miRNA Biomarkers
- Table 18.5 Gastric Cancer: Reported miRNA Biomarkers
- Table 18.6 AML: Reported miRNA Biomarkers
- Table 18.7 de novo DLBCL: Reported miRNA Biomarkers
- Table 18.8 Lung Cancer: Reported miRNA Biomarkers
- Table 18.9 Prostate Cancer: Reported miRNA Biomarkers
- Table 18.10 Coronary Artery Disease: Reported miRNA Biomarkers
- Table 18.11 Myocardial Infarction: Reported miRNA Biomarkers
- Table 18.12 miRNA Diagnostic Tests: Pipeline
- Table 19.1 RNAi Therapeutics: List of CROs
- Table 19.2 RNAi Therapeutics: List of CMOs
- Table 19.3 RNAi Therapeutics: List of Consumables Providers and Other Service Providers
- Table 21.1 RNAi Therapeutics: Expected Launch Year of Advanced Stage Drug Candidates
- Table 21.2 Onpattro(R): Target Patient Population
- Table 21.3 Onpattro(R): Net Present Value (USD Million)
- Table 21.4 Onpattro(R): Value Creation Analysis (USD Million)
- Table 21.5 Givlaari(R): Target Patient Population
- Table 21.6 Givlaari(R): Net Present Value (USD Million)
- Table 21.7 Givlaari(R): Value Creation Analysis (USD Million)
- Table 21.8 Leqvio(R): Target Patient Population
- Table 21.9 Leqvio(R): Net Present Value (USD Million)
- Table 21.10 Leqvio(R): Value Creation Analysis (USD Million)
- Table 21.11 Oxlumo(R): Target Patient Population
- Table 21.12 Oxlumo(R): Net Present Value (USD Million)
- Table 21.13 Oxlumo(R): Value Creation Analysis (USD Million)
- Table 21.14 Fitusiran: Target Patient Population
- Table 21.15 Fitusiran: Net Present Value (USD Million)
- Table 21.16 Fitusiran: Value Creation Analysis (USD Million)
- Table 21.17 Vutrisiran: Target Patient Population
- Table 21.18 Vutrisiran: Net Present Value (USD Million)
- Table 21.19 Vutrisiran: Value Creation Analysis (USD Million)
- Table 21.20 SYL 1001: Target Patient Population
- Table 21.21 SYL 1001: Net Present Value (USD Million)
- Table 21.22 SYL 1001: Value Creation Analysis (USD Million)
- Table 21.23 Vigil-EWS: Target Patient Population
- Table 21.24 Vigil-EWS: Net Present Value (USD Million)
- Table 21.25 Vigil-EWS: Value Creation Analysis (USD Million)
- Table 21.26 Nedosiran: Target Patient Population
- Table 21.27 Nedosiran: Net Present Value (USD Million)
- Table 21.28 Nedosiran: Value Creation Analysis (USD Million)
- Table 22.1 RNAi Therapeutics: SWOT Analysis
- Table 22.2 Comparison of SWOT Factors: Harvey Ball Analysis
- Table 24.1 Concluding Remarks: Market Overview
- Table 24.2 Concluding Remarks: Competitive Landscape
- Table 24.3 Concluding Remarks: Company Competitiveness Analysis
- Table 24.4 Concluding Remarks: Technology Competitiveness Analysis
- Table 24.5 Concluding Remarks: Clinical Trial Analysis
- Table 24.6 Concluding Remarks: Key Opinion Leaders
- Table 24.7 Concluding Remarks: Patent Analysis
- Table 24.8 Concluding Remarks: Publication Analysis
- Table 24.9 Concluding Remarks: Recent Partnerships
- Table 24.10 Concluding Remarks: Funding and Investment Analysis
- Table 24.11 Concluding Remarks: Demand Analysis
- Table 24.12 Concluding Remarks: Market Sizing and Opportunity Analysis
- Table 25.1 RNAi Therapeutics: Distribution by Type of RNAi Molecule
- Table 25.2 RNAi Therapeutics: Distribution by Phase of Development
- Table 25.3 RNAi Therapeutics: Distribution by Type of RNAi Molecule and Phase of Development
- Table 25.4 RNAi Therapeutics: Distribution by Target Gene
- Table 25.5 RNAi Therapeutics: Distribution by Therapeutic Area
- Table 25.6 RNAi Therapeutics: Distribution by Route of Administration
- Table 25.7 RNAi Therapeutics: Distribution by Special Drug Designation
- Table 25.8 RNAi Therapeutics: Distribution by Special Drug Designation and Therapeutic Area
- Table 25.9 RNAi Therapeutics: Key Players
- Table 25.10 RNAi Therapeutics Developers: Distribution by Year of Establishment
- Table 25.11 RNAi Therapeutics Developers: Distribution by Company Size
- Table 25.12 RNAi Therapeutics Developers: Distribution by Location of Headquarters (Continent-wise)
- Table 25.13 RNAi Therapeutics Developers: Distribution by Location of Headquarters (Country-wise)
- Table 25.14 RNAi Therapeutics Developers: Key Players
- Table 25.15 RNAi Technology Platforms: Distribution by Purpose of Technology
- Table 25.16 RNAi Technology Platforms: Distribution by Type of Molecule(s) Delivered
- Table 25.17 RNAi Technology Platforms: Distribution by Type of Cell/ Tissue Targeted
- Table 25.18 RNAi Technology Developers: Distribution by Year of Establishment
- Table 25.19 RNAi Technology Developers: Distribution by Company Size
- Table 25.20 RNAi Technology Developers: Distribution by Location of Headquarters (Continent-wise)
- Table 25.21 RNAi Technology Developers: Distribution by Location of Headquarters (Country-wise)
- Table 25.22 RNAi Therapeutics for Oncological Disorders: Distribution by Target Indication and Phase of Development
- Table 25.23 RNAi Therapeutics for Oncological Disorders: Distribution by Type of RNAi Molecule
- Table 25.24 RNAi Therapeutics for Infectious Diseases: Distribution by Target Indication and Phase of Development
- Table 25.25 RNAi Therapeutics for Infectious Diseases: Distribution by Type of RNAi Molecule
- Table 25.26 RNAi Therapeutics for Metabolic Disorders: Distribution by Target Indication and Phase of Development
- Table 25.27 RNAi Therapeutics for Metabolic Disorders: Distribution by Type of RNAi Molecule
- Table 25.28 RNAi Therapeutics for Ophthalmic Diseases: Distribution by Target Indication and Phase of Development
- Table 25.29 RNAi Therapeutics for Ophthalmic Diseases: Distribution by Type of RNAi Molecule
- Table 25.30 RNAi Therapeutics for Genetic Disorders: Distribution by Target Indication and Phase of Development
- Table 25.31 RNAi Therapeutics for Genetic Disorders: Distribution by Type of RNAi Molecule
- Table 25.32 Clinical Trial Analysis: Cumulative Distribution by Trial Registration Year, Since Pre-2014
- Table 25.33 Clinical Trial Analysis: Distribution of Trials by Start Year and Type of Molecule, Since Pre-2014
- Table 25.34 Cumulative Distribution of Enrolled Patient Population by Study Start Year, Since Pre-2014
- Table 25.35 Clinical Trial Analysis: Distribution of Enrolled Patient Population by Trial Phase
- Table 25.36 Clinical Trial Analysis: Distribution by Trial Recruitment Status and Phase of Development
- Table 25.37 Clinical Trial Analysis: Distribution by Type of Sponsor / Collaborator
- Table 25.38 Clinical Trial Analysis: Distribution by Type of RNAi Molecule and Trial Recruitment Status
- Table 25.39 Clinical Trial Analysis: Distribution by Type of RNAi Molecule and Trial Registration Year
- Table 25.40 Clinical Trial Analysis: Distribution by Type of RNAi Molecule and Phase of Development
- Table 25.41 Clinical Trial Analysis: Distribution by Therapeutic Area
- Table 25.42 Clinical Trial Analysis: Distribution by Therapeutic Area and Phase of Development
- Table 25.43 Clinical Trial Analysis: Geographical Distribution of Clinical Trials
- Table 25.44 Clinical Trial Analysis: Geographical Distribution of Clinical Trials by Trial Phase and Recruitment Status
- Table 25.45 Clinical Trial Analysis: Geographical Distribution of Clinical Trials by Type of RNAi Molecule
- Table 25.46 Clinical Trial Analysis: Geographical Distribution of Clinical Trials by Trial Phase and Type of RNAi Molecule
- Table 25.47 Clinical Trial Analysis: Geographical Distribution of Clinical Trials by Trial Phase and Therapeutic Area
- Table 25.48 Geographical Analysis by Number of Clinical Trials, Therapeutic Area and Trial Phase
- Table 25.49 Clinical Trial Analysis: Geographical Distribution of Enrolled Patient Population
- Table 25.50 Clinical Trial Analysis: Geographical Distribution of Enrolled Patient Population by Trial Phase and Recruitment Status
- Table 25.51 Clinical Trial Analysis: Geographical Distribution of Enrolled Patient Population by Type of RNAi Molecule
- Table 25.52 Clinical Trial Analysis: Geographical Distribution of Enrolled Patient Population by Trial Phase and Type of RNAi Molecule
- Table 25.53 Clinical Trial Analysis: Geographical Distribution of Enrolled Patient Population by Therapeutic Area
- Table 25.54 Clinical Trial Analysis: Geographical Distribution of Enrolled Patient Population by Trial Phase and Therapeutic Area
- Table 25.55 Key Opinion Leaders: Distribution by Type of Organization
- Table 25.56 KOL Analysis: Distribution by Qualification
- Table 25.57 KOL Analysis: Distribution by Geographical Location
- Table 25.58 Most Prominent Organizations: Distribution by Number of KOLs
- Table 25.59 Most Prominent KOLs: Distribution by KOL Strength
- Table 25.60 Patent Analysis: Distribution by Type of Patent
- Table 25.61 Patent Analysis: Cumulative Distribution by Publication Year, Since 2016
- Table 25.62 Patent Analysis: Distribution by Patent Type and Publication Year
- Table 25.63 Patent Analysis: Distribution by Type of Applicant
- Table 25.64 Patent Analysis: Distribution by Geography
- Table 25.65 Patent Analysis: North American Scenario
- Table 25.66 Patent Analysis: European Scenario
- Table 25.67 Patent Analysis: Asia-Pacific Scenario
- Table 25.68 Leading Players (Industry): Distribution by Number of Patents
- Table 25.69 Leading Players (Non-Industry): Distribution by Number of Patents
- Table 25.70 Patent Analysis: Distribution by Patent Age, Since 2016
- Table 25.71 Publication Analysis: Cumulative Year-wise Trend, Since 2016
- Table 25.72 Publication Analysis: Distribution by Type of Publication
- Table 25.73 Publication Analysis: Most Popular Keywords
- Table 25.74 Top Journals: Distribution by Number of Publications
- Table 25.75 Top Publishers: Distribution by Number of Publications
- Table 25.76 Key Copyright Holders: Distribution by Number of Publications
- Table 25.77 Key Funding Institutes: Distribution by Number of Publications
- Table 25.78 Partnerships: Cumulative Year-Wise Trend, Since 2014
- Table 25.79 Partnerships: Distribution by Type of Partnership
- Table 25.80 Partnerships: Year-wise Trend by Type of Partnership
- Table 25.81 Partnerships: Distribution by Type of RNAi Molecule
- Table 25.82 Partnerships: Distribution by Scale of Partnership
- Table 25.83 Partnerships: Distribution by Therapeutic Area
- Table 25.84 Most Active Players: Distribution by Number of Partnerships
- Table 25.85 Partnerships: Local and International Agreements
- Table 25.86 Partnerships: Intercontinental and Intracontinental Distribution
- Table 25.87 Funding and Investment Analysis: Distribution by Type of Funding and Year of Establishment, Since 2014
- Table 25.88 Funding and Investment Analysis: Cumulative Number of Instances by Year, Since 2014
- Table 25.89 Funding and Investment Analysis: Cumulative Amount Invested, Since 2014 (USD Million)
- Table 25.90 Funding and Investment Analysis: Distribution of Instances by Type of Funding, Since 2014
- Table 25.91 Funding and Investment Analysis: Distribution of the Total Amount Invested by Type of Funding, Since 2014 (USD Million)
- Table 25.92 Funding and Investments: Distribution of Number of Instances by Year and Type of Funding
- Table 25.93 Funding and Investments: Distribution of Amount Invested across Different Types of RNAi Therapeutics
- Table 25.94 Funding and Investment Analysis: Distribution by Geography
- Table 25.95 Funding and Investment Analysis: Regional Distribution of Funding Instances
- Table 25.96 Most Active Players: Distribution by Number of Instances, Since 2014
- Table 25.97 Most Active Players: Distribution by Amount Invested, Since 2014 (USD Million)
- Table 25.98 Key Investors: Distribution by Number of Instances
- Table 25.99 RNAi Therapeutics: Types of Service Providers
- Table 25.100 RNAi Therapeutic CROs: Distribution by Year of Establishment
- Table 25.101 RNAi Therapeutics CROs: Distribution by Location of Headquarters
- Table 25.102 RNAi Therapeutics CROs: Distribution by Company Size
- Table 25.103 RNAi Therapeutics CROs: Distribution by Type of RNAi Molecule
- Table 25.104 RNAi Therapeutics CMOs: Distribution by Year of Establishment
- Table 25.105 RNAi Therapeutics CMOs: Distribution by Location of Headquarters
- Table 25.106 RNAi Therapeutics CMOs: Distribution by Company Size
- Table 25.107 RNAi Therapeutic Consumable Providers: Distribution by Year of Establishment
- Table 25.108 RNAi Therapeutic Consumable Providers: Distribution by Location of Headquarters
- Table 25.109 RNAi Therapeutic Consumable Providers: Distribution by Company Size
- Table 25.110 RNAi Therapeutic Consumable Providers: Distribution by Type of RNAi Molecule
- Table 25.111 Global Demand for RNAi Therapeutics, Till 2035 (in terms of Target Patient Population)
- Table 25.112 Demand Analysis: Distribution by Type of Molecule, (in terms of Target Patient Population)
- Table 25.113 Demand Analysis: Distribution by Therapeutic Area, (in terms of Target Patient Population)
- Table 25.114 Demand Analysis: Distribution by Route of Administration, (in terms of Target Patient Population)
- Table 25.115 Demand Analysis: Distribution by Key Players, (in terms of Target Patient Population)
- Table 25.116 Demand Analysis: Distribution by Geography, (in terms of Target Patient Population)
- Table 25.117 Overall RNAi Therapeutics Market, Till 2035 (USD Billion)
- Table 25.118 RNAi Therapeutics Market: Distribution by Type of RNAi Molecule, Till 2035 (USD Million)
- Table 25.119 RNAi Therapeutics Market: Distribution by Therapeutic Area, Till 2035 (USD Billion)
- Table 25.120 RNAi Therapeutics Market: Distribution by Route of Administration, Till 2035 (USD Million)
- Table 25.121 RNAi Therapeutics Market: Distribution by Share of Leading Players, Till 2035 (USD Million)
- Table 25.122 RNAi Therapeutics Market: Distribution by Geography, Till 2035 (USD Billion)
- Table 25.123 Onpattro Sales Forecast (Till 2035): Conservative, Base and Optimistic Scenarios (USD Million)
- Table 25.124 Givosiran Sales Forecast (Till 2035): Conservative, Base and Optimistic Scenarios (USD Million)
- Table 25.125 Inclisiran Sales Forecast (Till 2035): Conservative, Base and Optimistic Scenarios (USD Million)
- Table 25.126 Lumasiran Sales Forecast (Till 2035): Conservative, Base and Optimistic Scenarios (USD Million)
- Table 25.127 Fitusiran Sales Forecast (Till 2035): Conservative, Base and Optimistic Scenarios (USD Million)
- Table 25.128 Vutrisiran Sales Forecast (Till 2035): Conservative, Base and Optimistic Scenarios (USD Million)
- Table 25.129 SYL 1001 Sales Forecast (Till 2035): Conservative, Base and Optimistic Scenarios (USD Million)
- Table 25.130 Vigil-EWS Sales Forecast (Till 2035): Conservative, Base and Optimistic Scenarios (USD Million)
- Table 25.131 Nedosiran Sales Forecast (Till 2035): Conservative, Base and Optimistic Scenarios (USD Million)
List of Figures
- Figure 2.1 Executive Summary: Market Landscape
- Figure 2.2 Executive Summary: Competitive Landscape
- Figure 2.3 Executive Summary: Technology Platforms and Delivery Systems
- Figure 2.4 Executive Summary: Clinical Trial Analysis
- Figure 2.5 Executive Summary: Patent Analysis
- Figure 2.6 Executive Summary: Publication Analysis
- Figure 2.7 Executive Summary: Partnerships and Collaborations
- Figure 2.8 Executive Summary: Funding and Investment Analysis
- Figure 2.9 Executive Summary: Demand Analysis
- Figure 2.10 Executive Summary: Market Sizing and Opportunity Analysis
- Figure 3.1 RNA Interference: Key Milestones and Historical Evolution
- Figure 3.2 RNA Interference: Key Components
- Figure 3.3 RNA Interference: Working Mechanism
- Figure 3.4 RNA Interference: Types of Delivery Systems
- Figure 3.5 RNA Interference: Advantages and Disadvantages
- Figure 4.1 RNAi Therapeutics: Distribution by Type of RNAi Molecule
- Figure 4.2 RNAi Therapeutics: Distribution by Phase of Development
- Figure 4.3 RNAi Therapeutics: Distribution by Molecule and Phase of Development
- Figure 4.4 RNAi Therapeutics Pipeline: Distribution by Target Gene
- Figure 4.5 RNAi Therapeutics Pipeline: Distribution by Therapeutic Area
- Figure 4.6 RNAi Therapeutics Pipeline: Distribution by Route of Administration
- Figure 4.7 RNAi Therapeutics: Distribution by Special Drug Designation
- Figure 4.8 RNAi Therapeutics: Distribution by Special Drug Designation and Therapeutic Area
- Figure 4.9 RNAi Therapeutics: Key Players
- Figure 5.1 RNAi Therapeutics Developers: Distribution by Year of Establishment
- Figure 5.2 RNAi Therapeutics Developers: Distribution by Company Size
- Figure 5.3 RNAi Therapeutics Developers: Distribution by Location of Headquarters
- Figure 5.4 RNAi Therapeutics Developers: Distribution by Location of Headquarters (Country-wise)
- Figure 5.5 RNAi Therapeutics Developers: Key Players
- Figure 5.6 RNAi Therapeutics Developers: Regional Landscape
- Figure 6.1 Company Competitiveness Analysis: Developers based in North America
- Figure 6.2 Company Competitiveness Analysis: Developers based in Europe
- Figure 6.3 Company Competitiveness Analysis: Developers based in Asia-Pacific
- Figure 7.1 Onpattro (Alnylam Pharmaceuticals): Timeline of Regulatory Approvals Across Regions
- Figure 7.2 Lipid Nanoparticles Delivery System: Mode of Action
- Figure 7.3 Givlaari (Alnylam Pharmaceuticals): Timeline of Regulatory Approvals Across Regions
- Figure 7.4 ESC-GalNAc Delivery System: Mode of Action
- Figure 7.5 Leqvio (Alnylam Pharmaceuticals): Timeline of Regulatory Approvals Across Regions
- Figure 8.1 RNAi Technology Platforms: Distribution by Purpose of Technology
- Figure 8.2 RNAi Technology Platforms: Distribution by Type of Molecule(s) Delivered
- Figure 8.3 RNAi Technology Platforms: Distribution by Type of Cell (s) / Tissue (s) Targeted
- Figure 8.4 RNAi Technology Developers: Distribution by Year of Establishment
- Figure 8.5 RNAi Technology Developers: Distribution by Company Size
- Figure 8.6 RNAi Technology Developers: Distribution by Location of Headquarters (Continent-wise)
- Figure 8.7 RNAi Technology Developers: Distribution by Location of Headquarters (Country-wise)
- Figure 8.8 Protein Nanoparticle Delivery System: Technology Components and Its Assembly
- Figure 8.9 mRNAi GOLD Platform: Advantages
- Figure 9.1 Technology Competitiveness Analysis: Drug Delivery Technologies
- Figure 9.2 Technology Competitiveness Analysis: Drug Discovery / Development Technologies
- Figure 10.1 RNAi Therapeutics for Oncological Disorders: Distribution by Target Indication and Phase of Development
- Figure 10.2 RNAi Therapeutics for Oncological Disorders: Distribution by Type of RNAi Molecule
- Figure 10.3 RNAi Therapeutics for Infectious Diseases: Distribution by Target Indication and Phase of Development
- Figure 10.4 RNAi Therapeutics for Infectious Diseases: Distribution by Type of RNAi Molecule
- Figure 10.5 RNAi Therapeutics for Metabolic Disorders: Distribution by Target Indication and Phase of Development
- Figure 10.6 RNAi Therapeutics for Metabolic Disorders: Distribution by Type of RNAi Molecule
- Figure 10.7 RNAi Therapeutics for Ophthalmic Diseases: Distribution by Target Indication and Phase of Development
- Figure 10.8 RNAi Therapeutics for Ophthalmic Diseases: Distribution by Type of RNAi Molecule
- Figure 10.9 RNAi Therapeutics for Genetic Disorders: Distribution by Target Indication and Phase of Development
- Figure 10.10 RNAi Therapeutics for Genetic Disorders: Distribution by Type of RNAi Molecule
- Figure 11.1 Clinical Trial Analysis: Methodology
- Figure 11.2 Clinical Trial Analysis: Cumulative Distribution by Trial Registration Year
- Figure 11.3 Clinical Trial Analysis: Distribution of Trials by Start Year and Type of Molecule
- Figure 11.4 Clinical Trial Analysis: Cumulative Distribution of Enrolled Patient Population by Study Start Year
- Figure 11.5 Clinical Trial Analysis: Distribution of Enrolled Patient Population by Trial Phase
- Figure 11.6 Clinical Trial Analysis: Distribution by Trial Recruitment Status and Phase of Development
- Figure 11.7 Clinical Trial Analysis: Distribution by Type of Sponsor / Collaborator
- Figure 11.8 Clinical Trial Analysis: Distribution by Type of RNAi Molecule and Trial Recruitment Status
- Figure 11.9 Clinical Trial Analysis: Distribution by Type of RNAi Molecule and Trial Registration Year
- Figure 11.10 Clinical Trial Analysis: Distribution by Type of RNAi Molecule and Phase of Development
- Figure 11.11 Clinical Trial Analysis: Distribution by Therapeutic Area
- Figure 11.12 Clinical Trial Analysis: Distribution by Therapeutic Area and Phase of Development
- Figure 11.13 Clinical Trial Analysis: Geographical Distribution of Clinical Trials
- Figure 11.14 Clinical Trial Analysis: Geographical Distribution of Clinical Trials by Trial Phase and Recruitment Status
- Figure 11.15 Clinical Trial Analysis: Geographical Distribution of Clinical Trials by Type of RNAi Molecule
- Figure 11.16 Clinical Trial Analysis: Geographical Distribution of Clinical Trials by Trial Phase and Type of RNAi Molecule
- Figure 11.17 Clinical Trial Analysis: Geographical Distribution of Clinical Trials by Trial Phase and Therapeutic Area
- Figure 11.18 Clinical Trial Analysis: Geographical Distribution of Clinical Trials by Trial Phase and Therapeutic Area
- Figure 11.19 Clinical Trial Analysis: Geographical Distribution of Enrolled Patient Population
- Figure 11.20 Clinical Trial Analysis: Geographical Distribution of Enrolled Patient Population by Trial Phase and Recruitment Status
- Figure 11.21 Clinical Trial Analysis: Geographical Distribution of Enrolled Patient Population by Type of RNAi Molecule
- Figure 11.22 Clinical Trial Analysis: Geographical Distribution of Enrolled Patient Population by Trial Phase and Type of RNAi Molecule
- Figure 11.23 Clinical Trial Analysis: Geographical Distribution of Enrolled Patient Population by Therapeutic Area
- Figure 11.24 Clinical Trial Analysis: Geographical Distribution of Enrolled Patient Population by Trial Phase and Therapeutic Area
- Figure 12.1 KOL Analysis: Distribution by Type of Organization
- Figure 12.2 KOL Analysis: Distribution by Qualification
- Figure 12.3 KOL Analysis: Distribution by Geographical Location
- Figure 12.4 Most Prominent Organizations: Distribution by Number of KOLs
- Figure 12.5 Scatter Plot: KOL Activeness v/s KOL Strength
- Figure 12.6 Most Prominent KOLs: Distribution by KOL Strength
- Figure 12.7 Most Prominent KOLs: Comparison of RA Score with Third-Party Score
- Figure 12.8 Linear Regression Analysis: Comparison of RA Score with Third-Party Score
- Figure 12.9 Most Prominent KOLs: KOL Activeness v/s KOL Strength
- Figure 13.1 Patent Analysis: Distribution by Type of Patent
- Figure 13.2 Patent Analysis: Cumulative Distribution by Publication Year, Since 2016
- Figure 13.3 Patent Analysis: Distribution by Patent Type and Publication Year
- Figure 13.4 Patent Analysis: Distribution by CPC Symbols
- Figure 13.5 Patent Analysis: Distribution by Type of Applicant
- Figure 13.6 Patent Analysis: Distribution by Geography
- Figure 13.7 Patent Analysis: North American Scenario
- Figure 13.8 Patent Analysis: European Scenario
- Figure 13.9 Patent Analysis: Asia-Pacific Scenario
- Figure 13.10 Patent Analysis: Emerging Focus Areas
- Figure 13.11 Leading Players (Industry): Distribution by Number of Patents
- Figure 13.12 Leading Players (Non-Industry): Distribution by Number of Patents
- Figure 13.13 Patent Analysis: Benchmarking by Patent Characteristics
- Figure 13.14 Patent Analysis (Leading Industry Players): Benchmarking by Patent Characteristics
- Figure 13.15 Patent Analysis: Distribution by Patent Age, Since 2016
- Figure 13.16 Patent Analysis: Categorizations based on Weighted Valuation Scores
- Figure 13.17 Patent Analysis: Patent Valuation
- Figure 14.1 Publication Analysis: Cumulative Year-wise Trend, Since 2016
- Figure 14.2 Publication Analysis: Distribution by Type of Publication
- Figure 14.3 Publication Analysis: Most Popular Keywords
- Figure 14.4 Most Popular Journals: Distribution by Number of Publications
- Figure 14.5 Most Popular Publishers: Distribution by Number of Publications
- Figure 14.6 Most Popular Copyright Holders: Distribution by Number of Publications
- Figure 14.7 Key Funding Institutes: Distribution by Number of Publications
- Figure 15.1 Partnerships: Cumulative Year-Wise Trend, Since 2014
- Figure 15.2 Partnerships: Distribution by Type of Partnership
- Figure 15.3 Partnerships: Year-wise Trend by Type of Partnership
- Figure 15.4 Partnerships: Distribution by Type of RNAi Molecule
- Figure 15.5 Partnerships: Distribution by Scale of Partnership
- Figure 15.6 Partnerships: Distribution by Therapeutic Area
- Figure 15.7 Most Active Players: Distribution by Number of Partnerships
- Figure 15.8 Partnerships: Local and International Agreements
- Figure 15.9 Partnerships: Intercontinental and Intracontinental Distribution
- Figure 16.1 Funding and Investment Analysis: Distribution by Type of Funding and Year of Establishment, Since 2014
- Figure 16.2 Funding and Investment Analysis: Cumulative Number of Instances by Year, Since 2014
- Figure 16.3 Funding and Investment Analysis: Cumulative Amount Invested, Since 2014 (USD Million)
- Figure 16.4 Funding and Investment Analysis: Distribution by Year, Type of Funding and Amount Invested, Since 2014
- Figure 16.5 Funding and Investment Analysis: Distribution of Instances by Type of Funding, Since 2014
- Figure 16.6 Funding and Investment Analysis: Distribution of the Total Amount Invested by Type of Funding, Since 2014 (USD Million)
- Figure 16.7 Funding and Investments: Distribution of Number of Instances by Year and Type of Funding
- Figure 16.8 Funding and Investments: Distribution by Amount Invested across Different Types of RNAi Therapeutics
- Figure 16.9 Funding and Investment Analysis: Distribution by Geography
- Figure 16.10 Funding and Investment Analysis: Regional Distribution of Funding Instances
- Figure 16.11 Most Active Players: Distribution by Number of Instances, Since 2014
- Figure 16.12 Most Active Players: Distribution by Amount Invested, Since 2014 (USD Million)
- Figure 16.13 Key Investors: Distribution by Number of Instances
- Figure 16.14 Funding and Investment Summary, Since 2014 (USD Million)
- Figure 17.1 Successful Drug Launch Strategy: ROOTS Framework
- Figure 17.2 Successful Drug Launch Strategy: Product Differentiation
- Figure 17.3 Commonly Adopted Commercialization Strategies based on Development Stage of the Product
- Figure 17.4 Harvey Ball Analysis: Commercialization Strategies Adopted by RNAi-Based Therapy Developers
- Figure 17.5 Approved RNAi Therapies: Snapshot of Promotional Activities on Product Websites
- Figure 17.6 Key Commercialization Strategies: Harvey Ball Analysis by Ease of Implementation, Value Addition and Current Adoption
- Figure 18.1 Circulating miRNA Biomarkers: Key Criteria
- Figure 18.2 Factors Determining Useful Cancer Screening
- Figure 18.3 Conventional Methods for Cancer Diagnosis
- Figure 19.1 RNAi Therapeutics: Types of Service Providers
- Figure 19.2 RNAi Therapeutic CROs: Distribution by Year of Establishment
- Figure 19.3 RNAi Therapeutics CROs: Distribution by Location of Headquarters
- Figure 19.4 RNAi Therapeutics CROs: Distribution by Company Size
- Figure 19.5 RNAi Therapeutics CMOs: Distribution by Year of Establishment
- Figure 19.6 RNAi Therapeutics CMOs: Distribution by Location of Headquarters
- Figure 19.7 RNAi Therapeutics CMOs: Distribution by Company Size
- Figure 19.8 RNAi Therapeutic Consumable Providers: Distribution by Year of Establishment
- Figure 19.9 RNAi Therapeutic Consumable Providers: Distribution by Location of Headquarters
- Figure 19.10 RNAi Therapeutic Consumable Providers: Distribution by Company Size
- Figure 20.1 Global Demand for RNAi Therapeutics, Till 2035 (in terms of Target Patient Population)
- Figure 20.2 Demand Analysis: Distribution by Type of Molecule (in terms of Target Patient Population)
- Figure 20.3 Demand Analysis: Distribution by Therapeutic Area (in terms of Target Patient Population)
- Figure 20.4 Demand Analysis: Distribution by Route of Administration (in terms of Target Patient Population)
- Figure 20.5 Demand Analysis: Distribution by Key Players (in terms of Target Patient Population)
- Figure 20.6 Demand Analysis: Distribution by Geography (in terms of Target Patient Population)
- Figure 21.1 Overall RNAi Therapeutics Market, Till 2035: Base Scenario (USD Billion)
- Figure 21.2 RNAi Therapeutics Market: Distribution by Type of RNAi Molecule, Till 2035 (USD Million)
- Figure 21.3 RNAi Therapeutics Market: Distribution by Therapeutic Area, Till 2035 (USD Billion)
- Figure 21.4 RNAi Therapeutics Market: Distribution by Route of Administration, Till 2035 (USD Million)
- Figure 14.5 RNAi Therapeutics Market: Distribution by Share of Leading Players, Till 2035 (USD Million)
- Figure 14.6 RNAi Therapeutics Market: Distribution by Geography, Till 2035 (USD Million)
- Figure 21.7 Onpattro Sales Forecast (Till 2035): Base Scenario (USD Million)
- Figure 21.8 Givosiran Sales Forecast (Till 2035): Base Scenario (USD Million)
- Figure 21.9 Inclisiran Sales Forecast (Till 2035): Base Scenario (USD Million)
- Figure 21.10 Lumasiran Sales Forecast (Till 2035): Base Scenario (USD Million)
- Figure 21.11 Fitusiran Sales Forecast (Till 2035): Base Scenario (USD Million)
- Figure 21.12 Vutrisiran Sales Forecast (Till 2035): Base Scenario (USD Million)
- Figure 21.13 SYL 1001 Sales Forecast (Till 2035): Base Scenario (USD Million)
- Figure 21.14 Vigil-EWS Sales Forecast (Till 2035): Base Scenario (USD Million)
- Figure 21.15 Nedosiran Sales Forecast (Till 2035): Base Scenario (USD Million)
- Figure 22.1 RNAi Therapeutics: SWOT Analysis
- Figure 22.2 Comparison of SWOT Factors: Harvey Ball Analysis
- Figure 24.1 Concluding Remarks: Market Overview
- Figure 24.2 Concluding Remarks: Competitive Landscape
- Figure 24.3 Concluding Remarks: Company Competitiveness Analysis
- Figure 24.4 Concluding Remarks: Technology Platforms and Delivery Systems
- Figure 24.5 Concluding Remarks: Technology Competitiveness Analysis
- Figure 24.6 Concluding Remarks: Clinical Trial Analysis
- Figure 24.7 Concluding Remarks: Key Opinion Leaders
- Figure 24.8 Concluding Remarks: Patent Analysis
- Figure 24.9 Concluding Remarks: Publication Analysis
- Figure 24.10 Concluding Remarks: Recent Partnerships
- Figure 24.11 Concluding Remarks: Funding and Investment Analysis
- Figure 24.12 Concluding Remarks: Key Commercialization Strategies
- Figure 24.13 Concluding Remarks: Demand Analysis
- Figure 24.14 Concluding Remarks: Market Sizing and Opportunity Analysis (1/2)
- Figure 24.15 Concluding Remarks: Market Sizing and Opportunity Analysis (2/2)

