
PUBLISHER: Roots Analysis | PRODUCT CODE: 1737058

PUBLISHER: Roots Analysis | PRODUCT CODE: 1737058
Alzheimer's Disease Market Distribution by Type of Treatment, Symptomatic Indications, and Key Geographical Regions
ALZHEIMER'S DISEASE MARKET: OVERVIEW
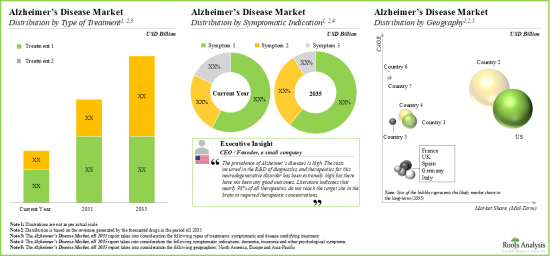
As per Roots Analysis, the global Alzheimer's disease market is estimated to grow from USD 12.4 billion in the current year to USD 19.1 billion by 2030, at a CAGR of 9% during the forecast period, till 2030.
The market sizing and opportunity analysis has been segmented across the following parameters:
Type of Treatment
- Symptomatic
- Disease Modifying
Symptomatic Indications
- Dementia
- Insomnia
- Other Physiological Symptoms
Key Geographical Regions
- North America
- Europe
- Asia-Pacific
- Rest of the World
ALZHEIMER'S DISEASE MARKET: GROWTH AND TRENDS
Alzheimer's disease is a progressive neurological disorder characterized by the death of brain cells, eventually leading to memory loss, cognitive dysfunction and dementia. Accounting for 60-70% of cases of dementia, Alzheimer's disease is known to be the sixth leading cause of death in the US. Presently, around seven million Americans of all ages are living with Alzheimer's and this number is projected to reach around 13 million by 2050. The primary symptoms associated with Alzheimer's disease include disorientation, personality / behavioral changes, confusion about events / time / place and severe memory loss. In addition, people suffering from this disease are known to face difficulty in speaking, swallowing and walking. Notably, as the disease progresses, the aforementioned symptoms become more pronounced and contribute to the death of brain cells. Consequently, the advancements in innovative Alzheimer's therapies offer lucrative opportunities to stakeholders engaged in this field.
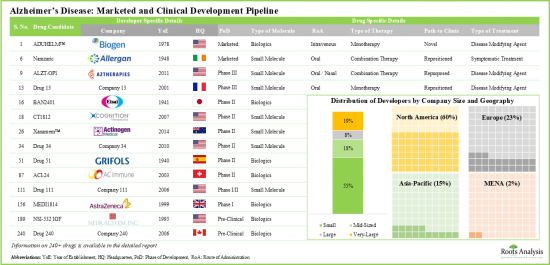
Given the socioeconomic burden associated with Alzheimer's, pharmaceutical players have been looking for reliable diagnostic tests and effective Alzheimer's treatment alternatives that can slow the progression of this disease. Presently, over 160 companies, based in different regions of the world, have taken initiatives to develop drug therapies for Alzheimer's treatment.
ALZHEIMER'S DISEASE MARKET: KEY INSIGHTS
The report delves into the current state of the Alzheimer's disease market and identifies potential growth opportunities within the industry. Some key findings from the report include:
- Presently, over 160 companies, based in different regions of the world, have taken initiatives to develop drug therapies for Alzheimer's disease; the market is characterized by a mix of well-established and small firms.
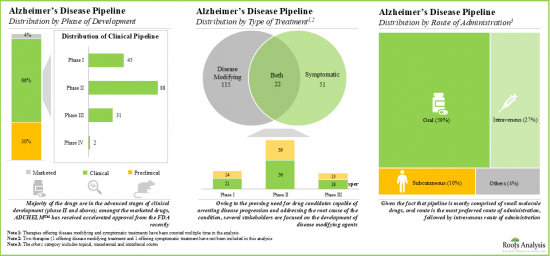
- The pipeline features 240+ drug therapies being evaluated either as monotherapies or in combination with other interventions across different stages of development; most of these are designed for oral administration.
- There has been a notable increase in published scientific literature related to the diagnosis, treatment and management of Alzheimer's disease.
- The intellectual property associated with Alzheimer's disease has also increased, as numerous patents related to the drug molecules have been filed by / granted to various organizations.
- In the past few years, several organizations have extended financial support to aid the ongoing research and development activities in this domain.
- In the past decade, several clinical trials have been registered for evaluating drug therapies for Alzheimer's disease, across different geographical regions; a number of these trials have already been completed.
- Several investors have invested over USD 4 billion across 164 instances in the recent past, owing to the benefits and opportunities associated with drug candidates being developed to treat this clinical condition.
- The overall market opportunity for Alzheimer's disease therapies is likely to be distributed across different types of treatments, symptomatic indications and key geographical regions
ALZHEIMER'S DISEASE MARKET: KEY SEGMENTS
Disease Modifying Segment Occupy the Largest Share of the Global Alzheimer's Disease Market
Based on the type of treatment, the market is segmented into symptomatic and disease modifying types of treatments. At present, the disease modifying segment holds the maximum share of the global Alzheimer's disease market. Further, the symptomatic segment is likely to grow at a faster pace compared to the other segments.
By Symptomatic Indications, Insomnia is the Fastest Growing Segment of the Global Alzheimer's Disease Market During the Forecast Period
Based on the symptomatic indications, the market is segmented into dementia, insomnia, and other psychological symptoms. Currently, the dementia segment captures the highest proportion of the global Alzheimer's disease market owing to the growing number of therapeutic drugs being developed to treat cognitive symptoms. Further, it is worth highlighting that the Alzheimer's disease market for insomnia is likely to grow at a relatively higher CAGR.
North America Accounts for the Largest Share of the Market
Based on key geographical regions, the market is segmented into North America, Europe, and Asia-Pacific and Rest of the World. Currently, North America dominates the Alzheimer's disease market and accounts for the largest revenue share due to the favorable regulatory environment in this region. In fact, regulatory bodies in North America have recently approved several new Alzheimer's drugs, providing patients with access to innovative therapies and boosting market growth. Additionally, the market in Europe is likely to grow at a higher CAGR in the coming years.
Example Players in the Alzheimer's Disease Market
- AbbVie
- AC Immune
- Biogen
- Eisai
- Eli Lilly and Company
- GlaxoSmithKline
- Grifols
- Janssen Pharmaceutical
- Neurim Pharmaceuticals
- Novartis
- Novo Nordisk
- Roche
- Takeda Pharmaceutical
ALZHEIMER'S DISEASE MARKET: RESEARCH COVERAGE
- Market Sizing and Opportunity Analysis: The report features an in-depth analysis of the global Alzheimer's disease market, focusing on key market segments, including [A] type of treatment, [B] symptomatic indications, and [C] key geographical regions.
- Market Landscape: A comprehensive evaluation of the drugs developed for the treatment of Alzheimer's, based on several relevant parameters, such as [A] current status of development, [B] phase of development of lead candidates, [C] type of biologic, [D] target disease stage, [E] type of treatment, [F] mechanism of action, [G] route of administration, [H] dosing frequency, [I] type of therapy and [J] path to clinic. Additionally, a comprehensive evaluation of the drug developer(s) involved in the domain, based on several relevant parameters, such as [K] year of establishment, [L] company size and [M] geographical location of headquarters.
- Company Profiles: In-depth profiles of key players engaged in the development of therapeutics for Alzheimer's disease, focusing on [A] overview of the company, [B] financial information (if available), [C] product portfolio, and [D] recent developments and an informed future outlook.
- Case Study: A detailed discussion on over 110 discontinued drugs and terminated trials, based on various parameters, such as [A] year of discontinuation, [B] reason(s) for discontinuation, [C] phase of discontinuation, [D] mechanism of action of the terminated drugs, [E] type of indication, [F] reason for termination, [G] affiliated stakeholders. Additionally, a detailed assessment of 180 terminated clinical trials, based on various parameters, such as [H] year of termination and [I] key geographies across which these trials were being conducted.
- Publication Analysis: An insightful analysis of around 20,000 peer-reviewed scientific articles related to research on Alzheimer's disease, based on various relevant parameters, such as [A] year of publication, [B] key focus area, [C] type of molecule, [D] popular keywords, and [E] key journals.
- Partnerships and Collaborations: An insightful analysis of the deals inked by stakeholders in the Alzheimer's disease market, based on several parameters, such as [A] year of partnership, [B] type of partnership, [C] focus area, [D] type of molecule, [E] most active players (in terms of the number of partnerships signed) and [F] geographical distribution of partnership activity.
- Funding and Investments: An in-depth analysis of the fundings raised by companies engaged in Alzheimer's disease market, based on relevant parameters, such as [A] year of funding, [B] amount invested, [C] type of funding, [D] geographical analysis, [E] most active players and [F] most active investors.
- Grants Analysis: A comprehensive assessment of grants that have been awarded to research institutes in the Alzheimer's disease domain, based on various relevant parameters, such as [A] year of grant award, [B] grant amount awarded, [C] administering institute center, [D] support period, [E] type of grant application, [F] grant activity code, [G] emerging focus area, [H] purpose of grant award, [I] type of recent organization, [J] popular NIH department and [K] prominent program officers.
- Clinical Trial Analysis: An insightful analysis of clinical trials related to therapies being developed for the treatment of Alzheimer's, based on several parameters, such as [A] current trial status, [B] trial registration year, [C] phase of development, [D] study design, [E] leading industry sponsors, [F] study focus, [G] target indication(s), [H] focus areas, [I] target therapeutic area(s), [J] enrolled patient population and [K] regional distribution of trials.
- Patent Analysis: An in-depth analysis of patents filed / granted till date in the Alzheimer's disease domain, based on various relevant parameters, such as [A] publication year, [B] geography, [C] CPC symbols, [D] emerging focus areas, [E] type of applicant, [F] leading industry players and [G] patent valuation analysis.
- Non-Pharmacological Interventions and Diagnostics: A detailed discussion on the various non-pharmacological interventions, including [A] cognition / emotion-oriented therapies, [B] sensory simulation therapies and [C] other psychological interventions. Additionally, a discussion of the companies that offer such solutions, providing information on the [D] devices / products and [E] mechanisms of action / working principles.
KEY QUESTIONS ANSWERED IN THIS REPORT
- How many companies are currently engaged in this market?
- Which are the leading companies in this market?
- What factors are likely to influence the evolution of this market?
- What is the current and future market size?
- What is the CAGR of this market?
- How is the current and future market opportunity likely to be distributed across key market segments?
REASONS TO BUY THIS REPORT
- The report provides a comprehensive market analysis, offering detailed revenue projections of the overall market and its specific sub-segments. This information is valuable to both established market leaders and emerging entrants.
- Stakeholders can leverage the report to gain a deeper understanding of the competitive dynamics within the market. By analyzing the competitive landscape, businesses can make informed decisions to optimize their market positioning and develop effective go-to-market strategies.
- The report offers stakeholders a comprehensive overview of the market, including key drivers, barriers, opportunities, and challenges. This information empowers stakeholders to stay abreast of market trends and make data-driven decisions to capitalize on growth prospects.
ADDITIONAL BENEFITS
- Complimentary PPT Insights Packs
- Complimentary Excel Data Packs for all Analytical Modules in the Report
- 15% Free Content Customization
- Detailed Report Walkthrough Session with Research Team
- Free Updated report if the report is 6-12 months old or older
TABLE OF CONTENTS
1. PREFACE
- 1.1. Scope of the Report
- 1.2. Research Methodology
- 1.3. Key Questions Answered
- 1.4. Chapter Outlines
2. EXECUTIVE SUMMARY
3. INTRODUCTION
- 3.1. An Overview of Alzheimer's Disease
- 3.1.1. Alzheimer's Disease: Signs and Symptoms
- 3.1.2. Causes of Alzheimer's Disease
- 3.1.3. Stages of Alzheimer's Disease
- 3.2. Alzheimer's Disease Management: Programs Undertaken by The National Institutes of Health
- 3.3. Alzheimer's Disease Management
- 3.4. Digital Biomarkers in Alzheimer's Disease
- 3.4.1. Potential of Digital Biomarkers in Alzheimer's Disease
- 3.4.2. Sensors or Digital Senses in Wearable / Mobile Devices for Alzheimer's Disease
4. PIPELINE REVIEW: MARKETED AND CLINICAL- STAGE DRUGS
- 4.1. Analysis Methodology and Key Parameters
- 4.2. Alzheimer's Disease Therapies: Marketed and Development Pipeline
- 4.2.1. Analysis by Phase of Development
- 4.2.2. Analysis by Type of Molecule
- 4.2.3. Analysis by Target Disease Stage
- 4.2.4. Analysis by Type of Treatment
- 4.2.5. Analysis by Mechanism of Action
- 4.2.6. Analysis by Route of Administration
- 4.2.7. Analysis by Dosing Frequency
- 4.2.8. Analysis by Type of Therapy
- 4.2.9. Analysis by Path to Clinic
- 4.2.10. Grid Analysis: Distribution by Phase of Development, Path to Clinic and Type of Therapy
- 4.4. Alzheimer's Disease Therapies: List of Developers
- 4.4.1. Analysis by Year of Establishment
- 4.4.2. Analysis by Company Size and Geographical Location of Headquarters
- 4.4.3. Leading Players: Analysis by Number of Therapies
- 4.4.4. Analysis by Geography
5. COMPANY PROFILES
- 5.1. AbbVie
- 5.1.1. Company Overview
- 5.1.2. Financial Information
- 5.1.3. Product Portfolio
- 5.1.4. Recent Developments and Future Outlook
- 5.2. AC Immune
- 5.2.1. Company Overview
- 5.2.2. Financial Information
- 5.2.3. Product Portfolio
- 5.2.4. Recent Developments and Future Outlook
- 5.3. Biogen
- 5.3.1. Company Overview
- 5.3.2. Financial Information
- 5.3.3. Product Portfolio
- 5.3.4. Recent Developments and Future Outlook
- 5.4. Eisai
- 5.4.1. Company Overview
- 5.4.2. Financial Information
- 5.4.3. Product Portfolio
- 5.4.4. Recent Developments and Future Outlook
- 5.5. Eli Lilly and Company
- 5.5.1. Company Overview
- 5.5.2. Financial Information
- 5.5.3. Product Portfolio
- 5.5.4. Recent Developments and Future Outlook
- 5.6. GlaxoSmithKline
- 5.6.1. Company Overview
- 5.6.2. Financial Information
- 5.6.3. Product Portfolio
- 5.6.4. Recent Developments and Future Outlook
- 5.7. Grifols
- 5.7.1. Company Overview
- 5.7.2. Financial Information
- 5.7.3. Product Portfolio
- 5.7.4. Recent Developments and Future Outlook
- 5.8. Janssen Pharmaceutical
- 5.8.1. Company Overview
- 5.8.2. Financial Information
- 5.8.3. Product Portfolio
- 5.8.4. Recent Developments and Future Outlook
- 5.9. Neurim Pharmaceuticals
- 5.9.1. Company Overview
- 5.9.2. Financial Information
- 5.9.3. Product Portfolio
- 5.9.4. Recent Developments and Future Outlook
- 5.10. Novartis
- 5.10.1. Company Overview
- 5.10.2. Financial Information
- 5.10.3. Product Portfolio
- 5.10.4. Recent Developments and Future Outlook
- 5.11. Novo Nordisk
- 5.11.1. Company Overview
- 5.11.2. Financial Information
- 5.11.3. Product Portfolio
- 5.11.4. Recent Developments and Future Outlook
- 5.12. Roche
- 5.12.1. Company Overview
- 5.12.2. Financial Information
- 5.12.3. Product Portfolio
- 5.12.4. Recent Developments and Future Outlook
- 5.13. Takeda Pharmaceutical
- 5.13.1. Company Overview
- 5.13.2. Financial Information
- 5.13.3. Product Portfolio
- 5.13.4. Recent Developments and Future Outlook
6. CASE STUDY: TERMINATED DRUGS
- 6.1. Chapter Overview
- 6.2. Alzheimer's Disease Therapies: List of Terminated Drugs
- 6.2.1. Analysis by Year of Discontinuation
- 6.2.2. Analysis by Phase of Discontinuation
- 6.2.3. Analysis by Mechanism of Action
- 6.2.4. Analysis by Type of Indication
- 6.2.5. Analysis by Reason for Termination
- 6.2.6. Analysis by Affiliated Stakeholders
- 6.3. Alzheimer's Disease Therapies: List of Terminated Clinical Trials
- 6.3.1. Distribution by Study Start Year and Year of Termination of Clinical Trials
- 6.3.2. Analysis by Location of Trials
- 6.4. Concluding Remarks
7. PUBLICATION ANALYSIS
- 7.1. Analysis Methodology and Key Parameters
- 7.2. Alzheimer's Disease: List of Publications
- 7.3. Analysis by Year of Publication
- 7.4. Analysis by Key Focus Area
- 7.5. Word Cloud of Study Titles
- 7.6. Top Journal: Analysis by Number of Publications
- 7.6. Top Author: Analysis by Number of Publications
8. PARTNERSHIPS AND COLLABORATIONS
- 8.1. Analysis Methodology and Key Parameters
- 8.2. Partnership Models
- 8.3. Alzheimer's Disease: List of Partnerships and Collaborations
- 8.3.1. Analysis by Year of Partnership
- 8.3.2. Analysis by Type of Partnership
- 8.3.3. Analysis by Type of Partnership and Focus Area of Partnership
- 8.3.4. Analysis by Type of Partnership and Type of Molecule
- 8.3.5. Most Active Players: Analysis by Number of Partnerships
- 8.3.6. Regional Analysis
- 8.3.7. Intercontinental and Intracontinental Agreements
9. FUNDING AND INVESTMENT ANALYSIS
- 9.1. Analysis Methodology and Key Parameters
- 9.2. Types of Funding
- 9.3. Funding and Investment Analysis
- 9.3.1. Analysis by Year of Investment
- 9.3.2. Analysis by Amount Invested
- 9.3.3. Analysis by Type of Funding
- 9.3.4 Analysis by Amount Invested Across Different Types of Molecules
- 9.3.5 Analysis by Amount Invested Across Different Types of Mechanism of Action
- 9.3.6. Regional Analysis by Amount Invested
- 9.3.7. Most Active Players: Analysis by Number of Funding Instances
- 9.3.8. Most Active Investors: Analysis by Amount Funded
10. GRANT ANALYSIS
- 10.1. Analysis Methodology and Key Parameters
- 10.2. Alzheimer's Disease: List of Academic Grants
- 10.2.1. Analysis by Year of Grant Award
- 10.2.2. Analysis by Grant Amount Awarded
- 10.2.3. Analysis by Administering Institute Center
- 10.2.4. Analysis by Support Period
- 10.2.5. Analysis by Administering Institute Center and Support Year
- 10.2.6. Analysis by Type of Grant Application
- 10.2.7. Analysis by Grant Activity Code
- 10.2.8. Word Cloud of Study Titles
- 10.2.9. Analysis by Purpose of Grant Award
- 10.2.10. Analysis by Type of Recipient Organization
- 10.2.11. Popular NIH Departments: Analysis by Number of Grants
- 10.2.12. Prominent Program Officers: Analysis by Number of Grants
11. CLINICAL TRIAL ANALYSIS
- 11.1. Analysis Methodology and Key Parameters
- 11.2. Alzheimer's Disease: Clinical Trial Analysis
- 11.3.1. Analysis by Trial Status
- 11.3.2. Analysis by Trial Registration Year
- 11.3.3. Analysis by Type of Sponsor / Collaborator
- 11.3.3. Analysis by Type of Study Design
- 11.3.4. Analysis by Registration Year and Type of Study
- 11.3.5. Analysis by Patient Enrollment
- 11.3.6. Year-wise Trend of Completed and Recruiting Trials
- 11.3.7. Analysis by Age Category
- 11.3.8. Word Cloud of Study Titles
- 11.3.9. Most Active Industry Players: Analysis by Number of Registered Trials
- 11.3.10. Most Active Non- Industry Players: Analysis by Number of Registered Trials
- 11.3.11. Analysis by Trial Location
- 11.3.12. Analysis by Trial Status and Geography
12. PATENT ANALYSIS
- 12.1. Analysis Methodology and Key Parameters
- 12.2. Alzheimer's Disease: Patent Analysis
- 12.2.1. Analysis by Patent Application Year
- 12.2.2. Analysis by Geography
- 12.2.3. Analysis by CPC Symbols
- 12.2.4. Word Cloud: Emerging Focus Areas
- 12.2.5. Analysis by Type of Applicant
- 12.2.6. Leading Players: Analysis by Number of Patents
- 12.2.7 Leading Players: Analysis by Number of International Patents
- 12.2.8. Patent Valuation Analysis
13. NON-PHARMACOLOGICAL INTERVENTIONS AND DIAGNOSTICS
- 13.1. Non-Pharmacological Interventions for Alzheimer's Disease
- 13.1.1. Cognition / Emotion-Oriented Interventions
- 13.1.1.1. Reminiscence Therapy
- 13.1.1.2. Simulated Presence Therapy
- 13.1.2. Sensory Stimulation-based Interventions
- 13.1.2.1. Virtual Reality
- 13.1.2.2. Music Therapy
- 13.1.2.3. Light Therapy
- 13.1.2.4. Aromatherapy
- 13.1.2.5. Reflexology
- 13.1.3. Other Psycho-social Interventions
- 13.1.3.1. Animal-Assisted Therapy
- 13.1.1. Cognition / Emotion-Oriented Interventions
14. MARKET SIZING AND OPPORTUNITY ANALYSIS
- 14.1. Forecast Methodology and Key Assumptions
- 14.2. Global Alzheimer's Disease Market, Till 2035
- 14.3. Global Alzheimer's Disease Market, Till 2035: Distribution by Type of Treatment
- 14.4. Global Alzheimer's Disease Market, Till 2035: Distribution by Type of Target Disease Indication
- 14.5. Global Alzheimer's Disease Market, Till 2035: Distribution by Geography
- 14.5.1. Alzheimer's Disease Market in North America, Till 2035
- 14.5.1.1. Alzheimer's Disease Market in North America, Till 2035: Distribution by Type of Treatment
- 14.5.1.1.1. Alzheimer's Disease Market in North America, Till 2035: Distribution by Symptomatic Treatment
- 14.5.1.1.1.1. Alzheimer's Disease Market in North America, Till 2035: Share of Dementia in Symptomatic Treatment Market
- 14.5.1.1.1.2. Alzheimer's Disease Market in North America, Till 2035: Share of Insomnia in Symptomatic Treatment Market
- 14.5.1.1.1.3. Alzheimer's Disease Market in North America, Till 2035: Share of Other Psychological Symptoms in Symptomatic Treatment Market
- 14.5.1.1.2. Alzheimer's Disease Market in North America, Till 2035: Distribution by Disease Modifying Treatment
- 14.5.1.1.1. Alzheimer's Disease Market in North America, Till 2035: Distribution by Symptomatic Treatment
- 14.5.1.1. Alzheimer's Disease Market in North America, Till 2035: Distribution by Type of Treatment
- 14.5.2. Alzheimer's Disease Market in Europe, Till 2035
- 14.5.2.1. Alzheimer's Disease Market in Europe, Till 2035: Distribution by Type of Treatment
- 14.5.2.1.1. Alzheimer's Disease Market in Europe, Till 2035: Distribution by Symptomatic Treatment
- 14.5.2.1.1.1. Alzheimer's Disease Market in Europe, Till 2035: Share of Dementia in Symptomatic Treatment Market
- 14.5.2.1.1.2. Alzheimer's Disease Market in Europe, Till 2035: Share of Insomnia in Symptomatic Treatment Market
- 14.5.2.1.1.3. Alzheimer's Disease Market in Europe, Till 2035: Share of Other Psychological Symptoms in Symptomatic Treatment Market
- 14.5.2.1.2. Alzheimer's Disease Market in Europe, Till 2035: Distribution by Disease Modifying Treatment
- 14.5.2.1.1. Alzheimer's Disease Market in Europe, Till 2035: Distribution by Symptomatic Treatment
- 14.5.2.1. Alzheimer's Disease Market in Europe, Till 2035: Distribution by Type of Treatment
- 14.5.3. Alzheimer's Disease Market in Asia-Pacific, Till 2035
- 14.5.3.1. Alzheimer's Disease Market in Asia-Pacific, Till 2035: Distribution by Type of Treatment
- 14.5.3.1.1. Alzheimer's Disease Market in Asia-Pacific, Till 2035: Distribution by Symptomatic Treatment
- 14.5.3.1.1.1. Alzheimer's Disease Market in Asia-Pacific, Till 2035: Share of Dementia in Symptomatic Treatment Market
- 14.5.3.1.1.2. Alzheimer's Disease Market in Asia-Pacific, Till 2035: Share of Insomnia in Symptomatic Treatment Market
- 14.5.3.1.1.3. Alzheimer's Disease Market in Asia-Pacific, Till 2035: Share of Other Psychological Symptoms in Symptomatic Treatment Market
- 14.5.3.1.2. Alzheimer's Disease Market in Asia-Pacific, Till 2035: Distribution by Disease Modifying Treatment
- 14.5.3.1.1. Alzheimer's Disease Market in Asia-Pacific, Till 2035: Distribution by Symptomatic Treatment
- 14.5.3.1. Alzheimer's Disease Market in Asia-Pacific, Till 2035: Distribution by Type of Treatment
- 14.5.1. Alzheimer's Disease Market in North America, Till 2035
15. CONCLUDING REMARKS
16. EXECUTIVE INSIGHTS
- 16.1. Cognition Therapeutics
- 16.1.1. Company Snapshot
- 16.1.1. Interview Transcript: Kenneth Moch (President and Chief Executive Officer)
- 16.2. ArmaGen
- 16.2.1. Company Snapshot
- 16.2.2. Interview Transcript: Mathias Schmidt (Chief Executive Officer)
- 16.2. ICB International
- 16.2.1. Company Snapshot
- 16.3.2. Interview Transcript: Ram Bhatt (Chief Executive Officer, Chairman and Founder)
17. APPENDIX 1: TABULATED DATA
18. APPENDIX 2: LIST OF COMPANIES AND ORGANIZATIONS
List of Tables
- Table 4.1 Alzheimer's Disease: Marketed and Clinical Development Pipeline
- Table 4.2 Alzheimer's Disease Therapies: List of Developers
- Table 6.1 Alzheimer's Disease Therapies: List of Terminated Drugs
- Table 7.1 Alzheimer's Disease: List of Publications
- Table 8.1 Alzheimer's Disease: List of Partnerships and Collaborations
- Table 9.1 Alzheimer's Disease: List of Funding and Investments
- Table 10.1 Alzheimer's Disease: List of Academic Grants
- Table 11.1 Alzheimer's Disease: List of Clinical Trials
- Table 12.1 Alzheimer's Disease: List of Patents
- Table 17.1. Marketed and Clinical-Stage Drugs: Distribution by Phase of Development
- Table 17.2. Marketed and Clinical-Stage Drugs: Distribution by Type of Molecule
- Table 17.3. Marketed and Clinical-Stage Drugs: Distribution by Target Disease Stage
- Table 17.4. Marketed and Clinical-Stage Drugs: Distribution by Type of Treatment
- Table 17.5. Marketed and Clinical-Stage Drugs: Distribution by Mechanism of Action
- Table 17.6. Marketed and Clinical-Stage Drugs: Distribution by Route of Administration
- Table 17.7. Marketed and Clinical-Stage Drugs: Distribution by Dosing Frequency
- Table 17.8. Marketed and Clinical-Stage Drugs: Distribution by Type of Therapy
- Table 17.9. Marketed and Clinical-Stage Drugs: Distribution by Path to Clinic
- Table 17.10. Grid Analysis: Distribution by Phase of Development, Path to Clinic and Type of Therapy
- Table 17.11. Alzheimer's Disease Therapies: List of Developers
- Table 17.12. Alzheimer's Disease Therapy Developers: Distribution by Year of Establishment
- Table 17.13. Alzheimer's Disease Therapy Developers: Distribution by Company Size and Geographical Location of Headquarters
- Table 17.14. Leading Players: Distribution by Number of Therapies
- Table 17.15. Alzheimer's Disease Therapy Developers: Distribution by Geography
- Table 17.16. AbbVie: Financial Information
- Table 17.17. AC Immune: Financial Information
- Table 17.18. Biogen: Financial Information
- Table 17.19. Eisai: Financial Information
- Table 17.20. Eli Lilly and Company: Financial Information
- Table 17.21. GlaxoSmithKline: Financial Information
- Table 17.22. Grifols: Financial Information
- Table 17.23. Janssen Pharmaceutical: Financial Information
- Table 17.24. Neurim Pharmaceuticals: Financial Information
- Table 17.25. Novartis: Financial Information
- Table 17.26. Novo Nordisk: Financial Information
- Table 17.27. Roche: Financial Information
- Table 17.28. Takeda Pharmaceutical: Financial Information
- Table 17.29. Terminated Drugs: Distribution by Year of Discontinuation
- Table 17.30. Terminated Drugs: Distribution by Phase of Discontinuation
- Table 17.31. Terminated Drugs: Distribution by Mechanism of Action
- Table 17.32. Terminated Drugs: Distribution by Type of Indication
- Table 17.33. Terminated Drugs: Distribution by Reason for Termination
- Table 17.34. Terminated Drugs: Distribution by Affiliated Stakeholders
- Table 17.35. Terminated Drugs: Distribution by Study Start Year and Year of Termination of Clinical Trials
- Table 17.36. Terminated Drugs: Distribution by Location of Trials
- Table 17.37. Publication Analysis: Distribution by Year of Publication
- Table 17.38. Publication Analysis: Distribution by Key Focus Area
- Table 17.39. Publication Analysis: Word Cloud of Study Titles
- Table 17.40. Top Journals: Distribution by Number of Publications
- Table 17.41. Top Authors: Distribution by Number of Publications
- Table 17.42. Partnerships and Collaborations: Distribution by Year of Partnership
- Table 17.43. Partnerships and Collaborations: Distribution by Type of Partnership
- Table 17.44. Partnerships and Collaborations: Distribution by Type of Partnership and Focus Area of Partnership
- Table 17.45. Partnerships and Collaborations: Distribution by Type of Partnership and Type of Molecule
- Table 17.46. Most Active Players: Distribution by Number of Partnerships
- Table 17.47. Partnerships and Collaborations: Regional Distribution
- Table 17.48. Partnerships and Collaborations: Intercontinental and Intracontinental Agreements
- Table 17.49. Funding and Investment Analysis: Distribution by Year of Investment
- Table 17.50. Funding and Investment Analysis: Distribution by Amount Invested
- Table 17.51. Funding and Investment Analysis: Distribution by Type of Funding
- Table 17.52. Funding and Investment Analysis: Distribution by Amount Invested Across Different Types of Molecules
- Table 17.53. Funding and Investment Analysis: Distribution by Amount Invested Across Different Types of Mechanism of Action
- Table 17.54. Funding and Investment Analysis: Regional Distribution by Amount Invested
- Table 17.55. Most Active Players: Distribution by Number of Funding Instances
- Table 17.56. Most Active Investors: Distribution by Amount Funded
- Table 17.57. Grant Analysis: Distribution by Year of Grant Award
- Table 17.58. Grant Analysis: Distribution by Grant Amount Awarded
- Table 17.59. Grant Analysis: Distribution by Administering Institute Center
- Table 17.60. Grant Analysis: Distribution by Support Period
- Table 17.61. Grant Analysis: Distribution by Administering Institute Center and Support Year
- Table 17.62. Grant Analysis: Distribution by Type of Grant Application
- Table 17.63. Grant Analysis: Distribution by Grant Activity Code
- Table 17.64. Grant Analysis: Word Cloud of Study Titles
- Table 17.65. Grant Analysis: Distribution by Purpose of Grant Award
- Table 17.66. Grant Analysis: Distribution by Type of Recipient Organization
- Table 17.67. Popular NIH Departments: Distribution by Number of Grants
- Table 17.68. Prominent Program Officers: Distribution by Number of Grants
- Table 17.69. Clinical Trial Analysis: Distribution by Trial Status
- Table 17.70. Clinical Trial Analysis: Distribution by Trial Registration Year
- Table 17.71. Clinical Trial Analysis: Distribution by Type of Sponsor / Collaborator
- Table 17.72. Clinical Trial Analysis: Distribution by Type of Study Design
- Table 17.73. Clinical Trial Analysis: Distribution by Registration Year and Type of Study
- Table 17.74. Clinical Trial Analysis: Distribution by Patient Enrollment
- Table 17.75. Clinical Trial Analysis: Year-wise Trend of Completed and Recruiting Trials
- Table 17.76. Clinical Trial Analysis: Distribution by Age Category
- Table 17.77. Clinical Trial Analysis: Word Cloud of Study Titles
- Table 17.78. Most Active Industry Players: Distribution by Number of Registered Trials
- Table 17.79. Most Active Non-Industry Players: Distribution by Number of Registered Trials
- Table 17.80. Clinical Trial Analysis: Distribution by Trial Location
- Table 17.81. Clinical Trial Analysis: Distribution by Trial Status and Geography
- Table 17.82. Patent Analysis: Distribution by Patent Application Year
- Table 17.83. Patent Analysis: Distribution by Geography
- Table 17.84. Patent Analysis: Distribution by CPC Symbols
- Table 17.85. Word Cloud: Emerging Focus Areas
- Table 17.86. Patent Analysis: Distribution by Type of Applicant
- Table 17.87. Leading Players: Distribution by Number of Patents
- Table 17.88. Leading Players: Distribution by Number of International Patents
- Table 17.89. Patent Analysis: Patent Valuation Analysis
- Table 17.90. Non-Pharmacological Interventions for Alzheimer's Disease
- Table 17.91. Cognition / Emotion-Oriented Interventions
- Table 17.92. Reminiscence Therapy
- Table 17.93. Simulated Presence Therapy
- Table 17.94. Sensory Stimulation-based Interventions
- Table 17.95. Virtual Reality
- Table 17.96. Music Therapy
- Table 17.97. Light Therapy
- Table 17.98. Aromatherapy
- Table 17.99. Reflexology
- Table 17.100. Other Psycho-social Interventions
- Table 17.12. Animal-Assisted Therapy
- Table 17.1. Global Alzheimer's Disease Market, Till 2035 (USD Million)
- Table 17.2. Global Alzheimer's Disease Market, Till 2035: Distribution by Type of Treatment (USD Million)
- Table 17.3. Global Alzheimer's Disease Market, Till 2035: Distribution by Type of Target Disease Indication (USD Million)
- Table 17.4. Global Alzheimer's Disease Market, Till 2035: Distribution by Geography (USD Million)
- Table 17.5. Alzheimer's Disease Market in North America, Till 2035 (USD Million)
- Table 17.6. Alzheimer's Disease Market in North America, Till 2035: Distribution by Type of Treatment (USD Million)
- Table 17.7. Alzheimer's Disease Market in North America, Till 2035: Distribution by Symptomatic Treatment (USD Million)
- Table 17.8. Alzheimer's Disease Market in North America, Till 2035: Share of Dementia in Symptomatic Treatment Market (USD Million)
- Table 17.9. Alzheimer's Disease Market in North America, Till 2035: Share of Insomnia in Symptomatic Treatment Market (USD Million)
- Table 17.10. Alzheimer's Disease Market in North America, Till 2035: Share of Other Psychological Symptoms in Symptomatic Treatment Market (USD Million)
- Table 17.11. Alzheimer's Disease Market in North America, Till 2035: Distribution by Disease Modifying Treatment (USD Million)
- Table 17.12. Alzheimer's Disease Market in Europe, Till 2035 (USD Million)
- Table 17.13. Alzheimer's Disease Market in Europe, Till 2035: Distribution by Type of Treatment (USD Million)
- Table 17.17. Alzheimer's Disease Market in Europe, Till 2035: Distribution by Symptomatic Treatment (USD Million)
- Table 17.15. Alzheimer's Disease Market in Europe, Till 2035: Share of Dementia in Symptomatic Treatment Market (USD Million)
- Table 17.16. Alzheimer's Disease Market in Europe, Till 2035: Share of Insomnia in Symptomatic Treatment Market (USD Million)
- Table 17.17. Alzheimer's Disease Market in Europe, Till 2035: Share of Other Psychological Symptoms in Symptomatic Treatment Market (USD Million)
- Table 17.18. Alzheimer's Disease Market in Europe, Till 2035: Distribution by Disease Modifying Treatment (USD Million)
- Table 17.19. Alzheimer's Disease Market in Asia-Pacific, Till 2035(USD Million)
- Table 17.20. Alzheimer's Disease Market in Asia-Pacific, Till 2035: Distribution by Type of Treatment (USD Million)
- Table 17.21. Alzheimer's Disease Market in Asia-Pacific, Till 2035: Distribution by Symptomatic Treatment (USD Million)
- Table 17.22. Alzheimer's Disease Market in Asia-Pacific, Till 2035: Share of Dementia in Symptomatic Treatment (USD Million)
- Table 17.23. Alzheimer's Disease Market in Asia-Pacific, Till 2035: Share of Insomnia in Symptomatic Treatment (USD Million)
- Table 17.24. Alzheimer's Disease Market in Asia-Pacific, Till 2035: Share of Other Psychological Symptoms in Symptomatic Treatment (USD Million)
- Table 17.25. Alzheimer's Disease Market in Asia-Pacific, Till 2035: Distribution by Disease Modifying Treatment (USD Million)
List of Figures
- Figure 3.1. Overview of Alzheimer's Disease
- Figure 3.2. Alzheimer's Disease: Signs and Symptoms
- Figure 3.3. Causes of Alzheimer's Disease
- Figure 3.4. Stages of Alzheimer's Disease
- Figure 3.5. Alzheimer's Disease Management: Programs Undertaken by The National Institutes of Health
- Figure 3.6. Alzheimer's Disease Management
- Figure 3.7. Digital Biomarkers in Alzheimer's Disease
- Figure 3.8. Potential of Digital Biomarkers in Alzheimer's Disease
- Figure 3.9. Sensors or Digital Senses in Wearable / Mobile Devices for Alzheimer's Disease
- Figure 4.1. Marketed and Clinical-Stage Drugs: Distribution by Phase of Development
- Figure 4.2. Marketed and Clinical-Stage Drugs: Distribution by Type of Molecule
- Figure 4.3. Marketed and Clinical-Stage Drugs: Distribution by Target Disease Stage
- Figure 4.4. Marketed and Clinical-Stage Drugs: Distribution by Type of Treatment
- Figure 4.5. Marketed and Clinical-Stage Drugs: Distribution by Mechanism of Action
- Figure 4.6. Marketed and Clinical-Stage Drugs: Distribution by Route of Administration
- Figure 4.7. Marketed and Clinical-Stage Drugs: Distribution by Dosing Frequency
- Figure 4.8. Marketed and Clinical-Stage Drugs: Distribution by Type of Therapy
- Figure 4.9. Marketed and Clinical-Stage Drugs: Distribution by Path to Clinic
- Figure 4.10. Grid Analysis: Distribution by Phase of Development, Path to Clinic and Type of Therapy
- Figure 4.11. Alzheimer's Disease Therapies: List of Developers
- Figure 4.12. Alzheimer's Disease Therapy Developers: Distribution by Year of Establishment
- Figure 4.13. Alzheimer's Disease Therapy Developers: Distribution by Company Size and Geographical Location of Headquarters
- Figure 4.14. Leading Players: Distribution by Number of Therapies
- Figure 4.15. Alzheimer's Disease Therapy Developers: Distribution by Geography
- Figure 5.1. AbbVie: Financial Information
- Figure 5.2. AC Immune: Financial Information
- Figure 5.3. Biogen: Financial Information
- Figure 5.4. Eisai: Financial Information
- Figure 5.5. Eli Lilly and Company: Financial Information
- Figure 5.6. GlaxoSmithKline: Financial Information
- Figure 5.7. Grifols: Financial Information
- Figure 5.8. Janssen Pharmaceutical: Financial Information
- Figure 5.9. Neurim Pharmaceuticals: Financial Information
- Figure 5.10. Novartis: Financial Information
- Figure 5.11. Novo Nordisk: Financial Information
- Figure 5.12. Roche: Financial Information
- Figure 5.13. Takeda Pharmaceutical: Financial Information
- Figure 6.1. Terminated Drugs: Distribution by Year of Discontinuation
- Figure 6.2. Terminated Drugs: Distribution by Phase of Discontinuation
- Figure 6.3. Terminated Drugs: Distribution by Mechanism of Action
- Figure 6.4. Terminated Drugs: Distribution by Type of Indication
- Figure 6.5. Terminated Drugs: Distribution by Reason for Termination
- Figure 6.6. Terminated Drugs: Distribution by Affiliated Stakeholders
- Figure 6.7. Terminated Drugs: Distribution by Study Start Year and Year of Termination of Clinical Trials
- Figure 6.8. Terminated Drugs: Distribution by Location of Trials
- Figure 7.1. Publication Analysis: Distribution by Year of Publication
- Figure 7.2. Publication Analysis: Distribution by Key Focus Area
- Figure 7.3. Publication Analysis: Word Cloud of Study Titles
- Figure 7.4. Top Journals: Distribution by Number of Publications
- Figure 7.5. Top Authors: Distribution by Number of Publications
- Figure 8.1. Partnerships and Collaborations: Distribution by Year of Partnership
- Figure 8.2. Partnerships and Collaborations: Distribution by Type of Partnership
- Figure 8.3. Partnerships and Collaborations: Distribution by Type of Partnership and Focus Area of Partnership
- Figure 8.4. Partnerships and Collaborations: Distribution by Type of Partnership and Type of Molecule
- Figure 8.5. Most Active Players: Distribution by Number of Partnerships
- Figure 8.6. Partnerships and Collaborations: Regional Distribution
- Figure 8.7. Partnerships and Collaborations: Intercontinental and Intracontinental Agreements
- Figure 9.1. Funding and Investment Analysis: Distribution by Year of Investment
- Figure 9.2. Funding and Investment Analysis: Distribution by Amount Invested
- Figure 9.3. Funding and Investment Analysis: Distribution by Type of Funding
- Figure 9.4. Funding and Investment Analysis: Distribution by Amount Invested Across Different Types of Molecules
- Figure 9.5. Funding and Investment Analysis: Distribution by Amount Invested Across Different Types of Mechanism of Action
- Figure 9.6. Funding and Investment Analysis: Regional Distribution by Amount Invested
- Figure 9.7. Most Active Players: Distribution by Number of Funding Instances
- Figure 9.8. Most Active Investors: Distribution by Amount Funded
- Figure 10.1. Grant Analysis: Distribution by Year of Grant Award
- Figure 10.2. Grant Analysis: Distribution by Grant Amount Awarded
- Figure 10.3. Grant Analysis: Distribution by Administering Institute Center
- Figure 10.4. Grant Analysis: Distribution by Support Period
- Figure 10.5. Grant Analysis: Distribution by Administering Institute Center and Support Year
- Figure 10.6. Grant Analysis: Distribution by Type of Grant Application
- Figure 10.7. Grant Analysis: Distribution by Grant Activity Code
- Figure 10.8. Grant Analysis: Word Cloud of Study Titles
- Figure 10.9. Grant Analysis: Distribution by Purpose of Grant Award
- Figure 10.10. Grant Analysis: Distribution by Type of Recipient Organization
- Figure 10.11. Popular NIH Departments: Distribution by Number of Grants
- Figure 10.12. Prominent Program Officers: Distribution by Number of Grants
- Figure 11.1. Clinical Trial Analysis: Distribution by Trial Status
- Figure 11.2. Clinical Trial Analysis: Distribution by Trial Registration Year
- Figure 11.3. Clinical Trial Analysis: Distribution by Type of Sponsor / Collaborator
- Figure 11.4. Clinical Trial Analysis: Distribution by Type of Study Design
- Figure 11.5. Clinical Trial Analysis: Distribution by Registration Year and Type of Study
- Figure 11.6. Clinical Trial Analysis: Distribution by Patient Enrollment
- Figure 11.7. Clinical Trial Analysis: Year-wise Trend of Completed and Recruiting Trials
- Figure 11.8. Clinical Trial Analysis: Distribution by Age Category
- Figure 11.9. Clinical Trial Analysis: Word Cloud of Study Titles
- Figure 11.10. Most Active Industry Players: Distribution by Number of Registered Trials
- Figure 11.11. Most Active Non-Industry Players: Distribution by Number of Registered Trials
- Figure 11.12. Clinical Trial Analysis: Distribution by Trial Location
- Figure 11.13. Clinical Trial Analysis: Distribution by Trial Status and Geography
- Figure 12.1. Patent Analysis: Distribution by Patent Application Year
- Figure 12.2. Patent Analysis: Distribution by Geography
- Figure 12.3. Patent Analysis: Distribution by CPC Symbols
- Figure 12.4. Word Cloud: Emerging Focus Areas
- Figure 12.5. Patent Analysis: Distribution by Type of Applicant
- Figure 12.6. Leading Players: Distribution by Number of Patents
- Figure 12.7 Leading Players: Distribution by Number of International Patents
- Figure 12.8. Patent Analysis: Patent Valuation Analysis
- Figure 13.1. Non-Pharmacological Interventions for Alzheimer's Disease
- Figure 13.2. Cognition / Emotion-Oriented Interventions
- Figure 13.3. Reminiscence Therapy
- Figure 13.4. Simulated Presence Therapy
- Figure 13.5. Sensory Stimulation-based Interventions
- Figure 13.6. Virtual Reality
- Figure 13.7. Music Therapy
- Figure 13.8. Light Therapy
- Figure 13.9. Aromatherapy
- Figure 13.10. Reflexology
- Figure 13.11. Other Psycho-social Interventions
- Figure 13.12. Animal-Assisted Therapy
- Figure 14.1. Global Alzheimer's Disease Market, Till 2035 (USD Million)
- Figure 14.2. Global Alzheimer's Disease Market, Till 2035: Distribution by Type of Treatment (USD Million)
- Figure 14.3. Global Alzheimer's Disease Market, Till 2035: Distribution by Type of Target Disease Indication (USD Million)
- Figure 14.4. Global Alzheimer's Disease Market, Till 2035: Distribution by Geography (USD Million)
- Figure 14.5. Alzheimer's Disease Market in North America, Till 2035 (USD Million)
- Figure 14.6. Alzheimer's Disease Market in North America, Till 2035: Distribution by Type of Treatment (USD Million)
- Figure 14.7. Alzheimer's Disease Market in North America, Till 2035: Distribution by Symptomatic Treatment (USD Million)
- Figure 14.8. Alzheimer's Disease Market in North America, Till 2035: Share of Dementia in Symptomatic Treatment Market (USD Million)
- Figure 14.9. Alzheimer's Disease Market in North America, Till 2035: Share of Insomnia in Symptomatic Treatment Market (USD Million)
- Figure 14.10. Alzheimer's Disease Market in North America, Till 2035: Share of Other Psychological Symptoms in Symptomatic Treatment Market (USD Million)
- Figure 14.11. Alzheimer's Disease Market in North America, Till 2035: Distribution by Disease Modifying Treatment (USD Million)
- Figure 14.12. Alzheimer's Disease Market in Europe, Till 2035 (USD Million)
- Figure 14.13. Alzheimer's Disease Market in Europe, Till 2035: Distribution by Type of Treatment (USD Million)
- Figure 14.14. Alzheimer's Disease Market in Europe, Till 2035: Distribution by Symptomatic Treatment (USD Million)
- Figure 14.15. Alzheimer's Disease Market in Europe, Till 2035: Share of Dementia in Symptomatic Treatment Market (USD Million)
- Figure 14.16. Alzheimer's Disease Market in Europe, Till 2035: Share of Insomnia in Symptomatic Treatment Market (USD Million)
- Figure 14.17. Alzheimer's Disease Market in Europe, Till 2035: Share of Other Psychological Symptoms in Symptomatic Treatment Market (USD Million)
- Figure 14.18. Alzheimer's Disease Market in Europe, Till 2035: Distribution by Disease Modifying Treatment (USD Million)
- Figure 14.19. Alzheimer's Disease Market in Asia-Pacific, Till 2035(USD Million)
- Figure 14.20. Alzheimer's Disease Market in Asia-Pacific, Till 2035: Distribution by Type of Treatment (USD Million)
- Figure 14.21. Alzheimer's Disease Market in Asia-Pacific, Till 2035: Distribution by Symptomatic Treatment (USD Million)
- Figure 14.22. Alzheimer's Disease Market in Asia-Pacific, Till 2035: Share of Dementia in Symptomatic Treatment (USD Million)
- Figure 14.23. Alzheimer's Disease Market in Asia-Pacific, Till 2035: Share of Insomnia in Symptomatic Treatment (USD Million)
- Figure 14.24. Alzheimer's Disease Market in Asia-Pacific, Till 2035: Share of Other Psychological Symptoms in Symptomatic Treatment (USD Million)
- Figure 14.25. Alzheimer's Disease Market in Asia-Pacific, Till 2035: Distribution by Disease Modifying Treatment (USD Million)

