
PUBLISHER: Roots Analysis | PRODUCT CODE: 1762522

PUBLISHER: Roots Analysis | PRODUCT CODE: 1762522
Antisense Oligonucleotides Market: Industry Trends and Global Forecasts - Distribution by Type of Antisense Molecule, Type of ASO Generation, Target Disease Indication, Route of Administration, Type of Therapy, and Geography
ANTISENSE OLIGONUCLEOTIDES MARKET: OVERVIEW
As per Roots Analysis, the global antisense oligonucleotides market valued at USD 2.5 billion in the current year is anticipated to grow at a lucrative CAGR of 15% during the forecast period.
The market sizing and opportunity analysis has been segmented across the following parameters:
Type of Antisense Molecule
- DNA Molecules
- RNA Molecules
Type of ASO Generation
- First-Generation Products
- Second-Generation Products
- Third-Generation Products
Target Disease Indication
- Amyotrophic Lateral Sclerosis
- Duchenne Muscular Dystrophy
- Familial Chylomicronemia Syndrome
- Familial Partial Lipodystrophy
- Hereditary Transthyretin-Mediated (hATTR) Amyloidosis
- Huntington's Disease
- Leber's Congenital Amaurosis
- Spinal Muscular Atrophy
Route of Administration
- Intrathecal Therapies
- Intravenous Therapies
- Intravitreal Therapies
- Subcutaneous Therapies
- Intraorifice Therapies
Type of Therapy
- Combination Therapies
- Monotherapies
Geography
- North America
- Europe
- Asia-Pacific
- Rest of the World
ANTISENSE OLIGONUCLEOTIDES MARKET: GROWTH AND TRENDS
Oligonucleotides are short single stranded DNA or RNA molecules, that comprise 15-20 nucleotide residues. In modern biopharmaceuticals, the applications of these oligonucleotides are vast, including (but not limited to) genetic testing, fundamental biomolecular research, and forensic analysis. Antisense oligonucleotides, a diverse class of oligonucleotides are short, single-stranded RNA / DNA molecules specifically binding to the target mRNA and have the ability to modify protein expression through a variety of mechanisms.
Antisense therapeutics are considered to be one of the most promising agents for impairing protein production and blocking the function of the specific target gene of interest in the human genome. Presently, this mechanism forms the basis for many therapeutics being investigated in different stages of clinical trials for treatment of a variety of disorders, including oncological disorders, genetic diseases, hepatic diseases, respiratory disorders and infectious diseases. In fact, in the recent past, the oligonucleotide drug developers had also investigated the relevance of these interventions against the Coronavirus (COVID-19). Given the pace of innovation and developments in the antisense oligonucleotides market, we can expect antisense oligonucleotides to become a major therapeutic modality in the foreseen future.
ANTISENSE OLIGONUCLEOTIDES MARKET: KEY INSIGHTS
The report delves into the current state of the antisense oligonucleotides market and identifies potential growth opportunities within industry. Some key findings from the report include:
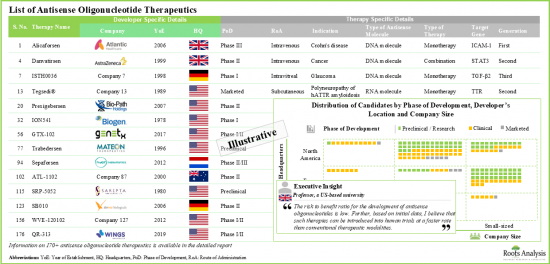
- Around 30 players from are presently engaged in evaluating the potential therapeutic benefits of antisense oligonucleotides for the treatment of a wide range of disease indications, worldwide.
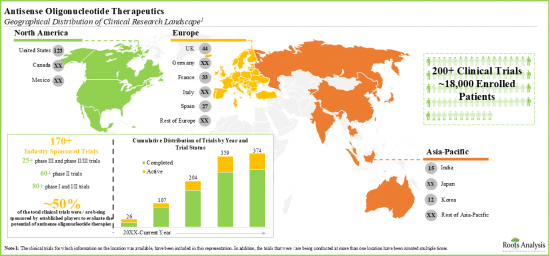
- The pipeline features 170+ candidate therapies in different stages of development, being evaluated either as monotherapies or in combination with other interventions; most of these products are administered parenterally.
- Majority of the approved therapies and late-stage candidates are intended for the treatment of genetic disorders, neurological disorders and oncological disorders.
- Given the advantages of antisense oligonucleotides, these interventions are primarily evaluated as monotherapy. Late-stage drugs being investigated as monotherapy include Tofersen and Pelacarsen.
- Over 18,000 patients have been enrolled in clinical trial sites evaluating close to 70 antisense oligonucleotide-based therapy candidates.
- Majority of the antisense oligonucleotide therapeutics are designed for subcutaneous administration; these can be self-administered by the patients using different drug delivery systems.
- Several organizations have extended financial support to aid research efforts in this domain; currently, the focus, in terms of funds disbursed, is primarily in support of investigations of drugs for treating neurological conditions.
- The number of grants awarded to stakeholders in this domain (in the US) has continuously increased in the past few years; more than 70% of the total amount was awarded for research projects.
- The field has witnessed the involvement of various administering institutes of the NIH; of all the institutes, participation of the NINDS, NHLBI, and NCI has been relatively more prominent.
- The rising interest in this field is reflected in the number of partnerships inked by the various stakeholders across different application areas.
- Given that nearly 20 molecules are in the late stages of development, companies have primarily collaborated for product development and commercialization purposes.
- Both established players and the new entrants have forged strategic partnerships in the recent past; these deals have primarily been inked for genetic and neurological disorders.
- The future opportunity, in terms of revenues from the sales of marketed and late-stage therapies, is anticipated to be well distributed across different disease areas, types of molecules and key geographical regions.
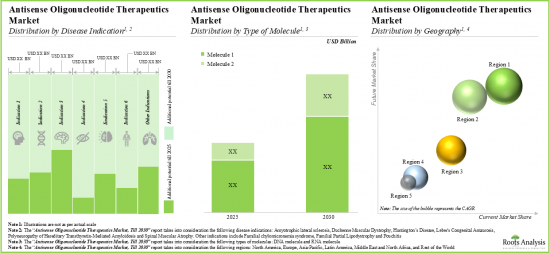
- The market is likely to witness steady growth over the coming decade; the opportunity will be dispersed across different generations, routes of administration and various types of therapies.
Example Players in the Antisense Oligonucleotides Market
- Antisense Therapeutics
- Biogen
- Bio-Path Holdings
- Ionis Pharmaceuticals
- ProQR Therapeutics
- Sarepta Therapeutics
- Sterna Biologicals
- Wave Life Sciences
ANTISENSE OLIGONUCLEOTIDES MARKET: RESEARCH COVERAGE
- Market Sizing and Opportunity Analysis: The report features an in-depth analysis of the global antisense oligonucleotides market, focusing on key market segments, including [A] type of antisense molecule, [B] type of ASO generation, [C] target disease indication, [D] route of administration, [E] type of therapy and [F] geography.
- Market Landscape: A comprehensive evaluation of antisense oligonucleotide therapeutics, based on several relevant parameters, such as [A] type of antisense molecule, [B] ASO generation, [C] phase of development of lead candidates, [D] target genes, [E] target disease indications, [F] target therapeutic areas, [G] route of administration and [H] type of therapy. Additionally, a comprehensive evaluation of drug developers, based on several relevant parameters, such as [A] year of establishment, [B] company size and [C] location of headquarters.
- Company Profiles: In-depth profiles of antisense oligonucleotide therapeutic developers, focusing on [A] overview of the company, [B] financial information (if available), [C] product portfolio and [D] recent developments and an informed future outlook.
- Clinical Trial Analysis: An insightful analysis of clinical trials related to antisense oligonucleotide therapeutics, based on several parameters, such as [A] trial registration year, [B] trial phase, [C] trial recruitment status, [D] enrolled patient population, [E] study design, leading industry sponsors / collaborators (in terms of number of trials conducted), [F] trial focus, [G] target therapeutic area and [H] target genes.
- Grants Analysis: A comprehensive assessment of grants that have been awarded to research institutes for antisense oligonucleotide therapeutic projects, based on various relevant parameters, such as [A] year of grant award, [B] amount awarded, [C] administering institute center, [D] support period, [E] type of grant application, [F] purpose of grant award, [G] activity code, [H] study section involved, [I] type of recipient organizations and [J] focus area. Additionally, a comprehensive assessment of grants focusing on, [A] geographical distribution of recipient organizations, [B] popular therapeutic areas, [C] popular funding institute centers, [D] prominent program officers and [E] popular recipient organizations.
- Partnerships and Collaborations: An insightful analysis of the deals inked by stakeholders in the antisense oligonucleotide market, based on several parameters, such as [A] year of partnership, [B] type of partnership, [C] most active players (in terms of number of partnerships signed) and [D] regional analysis.
- Case Study: A detailed discussion on the oligonucleotide CMOs and purification service providers, highlighting information on the [A] year of establishment, [B] company size, [C] scale of operation, [D] location of headquarters and [E] type of purification method used.
KEY QUESTIONS ANSWERED IN THIS REPORT
- How many companies are currently engaged in this market?
- Which are the leading companies in this market?
- What factors are likely to influence the evolution of this market?
- What is the current and future market size?
- What is the CAGR of this market?
- How is the current and future market opportunity likely to be distributed across key market segments?
REASONS TO BUY THIS REPORT
- The report provides a comprehensive market analysis, offering detailed revenue projections of the overall market and its specific sub-segments. This information is valuable to both established market leaders and emerging entrants.
- Stakeholders can leverage the report to gain a deeper understanding of the competitive dynamics within the market. By analyzing the competitive landscape, businesses can make informed decisions to optimize their market positioning and develop effective go-to-market strategies.
- The report offers stakeholders a comprehensive overview of the market, including key drivers, barriers, opportunities, and challenges. This information empowers stakeholders to stay abreast of market trends and make data-driven decisions to capitalize on growth prospects.
ADDITIONAL BENEFITS
- Complimentary PPT Insights Packs
- Complimentary Excel Data Packs for all Analytical Modules in the Report
- 15% Free Content Customization
- Detailed Report Walkthrough Session with Research Team
- Free Updated report if the report is 6-12 months old or older
TABLE OF CONTENTS
1. PREFACE
- 1.1. Scope of the Report
- 1.2. Research Methodology
- 1.2.1. Research Assumptions
- 1.2.2. Project Methodology
- 1.2.3. Forecast Methodology
- 1.2.4. Robust Quality Control
- 1.2.5. Key Considerations
- 1.2.5.1. Demographics
- 1.2.5.2. Economic Factors
- 1.2.5.3. Government Regulations
- 1.2.5.4. Supply Chain
- 1.2.5.5. COVID Impact / Related Factors
- 1.2.5.6. Market Access
- 1.2.5.7. Healthcare Policies
- 1.2.5.8. Industry Consolidation
- 1.3 Key Questions Answered
- 1.4. Chapter Outlines
2. EXECUTIVE SUMMARY
3. INTRODUCTION
- 3.1. Chapter Overview
- 3.2. Overview on Oligonucleotides and Affiliated Medical Products
- 3.2.1. Types of Oligonucleotides
- 3.2.1.1. Antisense Oligonucleotides (ASOs)
- 3.2.1.2. Aptamers
- 3.2.1.3. miRNA
- 3.2.1.4. shRNA
- 3.2.1.5. siRNA
- 3.2.1.6. Other Oligonucleotides
- 3.2.1. Types of Oligonucleotides
- 3.3. Oligonucleotide Therapeutics
- 3.3.1. RNA-Interference Therapeutics
- 3.3.1.1. Components of RNA-Interference Therapeutics
- 3.3.1.2. Mechanism of RNA-Interference Therapeutics
- 3.3.2. Antisense Oligonucleotide Therapeutics
- 3.3.2.1. Mechanism of Antisense Oligonucleotide Therapeutics
- 3.3.2.2. Types of Antisense Oligonucleotide Therapeutics
- 3.3.1. RNA-Interference Therapeutics
- 3.4. Future Perspectives
4. ANTISENSE OLIGONUCLEOTIDE THERAPEUTICS: MARKET LANDSCAPE
- 4.1. Chapter Overview
- 4.2. Antisense Oligonucleotide Therapeutics: Pipeline Review
- 4.2.1. Analysis by Type of Antisense Molecule
- 4.2.2. Analysis by ASO Generation
- 4.2.3. Analysis by Phase of Development
- 4.2.4. Analysis by Target Genes
- 4.2.5. Analysis by Target Indications
- 4.2.6. Analysis by Therapeutic Areas
- 4.2.7. Analysis by Route of Administration
- 4.2.8. Analysis by Type of Therapy
- 4.3. Antisense Oligonucleotide Therapeutics: List of Developers
- 4.3.1. Analysis by Year of Establishment
- 4.3.2. Analysis by Company Size
4. 3.3. Analysis by Location of Headquarters
- 4.4. Grid Analysis: Distribution by Phase of Development, Company Size and Location of Headquarters
5. COMPANY PROFILES
- 5.1. Chapter Overview
- 5.2. Antisense Therapeutics
- 5.2.1. Company Overview
- 5.2.2. Antisense Oligonucleotide Therapeutics Portfolio
- 5.2.3. Recent Developments and Future Outlook
- 5.3. Biogen
- 5.3.1. Company Overview
- 5.3.2. Financial Information
- 5.3.3. Antisense Oligonucleotide Therapeutics Portfolio
- 5.3.4. Recent Developments and Future Outlook
- 5.4. Bio-Path Holdings
- 5.4.1. Company Overview
- 5.4.2. Antisense Oligonucleotide Therapeutics Portfolio
- 5.4.3. Recent Developments and Future Outlook
- 5.5. Ionis Pharmaceuticals
- 5.5.1. Company Overview
- 5.5.2. Financial Information
- 5.5.3. Antisense Oligonucleotide Therapeutics Portfolio
- 5.5.4. Recent Developments and Future Outlook
- 5.6. ProQR Therapeutics
- 5.6.1. Company Overview
- 5.6.2. Antisense Oligonucleotide Therapeutics Portfolio
- 5.6.3. Recent Developments and Future Outlook
- 5.7. Sarepta Therapeutics
- 5.7.1. Company Overview
- 5.7.2. Financial Information
- 5.7.3. Antisense Oligonucleotide Therapeutics Portfolio
- 5.7.4. Recent Developments and Future Outlook
- 5.8. Sterna Biologicals
- 5.8.1. Company Overview
- 5.8.2. Antisense Oligonucleotide Therapeutics Portfolio
- 5.8.3. Recent Developments and Future Outlook
- 5.9. Wave Life Sciences
- 5.9.1. Company Overview
- 5.9.2. Financial Information
- 5.9.3. Antisense Oligonucleotide Therapeutics Portfolio
- 5.9.4. Recent Developments and Future Outlook
6. CLINICAL TRIAL ANALYSIS
- 6.1. Chapter Overview
- 6.2. Scope and Methodology
- 6.3. Antisense Oligonucleotide Therapeutics: Clinical Trial Analysis
- 6.3.1. Analysis by Trial Registration Year
- 6.3.2. Analysis by Trial Phase
- 6.3.3. Analysis by Trial Recruitment Status
- 6.3.4. Analysis by Trial Registration Year and Number of Patients Enrolled
- 6.3.5. Analysis by Study Design
- 6.3.6. Analysis by Type of Sponsor / Collaborator
- 6.3.7. Leading Players: Analysis by Number of Registered Trials
- 6.3.8. Word Cloud: Key Focus Areas
- 6.3.9. Analysis by Target Therapeutic Area
- 6.3.10. Analysis by Trial Registration Year and Target Gene
- 6.3.11. Popular Indications: Analysis by Number of Registered Trials
- 6.3.12. Popular Interventions: Analysis by Number of Registered Trials
- 6.3.13. Geographical Analysis by Number of Registered Trials
- 6.3.14. Geographical Analysis by Number of Patients Enrolled
7. ACADEMIC GRANTS ANALYSIS
- 7.1. Chapter Overview
- 7.2. Scope and Methodology
- 7.3. Antisense Oligonucleotide Therapeutics: Analysis of Academic Grants
- 7.3.1. Analysis by Year of Grant Award
- 7.3.2. Analysis by Amount Awarded
- 7.3.3. Analysis by Administering Institute Center
- 7.3.4. Analysis by Support Period
- 7.3.5. Analysis by Administering Institute Center and Support Period
- 7.3.6. Analysis by Type of Grant Application
- 7.3.7. Analysis by Purpose of Grant Award
- 7.3.8. Analysis by Activity Code
- 7.3.9. Analysis by Study Section Involved
- 7.3.10. Analysis by Type of Recipient Organization
- 7.3.11. Word Cloud Analysis: Emerging Focus Areas
- 7.3.12. Geographical Distribution of Recipient Organizations
- 7.3.13. Popular Therapeutic Areas: Analysis by Number of Grants
- 7.3.14. Popular NIH Departments: Analysis by Number of Grants
- 7.3.15. Prominent Program Officers: Analysis by Number of Grants
- 7.3.16. Popular Recipient Organizations: Analysis by Number of Grants
8. PARTNERSHIPS AND COLLABORATIONS
- 8.1. Chapter Overview
- 8.2. Partnership Models
- 8.3. Antisense Oligonucleotide Therapeutics: List of Partnerships and Collaborations
- 8.3.1. Analysis by Year of Partnership
- 8.3.2. Analysis by Type of Partnership
- 8.3.3. Analysis by Type of Partnership and Generation of Antisense Molecule Involved
- 8.3.4. Analysis by Type of Partnership and Target Therapeutic Area
- 8.3.5. Analysis by Year of Partnership and Type of Partner
- 8.3.6. Analysis by Type of Partnership and Type of Partner
- 8.3.7. Most Active Players: Analysis by Number of Partnerships
- 8.3.8. Regional Analysis
- 8.3.8.1. Intercontinental and Intracontinental Agreements
9. MARKET FORECAST AND OPPORTUNITY ANALYSIS
- 9.1. Chapter Overview
- 9.2. Forecast Methodology and Key Assumptions
- 9.3. Global Antisense Oligonucleotide Therapeutics Market, Till 2035
- 9.4. Global Antisense Oligonucleotide Therapeutics Market, Till 2035: Individual Product Sales Forecasts
- 9.4.1. Alicaforsen (Atlantic Healthcare)
- 9.4.1.1. Target Patient Population
- 9.4.1.2. Sales Forecast
- 9.4.2. Eteplirsen (Sarepta Therapeutics)
- 9.4.2.1. Target Patient Population
- 9.4.2.2. Sales Forecast
- 9.4.3. Golodirsen (Sarepta Therapeutics)
- 9.4.3.1. Target Patient Population
- 9.4.3.2. Sales Forecast
- 9.4.4. Inotersen (Ionis Pharmaceuticals)
- 9.4.4.1. Target Patient Population
- 9.4.4.2. Sales Forecast
- 9.4.5. Sepofarsen (ProQR Therapeutics)
- 9.4.5.1. Target Patient Population
- 9.4.5.2. Sales Forecast
- 9.4.6. Tofersen (Biogen)
- 9.4.6.1. Target Patient Population
- 9.4.6.2. Sales Forecast
- 9.4.7. Tominersen (Roche)
- 9.4.7.1. Target Patient Population
- 9.4.7.2. Sales Forecast
- 9.4.8. Viltolarsen (Nippon Shinyaku)
- 9.4.8.1. Target Patient Population
- 9.4.8.2. Sales Forecast
- 9.4.9. Volanesorsen (Ionis Pharmaceuticals)
- 9.4.9.1. Target Patient Population
- 9.4.9.2. Sales Forecast
- 9.4.1. Alicaforsen (Atlantic Healthcare)
- 9.5. Global Antisense Oligonucleotide Therapeutics Market, Till 2035: Distribution by Type of Antisense Molecule
- 9.5.1. Global Antisense Oligonucleotide Therapeutics Market for RNA Molecules, Till 2035
- 9.5.2. Global Antisense Oligonucleotide Therapeutics Market for DNA Molecules, Till 2035
- 9.6. Global Antisense Oligonucleotide Therapeutics Market, Till 2035: Distribution by ASO Generation
- 9.6.1. Global Antisense Oligonucleotide Therapeutics Market for First-generation Products, Till 2035
- 9.6.2. Global Antisense Oligonucleotide Therapeutics Market for Second-generation Products, Till 2035
- 9.6.3. Global Antisense Oligonucleotide Therapeutics Market for Third-generation Products, Till 2035
- 9.7. Global Antisense Oligonucleotide Therapeutics Market, Till 2035: Distribution by Target Disease Indication
- 9.7.1. Global Antisense Oligonucleotide Therapeutics Market for Amyotrophic Lateral Sclerosis, Till 2035
- 9.7.2. Global Antisense Oligonucleotide Therapeutics Market for Duchenne Muscular Dystrophy, Till 2035
- 9.7.3. Global Antisense Oligonucleotide Therapeutics Market for Familial Chylomicronemia Syndrome, Till 2035
- 9.7.4. Global Antisense Oligonucleotide Therapeutics Market for Familial Partial Lipodystrophy, Till 2035
- 9.7.5. Global Antisense Oligonucleotide Therapeutics Market for Hereditary Transthyretin-Mediated (hATTR) Amyloidosis, Till 2035
- 9.7.6. Global Antisense Oligonucleotide Therapeutics Market for Huntington's Disease, Till 2035
- 9.7.7. Global Antisense Oligonucleotide Therapeutics Market for Leber's Congenital Amaurosis, Till 2035
- 9.7.8. Global Antisense Oligonucleotide Therapeutics Market for Pouchitis, Till 2035
- 9.7.9. Global Antisense Oligonucleotide Therapeutics Market for Spinal Muscular Atrophy, Till 2035
- 9.8. Global Antisense Oligonucleotide Therapeutics Market, Till 2035: Distribution by Route of Administration
- 9.8.1. Global Antisense Oligonucleotide Therapeutics Market for Intrathecal Therapies, Till 2035
- 9.8.2. Global Antisense Oligonucleotide Therapeutics Market for Intravenous Therapies, Till 2035
- 9.8.3. Global Antisense Oligonucleotide Therapeutics Market for Intravitreal Therapies, Till 2035
- 9.8.4. Global Antisense Oligonucleotide Therapeutics Market for Subcutaneous Therapies, Till 2035
- 9.8.5. Global Antisense Oligonucleotide Therapeutics Market for Intraorifice Therapies, Till 2035
- 9.9. Global Antisense Oligonucleotide Therapeutics Market, Till 2035: Distribution by Type of Therapy
- 9.9.1. Global Antisense Oligonucleotide Therapeutics Market for Combination Therapies Till 2035
- 9.9.2. Global Antisense Oligonucleotide Therapeutics Market for Monotherapies, Till 2035
- 9.10. Global Antisense Oligonucleotide Market, Till 2035: Geographical Distribution
- 9.10.1. Antisense Oligonucleotide Market in the US, Till 2035
- 9.10.2. Antisense Oligonucleotide Market in Canada, Till 2035
- 9.10.3. Antisense Oligonucleotide Market in the UK, Till 2035
- 9.10.4. Antisense Oligonucleotide Market in Germany, Till 2035
- 9.10.5. Antisense Oligonucleotide Market in France, Till 2035
- 9.10.6. Antisense Oligonucleotide Market in Italy, Till 2035
- 9.10.7. Antisense Oligonucleotide Market in Spain, Till 2035
- 9.10.8. Antisense Oligonucleotide Market in Australia, Till 2035
- 9.10.9. Antisense Oligonucleotide Market in Japan, Till 2035
- 9.10.10. Antisense Oligonucleotide Market in Korea, Till 2035
- 9.10.11. Antisense Oligonucleotide Market in Brazil, Till 2035
- 9.10.12. Antisense Oligonucleotide Market in Israel, Till 2035
10. CASE STUDY: OLIGONUCLEOTIDE MANUFACTURERS AND PURIFICATION SERVICES
- 10.1. Chapter Overview
- 10.2. List of Oligonucleotide Manufacturers Focused on Research and Diagnostic Applications
- 10.2.1. Analysis by Year of Establishment
- 10.2.2. Analysis by Company Size
- 10.2.3. Analysis by Scale of Operation
- 10.2.4. Analysis by Location of Headquarters
- 10.2.5. Analysis by Type of Purification Method Used
- 10.3. List of Oligonucleotide Manufacturers Focused on Therapeutic Applications
- 10.3.1. Analysis by Year of Establishment
- 10.3.2. Analysis by Company Size
- 10.3.3. Analysis by Scale of Operation
- 10.3.4. Analysis by Location of Headquarters
- 10.3.5. Analysis by Type of Purification Method Used
11. CONCLUDING REMARKS
12. APPENDIX 1: TABULATED DATA
13. APPENDIX 2: LIST OF COMPANIES AND ORGANIZATIONS
List of Tables
- Table 4.1 Antisense Oligonucleotide Therapeutics: List of Drugs
- Table 4.2 Antisense Oligonucleotide Therapeutics: List of Developers
- Table 5.1 Antisense Oligonucleotide Therapeutics: List of Companies Profiled
- Table 5.2 Antisense Therapeutics: Company Snapshot
- Table 5.3 Drug Profile: ATL1102
- Table 5.4 Drug Profile: ATL1103
- Table 5.5 Antisense Therapeutics: Recent Developments and Future Outlook
- Table 5.6 Biogen: Company Snapshot
- Table 5.7 Drug Profile: Tofersen
- Table 5.8 Drug Profile: ION541
- Table 5.9 Biogen: Recent Developments and Future Outlook
- Table 5.10 Bio-Path Holdings: Company Snapshot
- Table 5.11 Drug Profile: Prexigebersen
- Table 5.12 Drug Profile: BP1002
- Table 5.13 Drug Profile: BP1003
- Table 5.14 Bio-Path Holdings: Recent Developments and Future Outlook
- Table 5.15 Ionis Pharmaceuticals: Company Snapshot
- Table 5.16 Drug Profile: Spinraza(R)
- Table 5.17 Drug Profile: Tegsedi(R)
- Table 5.18 Drug Profile: Waylivra(R)
- Table 5.19 Drug Profile: AKCEA-APOCIII-LRx
- Table 5.20 Drug Profile: IONIS-PKK-LRx
- Table 5.21 Drug Profile: IONIS-PKK-Rx
- Table 5.22 Drug Profile: IONIS-ENAC-2.5Rx
- Table 5.23 Drug Profile: IONIS-FB-LRx
- Table 5.24 Drug Profile: IONIS-AGT-LRx
- Table 5.25 Drug Profile: AKCEA-TTR-LRx
- Table 5.26 Drug Profile: IONIS-GHR-LRx
- Table 5.27 Drug Profile: ION253
- Table 5.28 Drug Profile: IONIS-TMPRSS6-LRx
- Table 5.29 Drug Profile: ION736
- Table 5.30 Drug Profile: IONIS-AR-2.5Rx
- Table 5.31 Drug Profile: ION224
- Table 5.32 Drug Profile: ISIS-FGFR4RX
- Table 5.33 Drug Profile: ISIS-GCCRRx
- Table 5.34 Drug Profile: IONIS-GCGRRx
- Table 5.35 Drug Profile: IONIS-HBV-LRx
- Table 5.36 Drug Profile: ION251
- Table 5.37 Drug Profile: ION 449
- Table 5.38 Drug Profile: BIIB078
- Table 5.39 Drug Profile: BIIB094
- Table 5.40 Drug Profile: BIIB101
- Table 5.41 Drug Profile: ISIS-EIF4ERx
- Table 5.42 Drug Profile: BIIB080
- Table 5.43 Drug Profile: ION663
- Table 5.44 Drug Profile: ION674
- Table 5.45 Drug Profile: ION537
- Table 5.46 Drug Profile: ION929
- Table 5.47 Drug Profile: ION363
- Table 5.48 Drug Profile: ION373
- Table 5.49 Drug Profile: ION283
- Table 5.50 Drug Profile: ION260
- Table 5.51 Drug Profile: ION581
- Table 5.52 Drug Profile: ION716
- Table 5.53 Drug Profile: ION904
- Table 5.54 Drug Profile: ION547
- Table 5.55 Ionis Pharmaceuticals: Recent Developments and Future Outlook
- Table 5.56 ProQR Therapeutics: Company Snapshot
- Table 5.57 Drug Profile: Sepofarsen
- Table 5.58 Drug Profile: QR-421a
- Table 5.59 Drug Profile: QR-1123
- Table 5.60 Drug Profile: QR-411
- Table 5.61 Drug Profile: QR-504a
- Table 5.62 Drug Profile: QRX-704
- Table 5.63 Drug Profile: QR-1011
- Table 5.64 Drug Profile: QRX-461
- Table 5.65 Drug Profile: QRX-136
- Table 5.66 Drug Profile: QRX-1204
- Table 5.67 ProQR Therapeutics: Recent Developments and Future Outlook
- Table 5.68 Sarepta Therapeutics: Company Snapshot
- Table 5.69 Drug Profile: Exondys 51
- Table 5.70 Drug Profile: Vyondys 53
- Table 5.71 Drug Profile: Amondys 45
- Table 5.72 Drug Profile: SRP-5051
- Table 5.73 Drug Profile: Exon 52
- Table 5.74 Drug Profile: Exon 43
- Table 5.75 Drug Profile: Exon 44
- Table 5.76 Drug Profile: Exon 50
- Table 5.77 Drug Profile: Exon 55
- Table 5.78 Drug Profile: SRP-5052
- Table 5.79 Drug Profile: SRP-5053
- Table 5.80 Drug Profile: SRP-5044
- Table 5.81 Drug Profile: SRP-5045
- Table 5.82 Drug Profile: SRP-5050
- Table 5.83 Sarepta Therapeutics: Recent Developments and Future Outlook
- Table 5.84 Sterna Biologicals: Company Snapshot
- Table 5.85 Drug Profile: SB010
- Table 5.86 Drug Profile: SB011
- Table 5.87 Drug Profile: SB012
- Table 5.88 Sterna Biologicals: Recent Developments and Future Outlook
- Table 5.89 Wave Life Sciences: Company Snapshot
- Table 5.90 Drug Profile: WVE-120102
- Table 5.91 Drug Profile: Suvodirsen
- Table 5.92 Drug Profile: WVE-004
- Table 5.93 Drug Profile: WVE-003
- Table 5.94 Drug Profile: WVE-N531
- Table 5.95 Drug Profile: Undisclosed Drug 1
- Table 5.96 Drug Profile: Undisclosed Drug 2
- Table 5.97 Drug Profile: Undisclosed Drug 3
- Table 5.98 Drug Profile: Undisclosed Drug 4
- Table 5.99 Drug Profile: Undisclosed Drug 5
- Table 5.100 Drug Profile: Undisclosed Drug 6
- Table 5.101 Wave Life Sciences: Recent Developments and Future Outlook
- Table 8.1 Antisense Oligonucleotide Therapeutics: List of Partnerships and Collaborations
- Table 9.1 Antisense Oligonucleotide Therapeutics: Summary of the Competitive Insights
- Table 10.1 Oligonucleotide Manufacturers Focused on Research and Diagnostic Applications: List of Industry Players
- Table 10.2 Oligonucleotide Manufacturers Focused on Therapeutic Applications: List of Industry Players
- Table 12.1 Antisense Oligonucleotide Therapeutics: Distribution by Type of Antisense Molecule
- Table 12.2 Antisense Oligonucleotide Therapeutics: Distribution by ASO Generation
- Table 12.3 Antisense Oligonucleotide Therapeutics: Distribution by Phase of Development
- Table 12.4 Antisense Oligonucleotide Therapeutics: Distribution by Target Genes
- Table 12.5 Antisense Oligonucleotide Therapeutics: Distribution by Target Indications
- Table 12.6 Antisense Oligonucleotide Therapeutics: Distribution by Therapeutic Areas
- Table 12.7 Antisense Oligonucleotide Therapeutics: Distribution by Route of Administration
- Table 12.8 Antisense Oligonucleotide Therapeutics: Distribution by Type of Therapy
- Table 12.9 Antisense Oligonucleotide Therapeutic Developers: Distribution by Year of Establishment
- Table 12.10 Antisense Oligonucleotide Therapeutic Developers: Distribution by Company Size
- Table 12.11 Antisense Oligonucleotide Therapeutic Developers: Distribution by Location of Headquarters
- Table 12.12 Biogen: Annual Revenues, Since 2015 (USD Million)
- Table 12.13 Ionis Pharmaceuticals: Annual Revenues, Since 2015 (USD Million)
- Table 12.14 Sarepta Therapeutics: Annual Revenues, Since 2015 (USD Million)
- Table 12.15 Wave Life Sciences: Annual Revenues, Since 2015 (USD Million)
- Table 12.16 Clinical Trial Analysis: Cumulative Distribution of Trials by Registration Year
- Table 12.17 Clinical Trial Analysis: Distribution by Trial Phase
- Table 12.18 Clinical Trial Analysis: Distribution by Trial Recruitment Status
- Table 12.19 Clinical Trial Analysis: Distribution by Trial Registration Year and Number of Patients Enrolled
- Table 12.20 Clinical Trial Analysis: Distribution by Study Design
- Table 12.21 Clinical Trial Analysis: Distribution by Type of Sponsor / Collaborator
- Table 12.22 Leading Players: Distribution by Number of Registered Trials
- Table 12.23 Clinical Trial Analysis: Distribution by Target Therapeutic Area
- Table 12.24 Clinical Trial Analysis: Distribution by Trial Registration Year and Target Gene
- Table 12.25 Popular Indications: Distribution by Number of Registered Trials
- Table 12.26 Popular Interventions: Distribution by Number of Registered Trials
- Table 12.27 Clinical Trial Analysis: Geographical Distribution by Number of Registered Trials
- Table 12.28 Clinical Trial Analysis: Geographical Distribution by Number of Patients Enrolled
- Table 12.29 Grant Analysis: Cumulative Trend by Year of Grant Award, Since 2017
- Table 12.30 Grant Analysis: Cumulative Distribution by Amount Awarded, Since 2017 (USD Million)
- Table 12.31 Grant Analysis: Distribution by Administering Institute Center
- Table 12.32 Grant Analysis: Distribution by Support Period
- Table 12.33 Grant Analysis: Distribution by Administering Institute Center and Support Period
- Table 12.34 Grant Analysis: Distribution by Type of Grant Application
- Table 12.35 Grant Analysis: Distribution by Purpose of Grant Award
- Table 12.36 Grant Analysis: Distribution by Activity Code
- Table 12.37 Grant Analysis: Distribution by Study Section Involved
- Table 12.38 Grant Analysis: Distribution by Type of Recipient Organization
- Table 12.39 Grant Analysis: Geographical Distribution of Recipient Organizations
- Table 12.40 Popular Therapeutic Areas: Distribution by Number of Grants
- Table 12.41 Popular NIH Departments: Distribution by Number of Grants
- Table 12.42 Prominent Program Officers: Distribution by Number of Grants
- Table 12.43 Popular Recipient Organizations: Distribution by Number of Grants
- Table 12.44 Partnerships and Collaborations: Cumulative Year-wise Trend, Since 2016
- Table 12.45 Partnerships and Collaborations: Distribution by Type of Partnership
- Table 12.46 Partnerships and Collaborations: Distribution by Type of Partnership and Generation of Antisense Molecule Involved
- Table 12.47 Partnerships and Collaborations: Distribution by Type of Partnership and Target Therapeutic Area
- Table 12.48 Partnerships and Collaborations: Distribution by Year of Partnership and Type of Partner
- Table 12.49 Partnerships and Collaborations: Distribution by Type of Partnership and Type of Partner
- Table 12.50 Most Active Players: Distribution by Number of Partnerships
- Table 12.51 Partnerships and Collaborations: Regional Distribution
- Table 12.52 Global Antisense Oligonucleotide Therapeutics Market, Till 2035 (USD Million)
- Table 12.53 Alicaforsen: Sales Forecast, Till 2035 (USD Million)
- Table 12.54 Eteplirsen: Sales Forecast, Till 2035 (USD Million)
- Table 12.55 Golodirsen: Sales Forecast, Till 2035 (USD Million)
- Table 12.56 Inotersen: Sales Forecast, Till 2035 (USD Million)
- Table 12.57 Sepofarsen: Sales Forecast, Till 2035 (USD Million)
- Table 12.58 Tofersen: Sales Forecast, Till 2035 (USD Million)
- Table 12.59 Tominersen: Sales Forecast, Till 2035 (USD Million)
- Table 12.60 Viltolarsen: Sales Forecast, Till 2035 (USD Million)
- Table 12.61 Volanesorsen: Sales Forecast, Till 2035 (USD Million)
- Table 12.62 Global Antisense Oligonucleotide Therapeutics Market, Till 2035: Distribution by Type of Antisense Molecule (USD Million)
- Table 12.63 Global Antisense Oligonucleotide Therapeutics Market for RNA Molecules, Till 2035 (USD Million)
- Table 12.64 Global Antisense Oligonucleotide Therapeutics Market for DNA Molecules, Till 2035 (USD Million)
- Table 12.65 Global Antisense Oligonucleotide Therapeutics Market, Till 2035: Distribution by ASO Generation (USD Million)
- Table 12.66 Global Antisense Oligonucleotide Therapeutics Market for First-generation Products, Till 2035 (USD Million)
- Table 12.67 Global Antisense Oligonucleotide Therapeutics Market for Second-generation Products, Till 2035 (USD Million)
- Table 12.68 Global Antisense Oligonucleotide Therapeutics Market for Third-generation Products, Till 2035 (USD Million)
- Table 12.69 Global Antisense Oligonucleotide Therapeutics Market, Till 2035: Distribution by Target Disease Indication (USD Million)
- Table 12.70 Global Antisense Oligonucleotide Therapeutics Market for Amyotrophic Lateral Sclerosis, Till 2035 (USD Million)
- Table 12.71 Global Antisense Oligonucleotide Therapeutics Market for Duchenne Muscular Dystrophy, Till 2035 (USD Million)
- Table 12.72 Global Antisense Oligonucleotide Therapeutics Market for Familial Chylomicronemia Syndrome, Till 2035 (USD Million)
- Table 12.73 Global Antisense Oligonucleotide Therapeutics Market for Familial Partial Lipodystrophy, Till 2035 (USD Million)
- Table 12.74 Global Antisense Oligonucleotide Therapeutics Market for Hereditary Transthyretin-Mediated (hATTR) Amyloidosis, Till 2035 (USD Million)
- Table 12.75 Global Antisense Oligonucleotide Therapeutics Market for Huntington's Disease, Till 2035 (USD Million)
- Table 12.76 Global Antisense Oligonucleotide Therapeutics Market for Leber's Congenital Amaurosis, Till 2035 (USD Million)
- Table 12.77 Global Antisense Oligonucleotide Therapeutics Market for Pouchitis, Till 2035 (USD Million)
- Table 12.78 Global Antisense Oligonucleotide Therapeutics Market for Spinal Muscular Atrophy, Till 2035 (USD Million)
- Table 12.79 Global Antisense Oligonucleotide Therapeutics Market, Till 2035: Distribution by Route of Administration (USD Million)
- Table 12.80 Global Antisense Oligonucleotide Therapeutics Market for Intrathecal Therapies, Till 2035 (USD Million)
- Table 12.81 Global Antisense Oligonucleotide Therapeutics Market for Intravenous Therapies, Till 2035 (USD Million)
- Table 12.82 Global Antisense Oligonucleotide Therapeutics Market for Intravitreal Therapies, Till 2035 (USD Million)
- Table 12.83 Global Antisense Oligonucleotide Therapeutics Market for Subcutaneous Therapies, Till 2035 (USD Million)
- Table 12.84 Global Antisense Oligonucleotide Therapeutics Market for Intraorifice Therapies, Till 2035 (USD Million)
- Table 12.85 Global Antisense Oligonucleotide Therapeutics Market, Till 2035: Distribution by Type of Therapy (USD Million)
- Table 12.86 Global Antisense Oligonucleotide Therapeutics Market for Combination Therapies Till 2035 (USD Million)
- Table 12.87 Global Antisense Oligonucleotide Therapeutics Market for Monotherapies, Till 2035 (USD Million)
- Table 12.88 Global Antisense Oligonucleotide Market, Till 2035: Distribution by Geography (USD Million)
- Table 12.89 Antisense Oligonucleotide Market in the US, Till 2035 (USD Million)
- Table 12.90 Antisense Oligonucleotide Market in Canada, Till 2035 (USD Million)
- Table 12.91 Antisense Oligonucleotide Market in the UK, Till 2035 (USD Million)
- Table 12.92 Antisense Oligonucleotide Market in Germany, Till 2035 (USD Million)
- Table 12.93 Antisense Oligonucleotide Market in France, Till 2035 (USD Million)
- Table 12.94 Antisense Oligonucleotide Market in Italy, Till 2035 (USD Million)
- Table 12.95 Antisense Oligonucleotide Market in Spain, Till 2035 (USD Million)
- Table 12.96 Antisense Oligonucleotide Market in Australia, Till 2035 (USD Million)
- Table 12.97 Antisense Oligonucleotide Market in Japan, Till 2035 (USD Million)
- Table 12.98 Antisense Oligonucleotide Market in Korea, Till 2035 (USD Million)
- Table 12.99 Antisense Oligonucleotide Market in Brazil, Till 2035 (USD Million)
- Table 12.100 Antisense Oligonucleotide Market in Israel, Till 2035 (USD Million)
- Table 12.101 Oligonucleotide Manufacturers Focused on Research and Diagnostic Applications: Distribution by Year of Establishment
- Table 12.102 Oligonucleotide Manufacturers Focused on Research and Diagnostic Applications: Distribution by Company Size
- Table 12.103 Oligonucleotide Manufacturers Focused on Research and Diagnostic Applications: Distribution by Scale of Operation
- Table 12.104 Oligonucleotide Manufacturers Focused on Research and Diagnostic Applications: Distribution by Location of Headquarters
- Table 12.105 Oligonucleotide Manufacturers Focused on Research and Diagnostic Applications: Distribution by Type of Purification Method Used
- Table 12.106 Oligonucleotide Manufacturers Focused on Therapeutic Applications: Distribution by Year of Establishment
- Table 12.107 Oligonucleotide Manufacturers Focused on Therapeutic Applications: Distribution by Company Size
- Table 12.108 Oligonucleotide Manufacturers Focused on Therapeutic Applications: Distribution by Scale of Operation
- Table 12.109 Oligonucleotide Manufacturers Focused on Therapeutic Applications: Distribution by Location of Headquarters
- Table 12.110 Oligonucleotide Manufacturers Focused on Therapeutic Applications: Distribution by Type of Purification Method Used
List of Figures
- Figure 3.1 Classification of Oligonucleotides
- Figure 3.2 Key Components of RNA interference
- Figure 3.3 Mechanism of RNA interference
- Figure 3.4 Key Features of Antisense Oligonucleotides
- Figure 3.5 Mechanism of Antisense Oligonucleotides
- Figure 4.1 Antisense Oligonucleotide Therapeutics: Distribution by Type of Antisense Molecule
- Figure 4.2 Antisense Oligonucleotide Therapeutics: Distribution by ASO Generation
- Figure 4.3 Antisense Oligonucleotide Therapeutics: Distribution by Phase of Development
- Figure 4.4 Antisense Oligonucleotide Therapeutics: Distribution by Target Genes
- Figure 4.5 Antisense Oligonucleotide Therapeutics: Distribution by Target Indications
- Figure 4.6 Antisense Oligonucleotide Therapeutics: Distribution by Therapeutic Areas
- Figure 4.7 Antisense Oligonucleotide Therapeutics: Distribution by Route of Administration
- Figure 4.8 Antisense Oligonucleotide Therapeutics: Distribution by Type of Therapy
- Figure 4.9 Antisense Oligonucleotide Therapeutic Developers: Distribution by Year of Establishment
- Figure 4.10 Antisense Oligonucleotide Therapeutic Developers: Distribution by Company Size
- Figure 4.11 Antisense Oligonucleotide Therapeutic Developers: Distribution by Location of Headquarters
- Figure 4.12 Grid Analysis: Distribution by Phase of Development of Therapeutics, Company Size and Location of Headquarters
- Figure 5.1 Biogen: Annual Revenues, Since 2015 (USD Million)
- Figure 5.2 Ionis Pharmaceuticals: Annual Revenues, Since 2015 (USD Million)
- Figure 5.3 Sarepta Therapeutics: Annual Revenues, Since 2015 (USD Million)
- Figure 5.4 Wave Life Sciences: Annual Revenues, Since 2015 (USD Million)
- Figure 6.1 Clinical Trial Analysis: Cumulative Distribution of Trials by Registration Year
- Figure 6.2 Clinical Trial Analysis: Distribution by Trial Phase
- Figure 6.3 Clinical Trial Analysis: Distribution by Trial Recruitment Status
- Figure 6.4 Clinical Trial Analysis: Distribution by Trial Registration Year and Number of Patients Enrolled
- Figure 6.5 Clinical Trial Analysis: Distribution by Study Design
- Figure 6.6 Clinical Trial Analysis: Distribution by Type of Sponsor / Collaborator
- Figure 6.7 Leading Players: Distribution by Number of Registered Trials
- Figure 6.8 Word Cloud: Key Focus Areas
- Figure 6.9 Clinical Trial Analysis: Distribution by Target Therapeutic Area
- Figure 6.10 Clinical Trial Analysis: Distribution by Trial Registration Year and Target Gene
- Figure 6.11 Popular Indications: Distribution by Number of Registered Trials
- Figure 6.12 Popular Interventions: Distribution by Number of Registered Trials
- Figure 6.13 Clinical Trial Analysis: Geographical Distribution by Number of Registered Trials
- Figure 6.14 Clinical Trial Analysis: Geographical Distribution by Number of Patients Enrolled
- Figure 7.1 Grant Analysis: Cumulative Trend by Year of Grant Award, Since 2017
- Figure 7.2 Grant Analysis: Cumulative Distribution by Amount Awarded (USD Million), Since 2017
- Figure 7.3 Grant Analysis: Distribution by Administering Institute Center
- Figure 7.4 Grant Analysis: Distribution by Support Period
- Figure 7.5 Grant Analysis: Distribution by Administering Institute Center and Support Period
- Figure 7.6 Grant Analysis: Distribution by Type of Grant Application
- Figure 7.7 Grant Analysis: Distribution by Purpose of Grant Award
- Figure 7.8 Grant Analysis: Distribution by Activity Code
- Figure 7.9 Grant Analysis: Distribution by Study Section Involved
- Figure 7.10 Grant Analysis: Distribution by Type of Recipient Organization
- Figure 7.11 Word Cloud Analysis: Emerging Focus Areas
- Figure 7.12 Grant Analysis: Geographical Distribution of Recipient Organizations
- Figure 7.13 Popular Therapeutic Areas: Distribution by Number of Grants
- Figure 7.14 Popular NIH Departments: Distribution by Number of Grants
- Figure 7.15 Prominent Program Officers: Distribution by Number of Grants
- Figure 7.16 Popular Recipient Organizations: Distribution by Number of Grants
- Figure 8.1 Partnerships and Collaborations: Cumulative Year-wise Trend, Since 2016
- Figure 8.2 Partnerships and Collaborations: Distribution by Type of Partnership
- Figure 8.3 Partnerships and Collaborations: Distribution by Type of Partnership and Generation of Antisense Molecule Involved
- Figure 8.4 Partnerships and Collaborations: Distribution by Type of Partnership and Target Therapeutic Area
- Figure 8.5 Partnerships and Collaborations: Distribution by Year of Partnership and Type of Partner
- Figure 8.6 Partnerships and Collaborations: Distribution by Type of Partnership and Type of Partner
- Figure 8.7 Most Active Players: Distribution by Number of Partnerships
- Figure 8.8 Partnerships and Collaborations: Regional Distribution
- Figure 8.9 Partnerships and Collaborations: Intercontinental and Intracontinental Agreements
- Figure 9.1 Global Antisense Oligonucleotide Therapeutics Market, Till 2035 (USD Million)
- Figure 9.2 Alicaforsen: Sales Forecast, Till 2035 (USD Million)
- Figure 9.3 Eteplirsen: Sales Forecast, Till 2035 (USD Million)
- Figure 9.4 Golodirsen: Sales Forecast, Till 2035 (USD Million)
- Figure 9.5 Inotersen: Sales Forecast, Till 2035 (USD Million)
- Figure 9.6 Sepofarsen: Sales Forecast, Till 2035 (USD Million)
- Figure 9.7 Tofersen: Sales Forecast, Till 2035 (USD Million)
- Figure 9.8 Tominersen: Sales Forecast, Till 2035 (USD Million)
- Figure 9.9 Viltolarsen: Sales Forecast, Till 2035 (USD Million)
- Figure 9.10 Volanesorsen: Sales Forecast, Till 2035 (USD Million)
- Figure 9.11 Global Antisense Oligonucleotide Therapeutics Market, Till 2035: Distribution by Type of Antisense Molecule (USD Million)
- Figure 9.12 Global Antisense Oligonucleotide Therapeutics Market for RNA Molecules, Till 2035 (USD Million)
- Figure 9.13 Global Antisense Oligonucleotide Therapeutics Market for DNA Molecules, Till 2035 (USD Million)
- Figure 9.14 Global Antisense Oligonucleotide Therapeutics Market, Till 2035: Distribution by ASO Generation (USD Million)
- Figure 9.15 Global Antisense Oligonucleotide Therapeutics Market for First-generation Products, Till 2035 (USD Million)
- Figure 9.16 Global Antisense Oligonucleotide Therapeutics Market for Second-generation Products, Till 2035 (USD Million)
- Figure 9.17 Global Antisense Oligonucleotide Therapeutics Market for Third-generation Products, Till 2035 (USD Million)
- Figure 9.18 Global Antisense Oligonucleotide Therapeutics Market, Till 2035: Distribution by Target Disease Indication (USD Million)
- Figure 9.19 Global Antisense Oligonucleotide Therapeutics Market for Amyotrophic Lateral Sclerosis, Till 2035 (USD Million)
- Figure 9.20 Global Antisense Oligonucleotide Therapeutics Market for Duchenne Muscular Dystrophy, Till 2035 (USD Million)
- Figure 9.21 Global Antisense Oligonucleotide Therapeutics Market for Familial Chylomicronemia Syndrome, Till 2035 (USD Million)
- Figure 9.22 Global Antisense Oligonucleotide Therapeutics Market for Familial Partial Lipodystrophy, Till 2035 (USD Million)
- Figure 9.23 Global Antisense Oligonucleotide Therapeutics Market for Hereditary Transthyretin-Mediated (hATTR) Amyloidosis, Till 2035 (USD Million)
- Figure 9.24 Global Antisense Oligonucleotide Therapeutics Market for Huntington's Disease, Till 2035 (USD Million)
- Figure 9.25 Global Antisense Oligonucleotide Therapeutics Market for Leber's Congenital Amaurosis, Till 2035 (USD Million)
- Figure 9.26 Global Antisense Oligonucleotide Therapeutics Market for Pouchitis, Till 2035 (USD Million)
- Figure 9.27 Global Antisense Oligonucleotide Therapeutics Market for Spinal Muscular Atrophy, Till 2035 (USD Million)
- Figure 9.28 Global Antisense Oligonucleotide Therapeutics Market, Till 2035: Distribution by Route of Administration (USD Million)
- Figure 9.29 Global Antisense Oligonucleotide Therapeutics Market for Intrathecal Therapies, Till 2035 (USD Million)
- Figure 9.30 Global Antisense Oligonucleotide Therapeutics Market for Intravenous Therapies, Till 2035 (USD Million)
- Figure 9.31 Global Antisense Oligonucleotide Therapeutics Market for Intravitreal Therapies, Till 2035 (USD Million)
- Figure 9.32 Global Antisense Oligonucleotide Therapeutics Market for Subcutaneous Therapies, Till 2035 (USD Million)
- Figure 9.33 Global Antisense Oligonucleotide Therapeutics Market for Intraorifice Therapies, Till 2035 (USD Million)
- Figure 9.34 Global Antisense Oligonucleotide Therapeutics Market, Till 2035: Distribution by Type of Therapy (USD Million)
- Figure 9.35 Global Antisense Oligonucleotide Therapeutics Market for Combination Therapies Till 2035 (USD Million)
- Figure 9.36 Global Antisense Oligonucleotide Therapeutics Market for Monotherapies, Till 2035 (USD Million)
- Figure 9.37 Global Antisense Oligonucleotide Market, Till 2035: Distribution by Geography (USD Million)
- Figure 9.38 Antisense Oligonucleotide Market in the US, Till 2035 (USD Million)
- Figure 9.39 Antisense Oligonucleotide Market in Canada, Till 2035 (USD Million)
- Figure 9.40 Antisense Oligonucleotide Market in the UK, Till 2035 (USD Million)
- Figure 9.41 Antisense Oligonucleotide Market in Germany, Till 2035 (USD Million)
- Figure 9.42 Antisense Oligonucleotide Market in France, Till 2035 (USD Million)
- Figure 9.43 Antisense Oligonucleotide Market in Italy, Till 2035 (USD Million)
- Figure 9.44 Antisense Oligonucleotide Market in Spain, Till 2035 (USD Million)
- Figure 9.45 Antisense Oligonucleotide Market in Australia, Till 2035 (USD Million)
- Figure 9.46 Antisense Oligonucleotide Market in Japan, Till 2035 (USD Million)
- Figure 9.47 Antisense Oligonucleotide Market in Korea, Till 2035 (USD Million)
- Figure 9.48 Antisense Oligonucleotide Market in Brazil, Till 2035 (USD Million)
- Figure 9.49 Antisense Oligonucleotide Market in Israel, Till 2035 (USD Million)
- Figure 10.1 Oligonucleotide Manufacturers Focused on Research and Diagnostic Applications: Distribution by Year of Establishment
- Figure 10.2 Oligonucleotide Manufacturers Focused on Research and Diagnostic Applications: Distribution by Company Size
- Figure 10.3 Oligonucleotide Manufacturers Focused on Research and Diagnostic Applications: Distribution by Scale of Operation
- Figure 10.4 Oligonucleotide Manufacturers Focused on Research and Diagnostic Applications: Distribution by Location of Headquarters
- Figure 10.5 Oligonucleotide Manufacturers Focused on Research and Diagnostic Applications: Distribution by Type of Purification Method Used
- Figure 10.6 Oligonucleotide Manufacturers Focused on Therapeutic Applications: Distribution by Year of Establishment
- Figure 10.7 Oligonucleotide Manufacturers Focused on Therapeutic Applications: Distribution by Company Size
- Figure 10.8 Oligonucleotide Manufacturers Focused on Therapeutic Applications: Distribution by Scale of Operation
- Figure 10.9 Oligonucleotide Manufacturers Focused on Therapeutic Applications: Distribution by Location of Headquarters
- Figure 10.10 Oligonucleotide Manufacturers Focused on Therapeutic Applications: Distribution by Type of Purification Method Used

