
PUBLISHER: Roots Analysis | PRODUCT CODE: 1762524

PUBLISHER: Roots Analysis | PRODUCT CODE: 1762524
Lab Automation Market: Industry Trends and Global Forecasts - Distribution by Stage of Automation, Type of Instrument, Application, End-user and Key Geographical Regions
LAB AUTOMATION MARKET: OVERVIEW
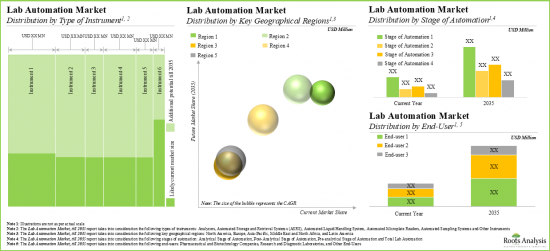
As per Roots Analysis, the global lab automation market is estimated to grow from USD 6.5 billion in the current year to USD 16 billion by 2035, at a CAGR of 9.4% during the forecast period, till 2035.
The market sizing and opportunity analysis has been segmented across the following parameters:
Stage of Automation
- Pre-Analytical Stage
- Analytical Stage
- Post-Analytical Stage
- Total Lab Automation
Type of Instrument
- Automated Liquid Handling Systems
- Automated Microplate Readers
- Automated Sampling Systems
- Analyzers
- Automated Storage and Retrieval Systems (ASRS)
- Other Instruments
Application
- Diagnostics
- Genomic Solutions
- Microbiology
- Drug Discovery
- Proteomic Solutions
- Other Applications
End-user
- Pharmaceutical and Biotechnology Companies
- Research and Diagnostic Laboratories
- Other End-users
Key Geographical Regions
- North America
- Europe
- Asia-Pacific
- Middle East and North Africa
- Latin America
LAB AUTOMATION MARKET: GROWTH AND TRENDS
Laboratory automation has been one of the most significant developments in diagnostic laboratory sciences in recent years. The purpose of laboratory automation, which began in the 1950s, is to reduce human error and turnaround time for laboratory testing. It is worth highlighting that human error accounts for approximately 30% to 86% of all pre-analytical mistakes among all laboratory processes. As a result, the implementation of robots in place of humans can effectively and immediately eliminate this significant amount of inaccuracy. Over the years, lab automation has garnered significant interest from researchers as well as from industry players, owing to the potential of machines to replace manual operations in every field of research and technology. This is because automation enhances process quality, eliminates human error and variability, and eventually makes operations more cost-effective, efficient, and quick.
Further, given the rate at which the concept of lab automation has evolved over the last decade, new technologies in this domain have demonstrated enormous potential. In fact, many lab managers are exploring the field of mobile robots as a means to streamline repetitive tasks and enhance efficiency. A robotic lab assistant that can independently transport and handle materials in the lab has been conceptualized by many scientists. Lab automation devices, such as automated liquid handling systems, have several advantages, including the ability to simplify sample preparation while maintaining consistent high accuracy and allowing labs to free up manual labor and run more samples along with maintaining reproducibility. In addition, automated storage and retrieval systems (ASRS) lower down the variable cost of operations by eliminating the need for manual labor for tasks such as picking, storing, assembly and inventory replenishment. Consequently, owing to the growing research efforts, development of advanced instrumentations, and efforts of various stakeholders, this segment of industry is likely to witness noteworthy growth in the foreseen future.
LAB AUTOMATION MARKET: KEY INSIGHTS
The report delves into the current state of the lab automation market and identifies potential growth opportunities within industry. Some key findings from the report include:
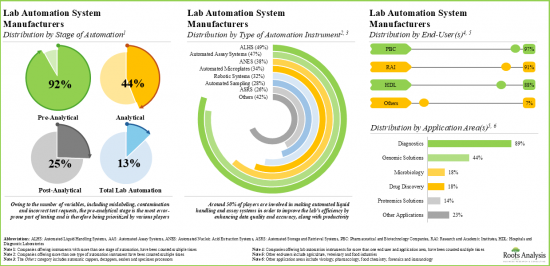
- More than 90% of the lab automation system manufacturers are focusing on pre-analytical stage-based instruments; of these, ALHS and AAS have been more widely adopted by pharma and biotech companies.
- In pursuit of gaining a competitive edge, companies are actively enhancing their existing capabilities to strengthen their respective product portfolios and drive compliance to evolving industry benchmarks.
- The partnership activity has increased at a CAGR of around 25%; in fact, the maximum deals related to lab automation have been inked in the last three years.
- More than 6,200 patents related to lab automation have been filed / granted recently, highlighting the growing interest of stakeholders in scalable and configurable lab automation systems.
- Majority of the lab automation software providers are headquartered in North America; more than 55% of the market is captured by small players.
- The increasing adoption of lab automation in the healthcare industry is anticipated to create profitable business opportunities for lab automation software providers.
- The market is estimated to grow at an annualized rate of 9.4%; the opportunity is likely to be well distributed across various types of instruments, geographical regions, stages of automation and end-users.
LAB AUTOMATION MARKET: KEY SEGMENTS
Pre-analytical Stage Segment holds the Largest Share of the Lab Automation Market
Based on the stage of automation, the market is segmented into pre-analytical stage, analytical stage, post-analytical stage and total lab automation. At present, the pre-analytical stage segment holds the maximum share of the global lab automation market. However, the total lab automation segment is expected to show the highest market growth potential during the forecast period.
By Type of Instrument, Analyzers is the Fastest Growing Segment of the Global Lab Automation Market
Based on the type of instrument, the market is segmented into automated liquid handling systems, automated microplate readers, automated sampling systems, analyzers, automated storage and retrieval systems (ASRS), and other instruments. At present, the automated liquid handling systems segment holds the maximum share of the global lab automation market. Further, the market for analyzers segment is expected to grow at a higher CAGR during the forecast period.
By Application, Diagnostics Segment Accounts for the Largest Share of the Global Lab Automation Market
Based on the application, the market is segmented into diagnostics, genomic solutions, microbiology, drug discovery, proteomic solutions and other applications. Currently, the diagnostics segment captures the highest proportion of the global lab automation market. Further, the drug discovery segment is expected to grow at a higher CAGR during the forecast period.
By End-user, Other End-users is the Fastest Growing Segment of the Global Lab Automation Market
Based on the end-user, the market is segmented into biotechnology and pharmaceutical industries, research and academic institutes and other end users. At present, the biotechnology and pharmaceutical industries segment holds the maximum share of the global lab automation market. However, the market for the other end-user segment is expected to grow at a higher CAGR during the forecast period.
North America Accounts for the Largest Share of the Market
Based on key geographical regions, the market is segmented into North America, Europe, Asia-Pacific, Middle East and North Africa, and Latin America. Currently, North America dominates the global lab automation market and accounts for the largest revenue share. Further, the market Asia-Pacific is likely to grow at a higher CAGR in the coming future.
Example Players in the Lab Automation Market
- Abbott
- Anton Paar
- BD
- Beckman Coulter
- ERWEKA
- Leuze
- Ortho Clinical Diagnostics
- Pall Corporation
- PerkinElmer
- Roche Diagnostics
- Siemens Healthineers
- SYSTAG
LYOPHILIZATION SERVICES MARKET: RESEARCH COVERAGE
- Market Sizing and Opportunity Analysis: The report features an in-depth analysis of the global lyophilization services market, focusing on key market segments, including [A] stage of automation, [B] type of instrument, [C] application, [D] end-user and [E] key geographical regions.
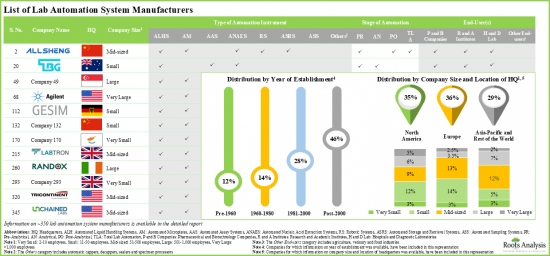
- Market Landscape: A comprehensive evaluation of around 350 lab automation system manufacturers, based on several relevant parameters, such as [A] year of establishment, [B] company size, [C] location of headquarters, [D] types of lab automation system(s), [E] stage(s) of automation, [F] application area(s) and [G] end-user(s).
- Company Competitiveness Analysis: A comprehensive competitive analysis of lab automation system manufacturers, examining factors, such as [A] company strength, [B] product diversity and [BC] portfolio strength.
- Company Profiles: In-depth profiles of key players that are currently engaged in the development of lab automation systems across North America, Europe and Asia-Pacific and Rest of the World, focusing on [A] overview of the company, [B] financial information (if available), [C] product portfolio and [D] recent developments and an informed future outlook.
- Partnerships and Collaborations: An insightful analysis of the deals inked by stakeholders in this domain, based on several parameters, such as [A] year of partnership, [B] type of partnership, [C] type of partner, [D] type of automation instrument(s), [E] most active players (in terms of number of partnerships) and [F] regional distribution of partnership activity.
- Patent Analysis: An in-depth analysis of patents filed / granted till date related to lab automation, based on various relevant parameters, such as [A] patent publication year, [B] type of patent, [C] patent jurisdiction, [D] CPC symbols, [E] type of applicant, [F] emerging focus areas and [G] leading players (in terms of number of patents filled / granted), [H] leading individual assignees, [I] benchmarking analysis and [J] patent valuation.
- Case Study: A detailed discussion on the lab automation software providers, based on various parameters, such as [A] year of establishment, [B] company size, [C] location of headquarters, [D] type of software, [E] mode(s) of deployment and [F] end-user(s).
KEY QUESTIONS ANSWERED IN THIS REPORT
- How many companies are currently engaged in this market?
- Which are the leading companies in this market?
- What factors are likely to influence the evolution of this market?
- What is the current and future market size?
- What is the CAGR of this market?
- How is the current and future market opportunity likely to be distributed across key market segments?
REASONS TO BUY THIS REPORT
- The report provides a comprehensive market analysis, offering detailed revenue projections of the overall market and its specific sub-segments. This information is valuable to both established market leaders and emerging entrants.
- Stakeholders can leverage the report to gain a deeper understanding of the competitive dynamics within the market. By analyzing the competitive landscape, businesses can make informed decisions to optimize their market positioning and develop effective go-to-market strategies.
- The report offers stakeholders a comprehensive overview of the market, including key drivers, barriers, opportunities, and challenges. This information empowers stakeholders to stay abreast of market trends and make data-driven decisions to capitalize on growth prospects.
ADDITIONAL BENEFITS
- Complimentary Excel Data Packs for all Analytical Modules in the Report
- 15% Free Content Customization
- Detailed Report Walkthrough Session with Research Team
- Free Updated report if the report is 6-12 months old or older
TABLE OF CONTENTS
1. PREFACE
- 1.1. Scope of the Report
- 1.2. Research Methodology
- 1.2.1. Research Assumptions
- 1.2.2. Project Methodology
- 1.2.3. Forecast Methodology
- 1.2.4. Robust Quality Control
- 1.2.5. Key Considerations
- 1.2.5.1. Demographics
- 1.2.5.2. Economic Factors
- 1.2.5.3. Government Regulations
- 1.2.5.4. Supply Chain
- 1.2.5.5. COVID Impact / Related Factors
- 1.2.5.6. Market Access
- 1.2.5.7. Healthcare Policies
- 1.2.5.8. Industry Consolidation
- 1.3 Key Questions Answered
- 1.4. Chapter Outlines
2. EXECUTIVE SUMMARY
3. INTRODUCTION
- 3.1. Overview of Lab Automation
- 3.2. Historical Evolution of Lab Automation
- 3.3. Stages of Lab Automation
- 3.4. Process of Lab Automation
- 3.5. Advantages of Lab Automation Over Manual Handling
- 3.6. Challenges associated with Lab Automation
- 3.7. Future Perspectives
4. MARKET LANDSCAPE
- 4.1. Lab Automation System Manufacturers: Overall Market Landscape
- 4.1.1. Analysis by Year of Establishment
- 4.1.2. Analysis by Company Size
- 4.1.3. Analysis by Location of Headquarters
- 4.1.4. Analysis by Company Size and Location of Headquarters
- 4.1.5. Analysis by Type of Lab Automation System(s)
- 4.1.6. Analysis by Type of Automated Liquid Handler(s)
- 4.1.7. Analysis by Type of Automated Microplate(s)
- 4.1.8. Analysis by Stage(s) of Automation
- 4.1.9. Analysis by Application Area(s)
- 4.1.10. Analysis by Type of Lab Automation System(s) and Application Area(s)
- 4.1.11. Analysis by End-user(s)
- 4.1.12. Analysis by Stage(s) of Automation and End-user(s)
5. COMPANY COMPETITIVENESS ANALYSIS
- 5.1. Assumptions and Key Parameters
- 5.2. Methodology
- 5.3. Competitiveness Analysis: Very Small Companies based in North America (Peer Group I)
- 5.4. Competitiveness Analysis: Small Companies based in North America (Peer Group II)
- 5.5 Competitiveness Analysis: Mid-sized Players based in North America (Peer Group III)
- 5.6. Competitiveness Analysis: Large Companies based in North America (Peer Group IV)
- 5.7. Competitiveness Analysis: Very Large Companies based in North America (Peer Group V)
- 5.8 Competitiveness Analysis: Very Small Companies based in Europe (Peer Group VI)
- 5.9. Competitiveness Analysis: Small Companies based in Europe (Peer Group VII)
- 5.10. Competitiveness Analysis: Mid-sized Companies based in Europe (Peer Group VII)
- 5.11. Competitiveness Analysis: Large Companies based in Europe (Peer Group IX)
- 5.12. Competitiveness Analysis: Very Large Companies based in Europe (Peer Group X)
- 5.13. Competitiveness Analysis: Very Small Companies based in Asia-Pacific and Rest of the World (Peer Group XI)
- 5.14. Competitiveness Analysis: Small Companies based in Asia-Pacific and Rest of the World (Peer Group XII)
- 5.15. Competitiveness Analysis: Mid-sized Companies based in Asia-Pacific and Rest of the World (Peer Group XIII)
- 5.16. Competitiveness Analysis: Large Companies based in Asia-Pacific and Rest of the World (Peer Group XIV)
- 5.17. Competitiveness Analysis: Very Large Companies based in Asia-Pacific and Rest of the World (Peer Group XV)
6. COMPANY PROFILES
- 6.1. Abbott
- 6.1.1. Company Overview
- 6.1.2. Financial Information
- 6.1.3. Lab Automation Product Portfolio
- 6.1.4. Recent Developments and Future Outlook
- 6.2. Anton Paar
- 6.2.1. Company Overview
- 6.2.2. Financial Information
- 6.2.3. Lab Automation Product Portfolio
- 6.2.4. Recent Developments and Future Outlook
- 6.3. BD
- 6.3.1. Company Overview
- 6.3.2. Financial Information
- 6.3.3. Lab Automation Product Portfolio
- 6.3.4. Recent Developments and Future Outlook
- 6.4. Beckman Coulter
- 6.4.1. Company Overview
- 6.4.2. Financial Information
- 6.4.3. Lab Automation Product Portfolio
- 6.4.4. Recent Developments and Future Outlook
- 6.5. ERWEKA
- 6.5.1. Company Overview
- 6.5.2. Financial Information
- 6.5.3. Lab Automation Product Portfolio
- 6.5.4. Recent Developments and Future Outlook
- 6.6. Leuze
- 6.6.1. Company Overview
- 6.6.2. Financial Information
- 6.6.3. Lab Automation Product Portfolio
- 6.6.4. Recent Developments and Future Outlook
- 6.7. Ortho Clinical Diagnostics
- 6.7.1. Company Overview
- 6.7.2. Financial Information
- 6.7.3. Lab Automation Product Portfolio
- 6.7.4. Recent Developments and Future Outlook
- 6.8. Pall Corporation
- 6.8.1. Company Overview
- 6.8.2. Financial Information
- 6.8.3. Lab Automation Product Portfolio
- 6.8.4. Recent Developments and Future Outlook
- 6.9. PerkinElmer
- 6.9.1. Company Overview
- 6.9.2. Financial Information
- 6.9.3. Lab Automation Product Portfolio
- 6.9.4. Recent Developments and Future Outlook
- 6.10. Roche Diagnostics
- 6.10.1. Company Overview
- 6.10.2. Financial Information
- 6.10.3. Lab Automation Product Portfolio
- 6.10.4. Recent Developments and Future Outlook
- 6.11. Siemens Healthineers
- 6.11.1. Company Overview
- 6.11.2. Financial Information
- 6.11.3. Lab Automation Product Portfolio
- 6.11.4. Recent Developments and Future Outlook
- 6.12. SYSTAG
- 6.12.1. Company Overview
- 6.12.2. Financial Information
- 6.12.3. Lab Automation Product Portfolio
- 6.12.4. Recent Developments and Future Outlook
7. CASE STUDY: LAB AUTOMATION SOFTWARE
- 7.1. Lab Automation Software Providers: Overall Market Landscape
- 7.1.1. Analysis by Year of Establishment
- 7.1.2. Analysis by Company Size
- 7.1.3. Analysis by Location of Headquarters
- 7.1.4. Analysis by Company Size and Location of Headquarters
- 7.1.5. Analysis by Type of Software
- 7.1.6. Analysis by Mode(s) of Deployment
- 7.1.7. Analysis by Type of Software and Mode(s) of Deployment
- 7.1.8. Analysis by End-user(s)
- 7.1.9. Analysis by Type of Software and End-user(s)
8. PARTNERSHIPS AND COLLABORATIONS
- 8.1. Partnership Models
- 8.2. Lab Automation: List of Partnerships and Collaborations
- 8.2.1. Analysis by Year of Partnership
- 8.2.2. Analysis by Type of Partnership
- 8.2.3. Analysis by Year and Type of Partnership
- 8.2.4. Analysis by Type of Partner
- 8.2.5. Analysis by Year of Partnership and Type of Partner
- 8.2.6. Analysis by Type of Partnership and Type of Partner
- 8.2.7. Analysis by Type of Automation Instrument(s)
- 8.2.8. Analysis by Type of Partnership and Automation Instrument(s)
- 8.2.9. Most Active Players: Analysis by Number of Partnerships
- 8.2.10. Analysis by Geography
- 8.2.10.1. Local and International Agreements
- 8.2.10.2. Intracontinental and Intercontinental Agreements
9. PATENT ANALYSIS
- 9.1. Methodology and Key Parameters
- 9.2. Lab Automation: List of Patents
- 9.3. Analysis by Patent Publication Year
- 9.4. Analysis by Publication Year and Type of Patent
- 9.5. Analysis by Application Year
- 9.6. Analysis by Patent Jurisdiction
- 9.7. Analysis by CPC Symbols
- 9.8. Analysis by Type of Applicant
- 9.9. Word Cloud: Emerging Focus Areas
- 9.10. Analysis by Patent Age
- 9.11. Leading Industry Players: Analysis by Number of Patents
- 9.12. Leading Non-Industry Players: Analysis by Number of Patents
- 9.13. Leading Individual Assignees: Analysis by Number of Patents
- 9.14. Patent Benchmarking: Analysis of Leading Industry Players by Patent Characterization (CPC Symbols)
- 9.15. Patent Valuation: Methodology and Key Parameters
- 9.15.1. Analysis by Relative Patent Valuation
10. MARKET FORECAST AND OPPORTUNITY ANALYSIS
- 10.1. Methodology and Key Assumptions
- 10.2. Global Lab Automation Market, Till 2035
- 10.2.1. Lab Automation Market: Distribution by Stage of Automation
- 10.2.1.1. Lab Automation Market for Pre-analytical Stage, Till 2035
- 10.2.1.2. Lab Automation Market for Analytical Stage, Till 2035
- 10.2.1.3. Lab Automation Market for Post-analytical Stage, Till 2035
- 10.2.1.4. Lab Automation Market for Total Lab Automation, Till 2035
- 10.2.2. Lab Automation Market: Distribution by Type of Instrument
- 10.2.2.1. Lab Automation Market for Automated Liquid Handling Systems, Till 2035
- 10.2.2.2. Lab Automation Market for Automated Microplate Readers, Till 2035
- 10.2.2.3. Lab Automation Market for Automated Sampling Systems, Till 2035
- 10.2.2.4. Lab Automation Market for Analyzers, Till 2035
- 10.2.2.5. Lab Automation Market for Automated Storage and Retrieval Systems (ASRS), Till 2035
- 10.2.2.6. Lab Automation Market for Other Instruments, Till 2035
- 10.2.3. Lab Automation Market: Distribution by Application
- 10.2.3.1. Lab Automation Market for Diagnostics, Till 2035
- 10.2.3.2. Lab Automation Market for Genomic Solutions, Till 2035
- 10.2.3.3. Lab Automation Market for Microbiology, Till 2035
- 10.2.3.4. Lab Automation Market for Drug Discovery, Till 2035
- 10.2.3.5. Lab Automation Market for Proteomic Solutions, Till 2035
- 10.2.3.6. Lab Automation Market for Other Applications, Till 2035
- 10.2.4. Lab Automation Market: Distribution by End-user
- 10.2.4.1. Lab Automation Market for Research and Diagnostic Laboratories, Till 2035
- 10.2.4.2. Lab Automation Market for Biotechnology and Pharmaceutical Industries, Till 2035
- 10.2.4.3. Lab Automation Market for Other End-users, Till 2035
- 10.2.5. Lab Automation Market: Distribution by Key Geographical Regions
- 10.2.5.1. Lab Automation Market in North America, Till 2035
- 10.2.5.2. Lab Automation Market in Europe, Till 2035
- 10.2.5.3. Lab Automation Market in Asia-Pacific, Till 2035
- 10.2.5.4. Lab Automation Market in Middle East and North Africa, Till 2035
- 10.2.5.5. Lab Automation Market in Latin America, Till 2035
- 10.2.1. Lab Automation Market: Distribution by Stage of Automation
11. EXECUTIVE INSIGHTS
- 11.1. Chapter Overview
- 11.2. Company A
- 11.2.1. Company Overview
- 11.2.2. Interview Transcript: Production and Supply Management Lead
- 11.3. Company B
- 11.3.1. Company Overview
- 11.3.2. Interview Transcript: Chief Executive Officer
- 11.4. Company C
- 11.4.1. Company Overview
- 11.4.2. Interview Transcript: Anonymous
- 11.5. Company D
- 11.5.1. Company Overview
- 11.5.2. Interview Transcript: Project Manager and Business Development
- 11.6. Company E
- 11.6.1. Company Overview
- 11.6.2. Interview Transcript: Chief Commercial Officer
- 11.7. Company F
- 11.7.1. Company Overview
- 11.7.2. Interview Transcript: Account Manager
- 11.8. Company G
- 11.8.1. Company Overview
- 11.8.2. Interview Transcript: Sales Manager
- 11.9. Company H
- 11.9.1. Company Overview
- 11.9.2. Interview Transcript: Co-Founder and Co-Chief Executive Officer
12. APPENDIX I: TABULATED DATA
13. APPENDIX II: LIST OF COMPANIES AND ORGANIZATIONS
List of Tables
- Table 4.1 Lab Automation System Manufacturers: Information on Year of Establishment, Company Size and Location of Headquarters
- Table 4.2 Lab Automation System Manufacturers: Information on Type of Automated Instrument(s)
- Table 4.3 Lab Automation System Manufacturers: Information on Stage(s) of Automation, Application Area(s) and End-user(s)
- Table 6.1 Abbott: Lab Automation Products
- Table 6.2 Abbott: Recent Developments and Future Outlook
- Table 6.3 Anton Paar: Lab Automation Products
- Table 6.4 Anton Paar: Future Outlook
- Table 6.5 BD: Lab Automation Products
- Table 6.6 BD: Recent Developments and Future Outlook
- Table 6.7 Beckman Coulter: Lab Automation Products
- Table 6.8 Beckman Coulter: Recent Developments and Future Outlook
- Table 6.9 ERWEKA: Lab Automation Products
- Table 6.10 ERWEKA: Recent Developments and Future Outlook
- Table 6.11 Leuze: Lab Automation Products
- Table 6.12 Leuze: Recent Developments and Future Outlook
- Table 6.13 Ortho Clinical Diagnostics: Lab Automation Products
- Table 6.14 Ortho Clinical Diagnostics: Recent Developments and Future Outlook
- Table 6.15 Pall Corporation: Lab Automation Products
- Table 6.16 Pall Corporation: Recent Developments and Future Outlook
- Table 6.17 PerkinElmer: Lab Automation Products
- Table 6.18 PerkinElmer: Recent Developments and Future Outlook
- Table 6.19 Roche Diagnostics: Lab Automation Products
- Table 6.20 Roche Diagnostics: Recent Developments and Future Outlook
- Table 6.21 Siemens Healthineers: Lab Automation Products
- Table 6.22 Siemens Healthineers: Recent Developments and Future Outlook
- Table 6.23 SYSTAG: Lab Automation Products
- Table 6.24 SYSTAG: Recent Developments and Future Outlook
- Table 7.1 Lab Automation Software Providers: Information on Location of Headquarters, Company Size, Type of Software, Mode(s) of Deployment and End-User(s)
- Table 8.1 Lab Automation: List of Partnerships and Collaborations
- Table 9.1 Lab Automation: List of Filed / Granted Patents
- Table 9.2 Patent Analysis: Categorization based on Weighted Valuation Scores
- Table 12.1 Lab Automation System Manufacturers: Distribution by Year of Establishment
- Table 12.2 Lab Automation System Manufacturers: Distribution by Company Size
- Table 12.3 Lab Automation System Manufacturers: Distribution by Location of Headquarters (Region-wise)
- Table 12.4 Lab Automation System Manufacturers: Distribution by Location of Headquarters (Country-wise)
- Table 12.5 Lab Automation System Manufacturers: Distribution by Company Size and Location of Headquarters (Region-wise)
- Table 12.6 Lab Automation System Manufacturers: Distribution by Type of Lab Automation system(s)
- Table 12.7 Lab Automation System Manufacturers: Distribution by Type of Automated Liquid Handling System(s)
- Table 12.8 Lab Automation System Manufacturers: Distribution by Type of Automated Microplate(s)
- Table 12.9 Lab Automation System Manufacturers: Distribution by Stage(s) of Automation
- Table 12.10 Lab Automation System Manufacturers: Distribution by Application Area(s)
- Table 12.11 Lab Automation System Manufacturers: Distribution by Type of Lab Automation System(s) and Application Area(s)
- Table 12.12 Lab Automation System Manufacturers: Distribution by End-user(s)
- Table 12.13 Lab Automation System Manufacturers: Distribution by Stage(s) of Automation and End-user(s)
- Table 12.14 Abbott: Annual Revenues, Since FY 2018 (USD Billion)
- Table 12.15 BD: Annual Revenues, Since FY 2018 (USD Billion)
- Table 12.16 Danaher (parent company of Beckman Coulter): Annual Revenues, Since FY 2018 (USD Billion)
- Table 12.17 Ortho Clinical Diagnostics: Annual Revenues, Since FY 2019 (USD Billion)
- Table 12.18 Danaher (parent company of Pall Corporation): Annual Revenues, Since FY 2018 (USD Billion)
- Table 12.19 PerkinElmer: Annual Revenues, Since FY 2018 (USD Billion)
- Table 12.20 Roche Diagnostics: Annual Revenues, Since FY 2018 (CHF Billion)
- Table 12.21 Siemens Healthineers: Annual Revenues, Since FY 2018 (USD Billion)
- Table 12.22 Lab Automation Software Providers: Distribution by Year of Establishment
- Table 12.23 Lab Automation Software Providers: Distribution by Company Size
- Table 12.24 Lab Automation Software Providers: Distribution by Location of Headquarters (Region-wise)
- Table 12.25 Lab Automation Software Providers: Distribution by Location of Headquarters (Country-wise)
- Table 12.26 Lab Automation Software Providers: Distribution by Company Size and Location of Headquarters (Region-wise)
- Table 12.27 Lab Automation Software Providers: Distribution by Type of Software
- Table 12.28 Lab Automation Software Providers: Distribution by Mode(s) of Deployment
- Table 12.29 Lab Automation Software Providers: Distribution by Type of Software and Mode(s) of Deployment
- Table 12.30 Lab Automation Software Providers: Distribution by End-user(s)
- Table 12.31 Lab Automation Software Providers: Distribution by Type of Software and End-user(s)
- Table 12.32 Partnerships and Collaborations: Distribution by Year of Partnership
- Table 12.33 Partnerships and Collaborations: Distribution by Type of Partnership
- Table 12.34 Partnerships and Collaborations: Distribution by Year and Type of Partnership
- Table 12.35 Partnerships and Collaborations: Distribution by Type of Partner
- Table 12.36 Partnerships and Collaborations: Distribution by Year of Partnership and Type of Partner
- Table 12.37 Partnerships and Collaborations: Distribution by Type of Partnership and Type of Partner
- Table 12.38 Partnerships and Collaborations: Distribution by Type of Automation Instrument(s)
- Table 12.39 Most Active Players: Distribution by Number of Partnerships
- Table 12.40 Partnerships and Collaborations: Local and International Agreements
- Table 12.41 Partnerships and Collaborations: Intercontinental and Intracontinental Agreements
- Table 12.42 Patent Analysis: Distribution by Patent Publication Year
- Table 12.43 Patent Analysis: Distribution by Publication Year and Type of Patent
- Table 12.44 Patent Analysis: Distribution by Application Year
- Table 12.45 Patent Analysis: Distribution by Patent Jurisdiction
- Table 12.46 Patent Analysis: Distribution in Asia-Pacific and Rest of the World
- Table 12.47 Patent Analysis: Distribution of Patents in China by Type of Applicant
- Table 12.48 Patent Analysis: List of Top CPC Symbols
- Table 12.49 Patent Analysis: Cumulative Distribution by Type of Applicant
- Table 12.50 Patent Analysis: Distribution by Patent Age
- Table 12.51 Leading Industry Players: Distribution by Number of Patents
- Table 12.52 Leading Non-Industry Players: Distribution by Number of Patents
- Table 12.53 Leading Individual Assignees: Distribution by Number of Patents
- Table 12.54 Patent Valuation: Distribution by Relative Patent Valuation
- Table 12.55 Global Lab Automation Market: Conservative, Base and Optimistic Scenarios, Till 2035 (USD Billion)
- Table 12.56 Lab Automation Market: Distribution by Stage of Automation
- Table 12.57 Lab Automation Market for Pre-analytical Stage: Conservative, Base and Optimistic Scenarios, Till 2035 (USD Million)
- Table 12.58 Lab Automation Market for Analytical Stage: Conservative, Base and Optimistic Scenarios, Till 2035 (USD Million)
- Table 12.59 Lab Automation Market for Post-analytical Stage: Conservative, Base and Optimistic Scenarios, Till 2035 (USD Million)
- Table 12.60 Lab Automation Market for Total Lab Automation: Conservative, Base and Optimistic Scenarios, Till 2035 (USD Million)
- Table 12.61 Lab Automation Market: Distribution by Type of Instrument
- Table 12.62 Lab Automation Market for Automated Liquid Handling Systems: Conservative, Base and Optimistic Scenarios, Till 2035 (USD Million)
- Table 12.63 Lab Automation Market for Automated Microplate Readers: Conservative, Base and Optimistic Scenarios, Till 2035 (USD Million)
- Table 12.64 Lab Automation Market for Automated Sampling Systems: Conservative, Base and Optimistic Scenarios, Till 2035 (USD Million)
- Table 12.65 Lab Automation Market for Analyzers: Conservative, Base and Optimistic Scenarios, Till 2035 (USD Million)
- Table 12.66 Lab Automation Market for Automated Storage and Retrieval Systems (ASRS): Conservative, Base and Optimistic Scenarios, Till 2035 (USD Million)
- Table 12.67 Lab Automation Market for Other Instruments: Conservative, Base and Optimistic Scenarios, Till 2035 (USD Million)
- Table 12.68 Lab Automation Market: Distribution by Application
- Table 12.69 Lab Automation Market for Diagnostics: Conservative, Base and Optimistic Scenarios, Till 2035 (USD Million)
- Table 12.70 Lab Automation Market for Genomic Solutions: Conservative, Base and Optimistic Scenarios, Till 2035 (USD Million)
- Table 12.71 Lab Automation Market for Microbiology: Conservative, Base and Optimistic Scenarios, Till 2035 (USD Million)
- Table 12.72 Lab Automation Market for Drug Discovery: Conservative, Base and Optimistic Scenarios, Till 2035 (USD Million)
- Table 12.73 Lab Automation Market for Proteomic Solutions: Conservative, Base and Optimistic Scenarios, Till 2035 (USD Million)
- Table 12.74 Lab Automation Market for Other Applications: Conservative, Base and Optimistic Scenarios, Till 2035 (USD Million)
- Table 12.75 Lab Automation Market: Distribution by End-user
- Table 12.76 Lab Automation Market for Research and Diagnostic Laboratories: Conservative, Base and Optimistic Scenarios, Till 2035 (USD Million)
- Table 12.77 Lab Automation Market for Biotechnology and Pharmaceutical Industries: Conservative, Base and Optimistic Scenarios, Till 2035 (USD Million)
- Table 12.78 Lab Automation Market for Other End-users: Conservative, Base and Optimistic Scenarios, Till 2035 (USD Million)
- Table 12.79 Lab Automation Market: Distribution by Key Geographical Regions
- Table 12.80 Lab Automation Market in North America: Conservative, Base and Optimistic Scenarios, Till 2035 (USD Million)
- Table 12.81 Lab Automation Market in Europe: Conservative, Base and Optimistic Scenarios, Till 2035 (USD Million)
- Table 12.82 Lab Automation Market in Asia-Pacific: Conservative, Base and Optimistic Scenarios, Till 2035 (USD Million)
- Table 12.83 Lab Automation Market in Middle East and North Africa: Conservative, Base and Optimistic Scenarios, Till 2035 (USD Million)
- Table 12.84 Lab Automation Market in Latin America: Conservative, Base and Optimistic Scenarios, Till 2035 (USD Million)
List of Figures
- Figure 2.1 Executive Summary: Overall Market Landscape of Lab Automation System Manufacturers
- Figure 2.2 Executive Summary: Partnerships and Collaborations
- Figure 2.3 Executive Summary: Patent Analysis
- Figure 2.4 Executive Summary: Market Forecast and Opportunity Analysis
- Figure 3.1 Historical Evolution of Lab Automation
- Figure 3.2 Process Involved in Lab Automation
- Figure 3.3 Advantages of Lab Automation Over Manual Handling
- Figure 4.1 Lab Automation System Manufacturers: Distribution by Year of Establishment
- Figure 4.2 Lab Automation System Manufacturers: Distribution by Company Size
- Figure 4.3 Lab Automation System Manufacturers: Distribution by Location of Headquarters (Region-wise)
- Figure 4.4 Lab Automation System Manufacturers: Distribution by Location of Headquarters (Country-wise)
- Figure 4.5 Lab Automation System Manufacturers: Distribution by Company Size and Location of Headquarters (Region-wise)
- Figure 4.6 Lab Automation System Manufacturers: Distribution by Type of Lab Automation System(s)
- Figure 4.7 Lab Automation System Manufacturers: Distribution by Type of Automated Liquid Handling System(s)
- Figure 4.8 Lab Automation System Manufacturers: Distribution by Type of Automated Microplate(s)
- Figure 4.9 Lab Automation System Manufacturers: Distribution by Stage(s) of Automation
- Figure 4.10 Lab Automation System Manufacturers: Distribution by Application Area(s)
- Figure 4.11 Lab Automation System Manufacturers: Distribution by Type of Lab Automation system(s) and Application Area(s)
- Figure 4.12 Lab Automation System Manufacturers: Distribution by End-user(s)
- Figure 4.13 Lab Automation System Manufacturers: Distribution by Stage(s) of Automation and End-user(s)
- Figure 5.1 Company Competitiveness Analysis: Very Small Companies based in North America (Peer Group I)
- Figure 5.2 Company Competitiveness Analysis: Small Companies based in North America (Peer Group II)
- Figure 5.3 Company Competitiveness Analysis: Mid-sized Players based in North America (Peer Group III)
- Figure 5.4 Company Competitiveness Analysis: Large Companies based in North America (Peer Group IV)
- Figure 5.5 Company Competitiveness Analysis: Very Large Companies based in North America (Peer Group V)
- Figure 5.6 Company Competitiveness Analysis: Very Small Companies based in Europe (Peer Group VI)
- Figure 5.7 Company Competitiveness Analysis: Small Companies based in Europe (Peer Group VII)
- Figure 5.8 Company Competitiveness Analysis: Mid-sized Companies based in Europe (Peer Group VIII)
- Figure 5.9 Company Competitiveness Analysis: Large Companies based in Europe (Peer Group IX)
- Figure 5.10 Company Competitiveness Analysis: Very Large Companies based in Europe (Peer Group X)
- Figure 5.11 Company Competitiveness Analysis: Very Small Companies based in Asia-Pacific and Rest of the World (Peer Group XI)
- Figure 5.12 Company Competitiveness Analysis: Small Companies based in Asia-Pacific and Rest of the World (Peer Group XII)
- Figure 5.13 Company Competitiveness Analysis: Mid-sized Companies based in Asia-Pacific and Rest of the World (Peer Group XIII)
- Figure 5.14 Company Competitiveness Analysis: Large Companies based in Asia-Pacific and Rest of the World (Peer Group XIV)
- Figure 5.15 Company Competitiveness Analysis: Very Large Companies based in Asia-Pacific and Rest of the World (Peer Group XV)
- Figure 6.1 Abbott: Annual Revenues, Since 2018 (USD Billion)
- Figure 6.2 Abbott: Product Portfolio
- Figure 6.3 Anton Paar: Product Portfolio
- Figure 6.4 BD: Annual Revenues, Since FY 2018 (USD Billion)
- Figure 6.5 BD: Product Portfolio
- Figure 6.6 Danaher (Parent Company of Beckman Coulter): Annual Revenues, Since FY 2018 (USD Billion)
- Figure 6.7 Beckman Coulter: Product Portfolio
- Figure 6.8 ERWEKA: Product Portfolio
- Figure 6.9 Leuze: Product Portfolio
- Figure 6.10 Ortho Clinical Diagnostics: Annual Revenues, Since FY 2019 (USD Billion)
- Figure 6.11 Ortho Clinical Diagnostics: Product Portfolio
- Figure 6.12 Danaher (Parent Company of Pall Corporation): Annual Revenues, Since FY 2018 (USD Billion)
- Figure 6.13 Pall Corporation: Product Portfolio
- Figure 6.14 PerkinElmer: Annual Revenues, Since FY 2018 (USD Billion)
- Figure 6.15 PerkinElmer: Product Portfolio
- Figure 6.16 Roche Diagnostics: Annual Revenues, Since FY 2018 (CHF Billion)
- Figure 6.17 Roche Diagnostics: Product Portfolio
- Figure 6.18 Siemens Healthineers: Annual Revenues, Since FY 2018 (Euro Billion)
- Figure 6.19 Siemens Healthineers: Product Portfolio
- Figure 6.20 SYSTAG: Product Portfolio
- Figure 7.1 Lab Automation Software Providers: Distribution by Year of Establishment
- Figure 7.2 Lab Automation Software Providers: Distribution by Company Size
- Figure 7.3 Lab Automation Software Providers: Distribution by Location of Headquarters (Region-wise)
- Figure 7.4 Lab Automation Software Providers: Distribution by Location of Headquarters (Country-wise)
- Figure 7.5 Lab Automation Software Providers: Distribution by Company Size and Location of Headquarters (Region-wise)
- Figure 7.6 Lab Automation Software Providers: Distribution by Type of Software
- Figure 7.7 Lab Automation Software Providers: Distribution by Mode(s) of Deployment
- Figure 7.8 Lab Automation Software Providers: Distribution by Type of Software and Mode(s) of Deployment
- Figure 7.9 Lab Automation Software Providers: Distribution by End-user(s)
- Figure 7.10 Lab Automation Software Providers: Distribution by Type of Software and End-user(s)
- Figure 8.1 Partnerships and Collaborations: Distribution by Year of Partnership
- Figure 8.2 Partnerships and Collaborations: Distribution by Type of Partnership
- Figure 8.3 Partnerships and Collaborations: Distribution by Year and Type of Partnership
- Figure 8.4 Partnerships and Collaborations: Distribution by Type of Partner
- Figure 8.5 Partnerships and Collaborations: Distribution by Year of Partnership and Type of Partner
- Figure 8.6 Partnerships and Collaborations: Distribution by Type of Partnership and Type of Partner
- Figure 8.7 Partnerships and Collaborations: Distribution by Type of Automation Instrument(s) Used
- Figure 8.8 Most Active Players: Distribution by Number of Partnerships
- Figure 8.9 Partnerships and Collaborations: Local and International Agreements
- Figure 8.10 Partnerships and Collaborations: Intercontinental and Intracontinental Agreements
- Figure 9.1 Patent Analysis: Distribution by Patent Publication Year
- Figure 9.2 Patent Analysis: Distribution by Publication Year and Type of Patent
- Figure 9.3 Patent Analysis: Distribution by Application Year
- Figure 9.4 Patent Analysis: Distribution by Patent Jurisdiction
- Figure 9.5 Patent Analysis: Distribution by CPC Symbols
- Figure 9.6 Patent Analysis: Cumulative Distribution by Type of Applicant
- Figure 9.7 Word Cloud: Emerging Focus Areas
- Figure 9.8 Patent Analysis: Distribution by Patent Age
- Figure 9.9 Leading Industry Players: Distribution by Number of Patents
- Figure 9.10 Leading Non-Industry Players: Distribution by Number of Patents
- Figure 9.11 Leading Individual Assignees: Distribution by Number of Patents
- Figure 9.12 Patent Benchmarking: Distribution of Leading Industry Players by Patent Characterization (CPC Symbols)
- Figure 9.13 Patent Valuation: Distribution by Relative Patent Valuation
- Figure 10.1. Global Lab Automation Market, Till 2035 (USD Billion)
- Figure 10.2. Global Lab Automation Market: Distribution by Stage of Automation
- Figure 10.3. Lab Automation Market for Pre-analytical Stage, Till 2035 (USD Million)
- Figure 10.4. Lab Automation Market for Analytical Stage, Till 2035 (USD Million)
- Figure 10.5. Lab Automation Market for Post-analytical Stage, Till 2035 (USD Million)
- Figure 10.6. Lab Automation Market for Total Lab Automation, Till 2035 (USD Million)
- Figure 10.7. GlobalLab Automation Market: Distribution by Type of Instrument
- Figure 10.8. Lab Automation Market for Automated Liquid Handling Systems, Till 2035 (USD Million)
- Figure 10.9. Lab Automation Market for Automated Microplate Readers, Till 2035 (USD Million)
- Figure 10.10. Lab Automation Market for Automated Sampling Systems, Till 2035 (USD Million)
- Figure 10.11. Lab Automation Market for Analyzers, Till 2035 (USD Million)
- Figure 10.12. Lab Automation Market for Automated Storage and Retrieval Systems (ASRS), Till 2035 (USD Million)
- Figure 10.13. Lab Automation Market for Other Instruments, Till 2035 (USD Million)
- Figure 10.14. GlobalLab Automation Market: Distribution by Application
- Figure 10.15. Lab Automation Market for Diagnostics, Till 2035 (USD Million)
- Figure 10.16. Lab Automation Market for Genomic Solutions, Till 2035 (USD Million)
- Figure 10.17. Lab Automation Market for Microbiology, Till 2035 (USD Million)
- Figure 10.18. Lab Automation Market for Drug Discovery, Till 2035 (USD Million)
- Figure 10.19. Lab Automation Market for Proteomic Solutions, Till 2035 (USD Million)
- Figure 10.20. Lab Automation Market for Other Applications, Till 2035 (USD Million)
- Figure 10.21. Global Lab Automation Market: Distribution by End-user
- Figure 10.22. Lab Automation Market for Research and Diagnostic Laboratories, Till 2035 (USD Million)
- Figure 10.23. Lab Automation Market for Biotechnology and Pharmaceutical Industries, Till 2035 (USD Million)
- Figure 10.24. Lab Automation Market for Other End-users, Till 2035 (USD Million)
- Figure 10.25. Global Lab Automation Market: Distribution by Key Geographical Regions
- Figure 10.26. Lab Automation Market in North America, Till 2035 (USD Million)
- Figure 10.27. Lab Automation Market in Europe, Till 2035 (USD Million)
- Figure 10.28. Lab Automation Market in Asia-Pacific, Till 2035 (USD Million)
- Figure 10.29. Lab Automation Market in Middle East and North Africa, Till 2035 (USD Million)
- Figure 10.30. Lab Automation Market in Latin America, Till 2035 (USD Million)

