
PUBLISHER: Roots Analysis | PRODUCT CODE: 1762529

PUBLISHER: Roots Analysis | PRODUCT CODE: 1762529
Flow Cytometry Services Market: Industry Trends and Global Forecasts - Distribution by Service, Number of Facilities, Key Players, and Key Geographical Regions
FLOW CYTOMETRY SERVICES MARKET: OVERVIEW
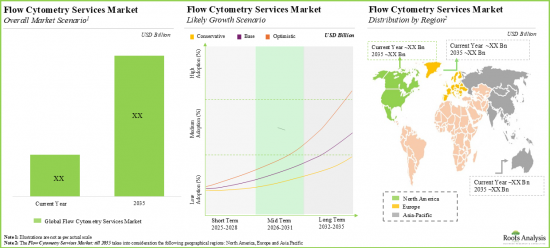
As per Roots Analysis, the global flow cytometry services market valued at USD 2.76 billion in the current year is anticipated to grow at a CAGR of 9.73% during the forecast period, till 2035.
The market sizing and opportunity analysis has been segmented across the following parameters:
Service
- Type of General Flow Cytometric Services
- Assay Development
- Consumables Manufacturing
- Type of Analysis based Flow Cytometric Services
- PBMC Analysis
- Whole Blood Cells Analysis
- Bone Marrow Aspirate Analysis
- Stem Cells Analysis
- Rare Cells Detection
- Cell Profiling and Subsetting
- Intracellular Staining
- Other Type of Flow Cytometric Services
Key Geographical Regions
- North America
- Europe
- Asia Pacific
- Rest of the World
FLOW CYTOMETRY SERVICES MARKET: GROWTH AND TRENDS
Over time, flow cytometry has gained considerable attention as an analytical method in disease diagnosis and drug development. In biology and medicine, flow cytometry is known as a technique which is used to measure various physical and chemical characteristics of cells or particles as they pass through a laser beam when suspended in a fluid. Further, given the various limitations of conventional techniques, such as western blotting and immunohistochemistry, stakeholders are increasingly opting for innovative technologies, such as flow cytometry for clinical purposes. Conventional methods have low specificity and sensitivity, which may produce false results. Notably, flow cytometry techniques have the potential to overcome a number of these challenges.
Additionally, owing to the growing healthcare burden related to cancer and immunological disease conditions, and developments in immunological and biomedical research, the adoption of flow cytometry is expected to increase. This in turn will increase dependency on flow cytometry services providers to optimize process costs, overcome complexities associated with the process and improve process timelines.
FLOW CYTOMETRY SERVICES MARKET: KEY INSIGHTS
The report delves into the current state of the global flow cytometry services market and identifies potential growth opportunities within industry. Some key findings from the report include:
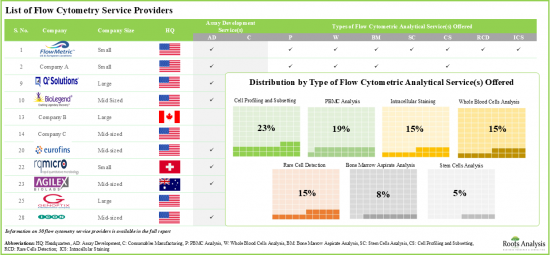
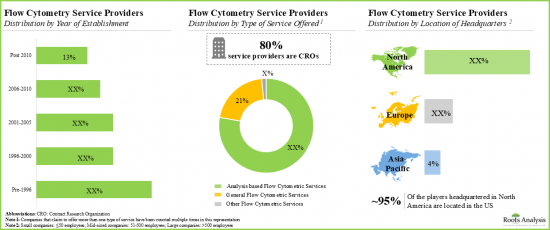
- 30 companies claim to offer various types of flow cytometry services; majority of these offer analysis-based flow cytometric services.
- The current market landscape features the presence of both well-established and new firms offering a wide range of flow cytometry services; a relatively large proportion of the players are based in North America.
- Examples of large flow cytometry services providers established post 2000 include Neo Genomics, Q2 Solutions, Cell Carta and ICON Speciality Labs.
- More than 70% of stakeholders claim to offer analysis-based flow cytometric services, followed by 21% of players offering general flow cytometric services.
- Close to 75% of players who are headquartered in the US are mid-sized players; the majority (around 80%) of these players claim to provide analysis-based flow cytometry services.
- Several players are also engaged in the manufacturing of different types of flow cytometers, including research flow cytometers and clinical flow cytometers for use across multiple application areas.
- More than 50% of the flow cytometers being manufactured are research flow cytometers; examples of players developing such systems include Becton Dickinson and Sysmex Partec.
- A large proportion (60%) of flow cytometers are manufactured using the cell-based technique; however, bead-based flow technique is also being employed by several players.
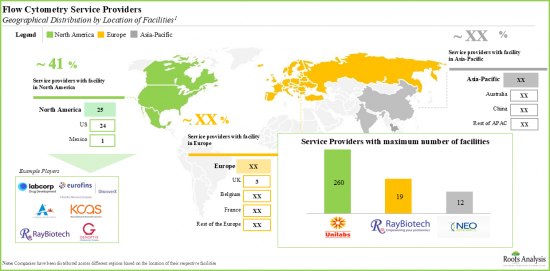
- With more than 100 facilities, flow cytometry service providers offer services across various regions around the world; majority of these facilities are established in emerging geographies.
- North America dominates the flow cytometry manufacturing market; examples of players based in this region include Agilent, Beckman Coulter and Thermofisher Scientific.
- In pursuit of a competitive edge, stakeholders are actively expanding their existing capabilities to enhance their respective offerings and comply with the evolving industry benchmarks.
- Over the past few years, there has been a significant increase in partnership activity in this domain; majority of the instances were related to mergers and acquisitions.
- The market is anticipated to grow at an annualized rate of ~9.73% till 2035; the future opportunity is expected to be well distributed across key geographical regions.
Example Players in the Flow Cytometry Services Market
- FlowMetric Life Sciences
- Flow Contract Sites Laboratory
- Bio-Legend
- Q2 Solutions
- ProImmune
- MLM Medical Labs
- Unilabs
- Firalis
- Agilex Biolabs
FLOW CYTOMETRY SERVICES MARKET: RESEARCH COVERAGE
- Market Sizing and Opportunity Analysis: The report features an in-depth analysis of the flow cytometry services market, focusing on key market segments, including [A] service, [B] number of facilities, [C] key players and [D] key geographical regions.
- Market Landscape: A comprehensive evaluation of the flow cytometry service providers, based on several relevant parameters, such as [A] year of establishment, [B] company size, [C] location of headquarters, [D] location of flow cytometry facilities, [E] type of service(s) offered. Additionally, a comprehensive evaluation of manufacturers and the respective flow cytometry equipment developed / being developed by them.
- Company Competitiveness Analysis: A comprehensive competitive analysis of service providers in the flow cytometry industry, examining factors, such as [A] service strength and [B] supplier strength.
- Company Profiles: In-depth profiles of the companies offering services related to flow cytometry, focusing on [A] overview of the company, [B] financial information (if available), [C] service portfolio, [D] types of services offered, [E] location of flow cytometry facilities and [F] recent developments and an informed future outlook.
- Partnerships and Collaborations: An insightful analysis of the deals inked by stakeholders in the flow cytometry services market, based on several parameters, such as [A] year of partnership, [B] type of partnership, [C] type of partner, [D] type of service offered, [E] most active players (in terms of number of partnerships signed) and [F] geography.
KEY QUESTIONS ANSWERED IN THIS REPORT
- How many companies are currently engaged in this market?
- Which are the leading companies in this market?
- What factors are likely to influence the evolution of this market?
- What is the current and future market size?
- What is the CAGR of this market?
- How is the current and future market opportunity likely to be distributed across key market segments?
REASONS TO BUY THIS REPORT
- The report provides a comprehensive market analysis, offering detailed revenue projections of the overall market and its specific sub-segments. This information is valuable to both established market leaders and emerging entrants.
- Stakeholders can leverage the report to gain a deeper understanding of the competitive dynamics within the market. By analyzing the competitive landscape, businesses can make informed decisions to optimize their market positioning and develop effective go-to-market strategies.
- The report offers stakeholders a comprehensive overview of the market, including key drivers, barriers, opportunities, and challenges. This information empowers stakeholders to stay abreast of market trends and make data-driven decisions to capitalize on growth prospects.
ADDITIONAL BENEFITS
- Complimentary PPT Insights Packs
- Complimentary Excel Data Packs for all Analytical Modules in the Report
- 15% Free Content Customization
- Detailed Report Walkthrough Session with Research Team
- Free Updated report if the report is 6-12 months old or older
TABLE OF CONTENTS
1. PREFACE
- 1.1. Scope of the Report
- 1.2. Research Methodology
- 1.2.1. Research Assumptions
- 1.2.2. Project Methodology
- 1.2.3. Forecast Methodology
- 1.2.4. Robust Quality Control
- 1.2.5. Key Considerations
- 1.2.5.1. Demographics
- 1.2.5.2. Economic Factors
- 1.2.5.3. Government Regulations
- 1.2.5.4. Supply Chain
- 1.2.5.5. COVID Impact / Related Factors
- 1.2.5.6. Market Access
- 1.2.5.7. Healthcare Policies
- 1.2.5.8. Industry Consolidation
- 1.3 Key Questions Answered
- 1.4. Chapter Outlines
2. EXECUTIVE SUMMARY
3. INTRODUCTION
- 3.1. Chapter Overview
- 3.2. Introduction to Flow Cytometry
- 3.3. Flow Cytometry Versus Conventional Analytical Techniques
- 3.4. Difference between Flow Cytometer, Cell Analyzer and Cell Sorter
- 3.5. Flow Cytometry Instrumentation
- 3.5.1. Flow Cytometry: Cell Analyzing and Counting Methodology
- 3.5.2. Flow Cytometry: Software and Automation Support
- 3.6. Flow Cytometry Services
- 3.7. Application of Flow Cytometry
- 3.8. Future Perspectives
4. MARKET LANDSCAPE
- 4.1. Chapter Overview
- 4.2. Flow Cytometry Service Providers: Overall Market Landscape
- 4.2.1. Analysis by Year of Establishment
- 4.2.2. Analysis by Company Size
- 4.2.3. Analysis by Location of Headquarters
- 4.2.4. Analysis by Location of Flow Cytometry Facilities
- 4.2.5. Analysis by Type of Service(s) Offered
- 4.2.6. Analysis by Type of General Flow Cytometric Services Offered
- 4.2.7. Analysis by Type(s) of Analysis-based Flow Cytometric Services Offered
- 4.2.8. Analysis by Flow Cytometry Instrument Providers
5. COMPANY COMPETITIVENESS ANALYSIS
- 5.1. Chapter Overview
- 5.2. Methodology
- 5.3. Key Parameters
- 5.4. Competitiveness Analysis: Flow Cytometry Service Providers
- 5.4.1. Companies offering Flow Cytometry Service Providers in North America
- 5.4.2. Companies offering Flow Cytometry Service Providers in Europe and Asia-Pacific
6. COMPANY PROFILES: FLOW CYTOMETRY SERVICE PROVIDERS IN NORTH AMERICA
- 6.1. Chapter Overview
- 6.2. FlowMetric Life Sciences
- 6.2.1. Company Overview
- 6.2.2. FlowMetric Life Sciences: Flow Cytometry Services Portfolio
- 6.2.3. FlowMetric Life Sciences: Recent Developments and Future Outlook
- 6.3. Flow Contract Sites Laboratory
- 6.3.1. Company Overview
- 6.3.2. Flow Contract Sites Laboratory: Flow Cytometry Services Portfolio
- 6.3.3. Flow Contract Sites Laboratory: Recent Developments and Future Outlook
- 6.4. Bio-Legend
- 6.4.1. Company Overview
- 6.4.2. Bio-Legend: Flow Cytometry Services Portfolio
- 6.4.3. Bio-Legend: Recent Developments and Future Outlook
- 6.5. Q2 Solutions
- 6.5.1. Company Overview
- 6.5.2. Q2 Solutions: Flow Cytometry Services Portfolio
- 6.5.3. Q2 Solutions: Recent Developments and Future Outlook
7. COMPANY PROFILES: FLOW CYTOMETRY SERVICE PROVIDERS IN EUROPE AND ASIA-PACIFIC
- 7.1. Chapter Overview
- 7.2. ProImmune
- 7.2.1. Company Overview
- 7.2.2. ProImmune: Flow Cytometry Services Portfolio
- 7.2.3. ProImmune: Recent Developments and Future Outlook
- 7.3. MLM Medical Labs
- 7.3.1. Company Overview
- 7.3.2. MLM Medical Labs: Flow Cytometry Services Portfolio
- 7.3.3. MLM Medical Labs: Recent Developments and Future Outlook
- 7.4. Unilabs
- 7.4.1. Company Overview
- 7.4.2. Unilabs: Flow Cytometry Services Portfolio
- 7.4.3. Unilabs Recent Developments and Future Outlook
- 7.5. Firalis
- 7.5.1. Company Overview
- 7.5.2. Firalis: Flow Cytometry Services Portfolio
- 7.5.3. Firalis: Recent Developments and Future Outlook
- 7.6. Agilex Biolabs
- 7.6.1. Company Overview
- 7.6.2. Agilex Biolabs: Flow Cytometry Services Portfolio
- 7.6.3. Agilex Biolabs: Recent Developments and Future Outlook
8. PARTNERSHIPS AND COLLABORATIONS
- 8.1. Chapter Overview
- 8.2. Partnership Models
- 8.3. Flow Cytometry Service Providers: Partnerships and Collaborations
- 8.3.1. Analysis by Year of Partnership
- 8.3.2. Analysis by Type of Partnership
- 8.3.3. Analysis by Type of Collaborator
- 8.4. Flow Cytometry Service Providers: Information on Type of Service(s) Offered
- 8.4.1. Analysis by Type of Service(s)
- 8.4.2. Analysis by Type of Partnership and Type of Service(s)
- 8.4.3. Most Active Players: Analysis by Number of Partnerships
- 8.5. Top Partners
- 8.6. Geographical Analysis
- 8.7. Intercontinental and Intracontinental Agreements
9. EFFICIENCY COMPARISON MODULE
- 9.1. Chapter Overview
- 9.2. Key Parameters
- 9.3. Methodology
- 9.4. Flow Cytometry Efficiency Comparison Analysis
- 9.5. Inclusive Efficiency Comparison Analysis
- 9.6. Respective Efficiency Comparison Analysis
- 9.6.1. Flow Cytometry and Immunohistochemistry
- 9.6.2. Flow Cytometry and Cytogenetics Testing
- 9.6.3. Flow Cytometry and Fluorescence Microscopy
- 9.6.4. Flow Cytometry and ELISA
- 9.6.5. Flow Cytometry and Western Blotting
- 9.6.6. Flow Cytometry and Hematology Cell Analyzer
- 9.6.7. Flow Cytometry and Dynabead Method
- 9.7. Concluding Remarks
10. MARKET FORECAST
- 10.1. Chapter Overview
- 10.2. Forecast Methodology and Key Assumptions
- 10.3. Flow Cytometry Services Market, Till 2035
- 10.4. Flow Cytometry Services Market, Till 2035: Analysis by Key Geographical Region
- 10.4.1. Flow Cytometry Services Market in North America, Till 2035
- 10.4.2. Flow Cytometry Services Market in Europe, Till 2035
- 10.4.3. Flow Cytometry Services Market in Asia-Pacific, Till 2035
- 10.5. Conclusion
11. CONCLUDING REMARKS
12. APPENDIX 1: TABULATED DATA
13. APPENDIX 2: LIST OF COMPANIES AND ORGANIZATIONS
List of Tables
- Table 3.1 Difference between Flow Cytometer, Cell Analyzer and Cell Sorter
- Table 4.1 Flow Cytometry Services Providers: List of Companies
- Table 4.2 Flow Cytometry Service Providers: Information on Types of Services Offered
- Table 4.3 List of Flow Cytometers: Information on Instrument Manufacturers,
- Table 6.1 Flow Cytometry Services Providers in North America: List of Companies Profiled
- Table 6.2 FlowMetric Life Sciences: Company Snapshot
- Table 6.3 FlowMetric Life Sciences: Flow Cytometry Services Portfolio
- Table 6.4 FlowMetric Life Sciences: Recent Developments and Future Outlook
- Table 6.5 Flow Contract Site Laboratory: Company Snapshot
Table 6.6: Flow Contract Site Laboratory: Flow Cytometry Services Portfolio
- Table 6.7 Flow Contract Site Laboratories: Recent Developments and Future Outlook
- Table 6.8 Bio-Legend: Company Snapshot
- Table 6.9 Bio-Legend: Flow Cytometry Services Portfolio
- Table 6.10 Bio-Legend: Recent Developments and Future Outlook
- Table 6.11 Q2 Solutions: Company Snapshot
- Table 6.12 Q2 Solutions: Flow Cytometry Services Portfolio
- Table 7.1 Flow Cytometry Service Providers in Europe: List of Companies Profiled
- Table 7.2 ProImmune: Company Snapshot
- Table 7.3 ProImmune: Flow Cytometry Services Portfolio
- Table 7.4 ProImmune: Recent Developments and Future Outlook
- Table 7.5 MLM Medical Labs: Company Snapshot
- Table 7.6 MLM Medical Labs: Flow Cytometry Services Portfolio
- Table 7.7 MLM Medical Labs: Recent Developments and Future Outlook
- Table 7.8 Unilabs (Serving Pharma Facility): Company Snapshot
- Table 7.9 Unilabs: Flow Cytometry Services Portfolio
- Table 7.10 Unilabs: Recent Developments and Future Outlook
- Table 7.11 Firalis: Company Snapshot
- Table 7.12 Firalis: Flow Cytometry Services Portfolio
- Table 7.13 Firalis: Recent Developments and Future Outlook
- Table 7.14 Agilex Biolabs: Company Snapshot
- Table 7.15 Agilex Biolabs: Flow Cytometry Services Portfolio
- Table 7.16 Agilex Biolabs: Recent Developments and Future Outlook
- Table 8.1 Flow Cytometry Services Market: List of Partnerships
- Table 8.2 Partnerships and Collaborations: Information on the Type of Service(s)'
- Table 12.1 Flow Cytometry Service Providers: Distribution by Year of Establishment
- Table 12.2 Flow Cytometry Service Providers: Geographical Distribution by Company Size
- Table 12.3 Flow Cytometry Service Providers: Distribution by Location of Headquarters
- Table 12.4 Flow Cytometry Service Providers: Distribution by Location of Flow Cytometry Facilities
- Table 12.5 Flow Cytometry Service Providers: Distribution by Type of Service(s) Offered
- Table 12.6 Flow Cytometry Manufacturers: Distribution by Number of Instrument offered
- Table 12.7 Partnerships and Collaborations: Cumulative Year-wise Trend, Since 2010
- Table 12.8 Partnerships and Collaborations: Distribution by Type of Partnership
- Table 12.9 Partnerships and Collaborations: Distribution by Year and Type of Partnership
- Table 12.10 Partnerships and Collaborations: Distribution by Type of Partner
- Table 12.11 Partnerships and Collaborations: Distribution by Type of Service(s) Offered
- Table 12.12 Partnerships and Collaborations: Distribution by Type of Services and Type of Partnership
- Table 12.13 Most Active Players: Distribution by Number of Partnerships
- Table 12.14 Top Partners: Distribution by Number of Partnerships
- Table 12.15 Partnerships and Collaborations: Distribution by Geography
- Table 12.16 Partnerships and Collaborations: Distribution by Intercontinental and Intracontinental Agreements
- Table 12.17 Flow Cytometry Services Market, Conservative, Base and Optimistic Scenarios (USD Billion)
- Table 12.19 Flow Cytometry Services Market in North America, Conservative, Base and Optimistic Scenarios, Till 2035 (USD Billion)
- Table 12.20 Flow Cytometry Services Market in Europe, Conservative, Base and Optimistic Scenarios, Till 2035 (USD Billion)
- Table 12.21 Flow Cytometry Services Market in Asia-Pacific, Conservative, Base and Optimistic Scenarios, Till 2035 (USD Billion)
List of Figures
- Figure 2.1 Executive Summary: Market Landscape
- Figure 2.2 Executive Summary: Manufacturer's Landscape
- Figure 2.3 Executive Summary: Partnerships and Collaborations
- Figure 2.4 Executive Summary: Market Forecast
- Figure 3.1 Working Mechanism of Flow Cytometry
- Figure 3.2 Flow Cytometry Services
- Figure 4.1 Flow Cytometry Service Providers: Distribution by Year of Establishment
- Figure 4.2 Flow Cytometry Service Providers: Distribution by Company Size
- Figure 4.3 Flow Cytometry Service Providers: Distribution by Location of Headquarters
- Figure 4.4 Flow Cytometry Service Providers: Distribution by Location of Flow Cytometry Facilities
- Figure 4.5 Flow Cytometry Service Providers: Distribution by Type of Service(s) Offered
- Figure 4.6 Flow Cytometry Services Providers: Distribution by Type of General Flow Cytometry Service Offered
- Figure 4.7 Flow Cytometry Service Providers: Distribution by Type of Analysis-based Flow Cytometry Service(s) Offered
- Figure 4.8 Flow Cytometry Instruments: Distribution by Instrument Provider
- Figure 5.1 Company Competitiveness Analysis: Flow Cytometry Service Providers in North America
- Figure 5.2 Company Competitiveness Analysis: Flow Cytometry Service Providers in Europe and Asia-Pacific
- Figure 8.1 Partnerships and Collaborations: Cumulative Year-wise Trend, Since 2010
- Figure 8.2 Partnerships and Collaborations: Distribution by Type of Partnership, Since 2010
- Figure 8.3 Partnerships and Collaborations: Distribution by Year and Type of Partnership, Since 2010
- Figure 8.4 Partnerships and Collaborations: Distribution by the Type of Collaborator, Since 2010
- Figure 8.5 Partnerships and Collaborations: Distribution by Type of Service(s)
- Figure 8.6 Partnerships and Collaborations: Distribution by Type of Partnership and Type of Service(s)
- Figure 8.7 Most Active Players: Distribution by Number of Partnerships
- Figure 8.8 Top Partners: Distribution by Number of partnerships
- Figure 8.9 Partnership and Collaboration: Geographical Analysis
- Figure 8.10 Partnerships and Collaborations: Intercontinental and Intracontinental Agreements
- Figure 9.1 Inclusive Efficiency Comparison Analysis: Flow Cytometry with other Diagnostics Techniques
- Figure 9.2 Efficiency Comparison Analysis: Flow Cytometry and Immunohistochemistry
- Figure 9.3 Efficiency Comparison Analysis: Flow Cytometry and Cytogenetics Testing
- Figure 9.4 Efficiency Comparison Analysis: Flow Cytometry and Fluorescence Microscopy
- Figure 9.5 Individual Efficiency Comparison Analysis: Flow Cytometry and ELISA
- Figure 9.6 Efficiency Comparison Analysis: Flow Cytometry and Western Blotting
- Figure 9.7 Efficiency Comparison Analysis: Flow Cytometry and Hematology Cell Analyzer
- Figure 9.8 Efficiency Comparison Analysis: Flow Cytometry and Dynabead Method
- Figure 10.1 Flow Cytometry Services Market, Till 2035 (USD Billion)
- Figure 10.2 Flow Cytometry Services Market: Distribution by Key Geographical Regions (USD Million)
- Figure 10.3 Flow Cytometry Services Market in North America, Till 2035 (USD Billion)
- Figure 10.4 Flow Cytometry Services Market in Europe, Till 2035 (USD Billion)
- Figure 10.5 Flow Cytometry Services Market in Asia-Pacific, Till 2035 (USD Billion)
- Figure 10.6 Flow Cytometry Services Market: Conservative, Base and Optimistic Scenarios (USD Billion)
- Figure 11.1 Concluding Remarks: Current Market Landscape of Flow Cytometry Service Providers
- Figure 11.2 Concluding Remarks: Flow Cytometer Manufacturers
- Figure 11.3 Concluding Remarks: Partnerships and Collaborations
- Figure 11.4 Concluding Remarks: Market Forecast Analysis

