
PUBLISHER: Roots Analysis | PRODUCT CODE: 1762531

PUBLISHER: Roots Analysis | PRODUCT CODE: 1762531
Prefilled Syringe Fill Finish Manufacturing Market: Industry Trends and Global Forecasts - Distribution by Type of Therapeutic Area, Type of Syringe Barrel Material, Type of Drug Molecule, Scale of Operation and Key Geographical Regions
PREFILLED SYRINGE FILL FINISH MANUFACTURING MARKET: OVERVIEW
As per Roots Analysis, the global prefilled syringe fill finish manufacturing market valued at USD 931 million in the current year is anticipated to grow at a lucrative CAGR of 11.9% during the forecast period.
The market sizing and opportunity analysis has been segmented across the following parameters:
Type of Therapeutic Area
- Blood Disorders
- Infectious Diseases
- Metabolic Disorders
- Oncology Disorders
- Neurological Disorders
- Autoimmune Disorders
- Others
Type of Syringe Barrel Material
- Glass
- Plastic
Number of Barrel Chambers
- Single Chamber
- Dual Chamber
Type of Drug Molecule
- Biologic
- Small Molecule
Scale of Operation
- Commercial
- Preclinical / Clinical
Key Geographical Regions
- North America
- Europe
- Asia- Pacific
PREFILLED SYRINGE FILL FINISH MANUFACTURING MARKET: GROWTH AND TRENDS
Fundamentally, a prefilled syringe is a single dose of medication, containing a pre-measured amount of injectable. It is used as a primary drug container for injectable drugs and vaccines. Some of the categories of drugs packaged in prefilled syringes include blood stimulants, erythropoietin products, interferons and therapeutic proteins. Over the past ten years, with the increase in development of parenteral drugs, the usage of prefilled syringes has tripled. Notably, these prefilled syringes offer several advantages over traditional drug delivery systems (such as vials and syringes), including reduced chances of dosing errors, increased patient compliance and decreased risk of microbial contamination. As a result, prefilled syringes are preferably being used in the delivery of injectable drugs, especially in the treatment of chronic diseases (requiring repeated administration of the medications).
The numerous benefits offered by prefilled syringes, coupled with the growing self-medication trend, have led to the approval of a number of drugs in combination with such devices, resulting in an increase in need to outsource fill / finish operations. Moreover, owing to a number of operational challenges, such as the requirement of technical expertise associated with close monitoring and control of syringe fill volume, the market has witnessed a shift in trend towards outsourcing of the fill / finish operations for prefilled syringes. Additionally, the current demand for safer, easier to use administration technologies along with the industry's efforts to reduce costs and increase efficiency are expected to drive the growth of the prefilled syringe fill finish manufacturing market in future.
PREFILLED SYRINGE FILL FINISH MANUFACTURING MARKET: KEY INSIGHTS
The report delves into the current state of the global prefilled syringe fill finish manufacturing market and identifies potential growth opportunities within industry. Some key findings from the report include:
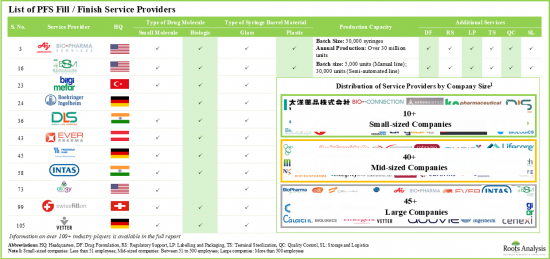
- Over 100 companies across the globe claim to provide contract fill / finish services for prefilled syringes; close to 50% of these service providers are large companies with over 500 employees.
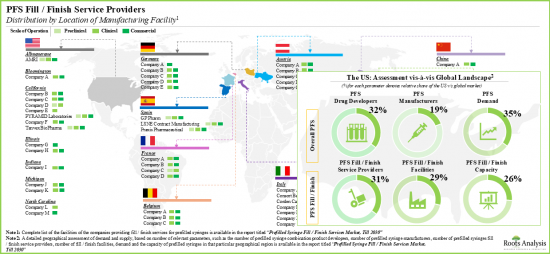
- The market landscape features the presence of well-established players in the domain, most of which claim to operate at various scales of operation and are located in different geographies.
- Over 55% of the companies have the capabilities to offer fill / finish services for both small molecules and biologics; ~20% of the companies are offering these services for only biologics.
- In order to acquire competencies across the supply chain and cater to the evolving needs of clients, companies offering services across different scales of operation have established presence in various geographies.
- Several contract service providers (~60), including AMRI, Catalent Biologics, Pierre Fabrre and Sandoz offer fill / finish services at both clinical and commercial scale of operation.
- Although most industry stakeholders are based in the developed regions, fill / finish operations in Asian countries, such as India, Taiwan and Bangladesh, are emerging.
- Fill / finish service providers are actively investing in expansion projects to upgrade existing capabilities and capacity; several partnerships, mostly focused on offering contract services, have also been forged.
- As expected, majority of the installed contract fill / finish capacity for prefilled syringes belongs to the large service providers, accounting for around 80% of the available global capacity.
- An evaluation of prefilled syringe combination product developers revealed that Europe and North America have emerged as the key regions for partnering opportunities for fill / finish service providers.
- Around 70 prefilled syringes are being manufactured by large companies, most of which claim to be capable of fabricating syringe barrels from both glass and plastic materials.
- We expect drug developers to continue to outsource their fill / finish operations in the short to midterm, resulting in an annualized growth at the rate of over 11.9% within the contract services market.
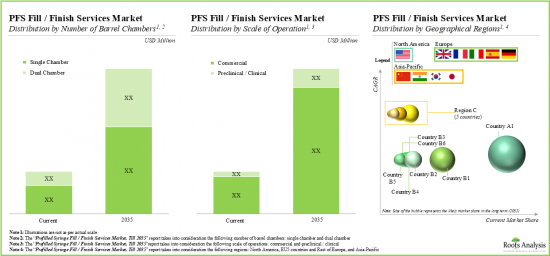
- In the long-term, the projected opportunity for the fill / finish service providers for prefilled syringes is likely to be well distributed across various types of barrel chambers, scales of operation and geographical regions.
- With an increasing demand for prefilled syringes and focus on user-friendly systems, the market opportunity is projected to evolve at a rapid pace in the coming years.
Example Players in the Prefilled Syringe Fill Finish Manufacturing Market
- Ajinomoto Bio-Pharma Services
- AMRI
- BioPharma Solutions
- Emergent BioSolutions
- Patheon (a Thermo Fisher Scientific Company)
- Consort Medical
- EVER Pharma
- GlaxoSmithKline
- IDT Biologika
- Rentschler Biopharma
- Siegfried
- Vetter Pharma
- Biocon
- Intas Pharmaceuticals
- Kemwell Biopharma
- Square Pharmaceuticals.
PREFILLED SYRINGE FILL FINISH MANUFACTURING MARKET: RESEARCH COVERAGE
- Market Sizing and Opportunity Analysis: The report features an in-depth analysis of the prefilled syringe fill finish manufacturing market, focusing on key market segments, including [A] type of therapeutic area, [B] type of syringe barrel material, [C] number of barrel chambers, [D] type of drug molecule, [E] scale of operation and [F] key geographical regions.
- Market Landscape: A comprehensive evaluation of companies offering contract fill / finish services for prefilled syringes, based on several relevant parameters, such as [A] year of establishment, [B] company size, [C] scale of operation, [D] location of the headquarters, [E] location of fill / finish facilities, [F] type of drug molecule, [G] syringe barrel material, [H] syringe fill volume and additional services offered and [I] installed capacity.
- Company Profiles: In-depth profiles of the players engaged in this domain, focusing on [A] overview of the company, [B] financial information (if available), [C] service portfolio, [D] fill / finish facilities and [E] recent developments and an informed future outlook.
- Recent Developments: A comprehensive competitive analysis of recent developments pertaining to contract fill / finish services, based on various parameters, such as [A] year of development, [B] type of activity / development, [C] scale of operation of the project, [D] location of expanded facility, [E] type of drug molecule involved and [F] additional services offered.
- Capacity Analysis: An in-depth analysis of contract fill / finish capacity of prefilled syringes, examining factors, such as [A] company size of manufacturer, [B] scale of operation, [C] location of headquarters and fill / finish facilities and [D] type of drug molecule.
- Demand Analysis: A detailed analysis of the current and future demand for fill / finish of prefilled syringes, based on various parameters, such as [A] marketed drugs available, [B] target patient population, [C] dosing frequency, [D] dose strength, [E] geography, [F] type of drug molecule, [G] therapeutic area, [H] syringe barrel material and [I] number of barrel chambers.
- Geographical Assessment of Demand and Supply: An insightful geographical analysis of demand and supply, based on several parameters, such as [A] number of prefilled syringe combination product developers, [B] number of prefilled syringe manufacturers, [C] number of prefilled syringe fill / finish service providers, [D] number of prefilled syringe fill / finish facilities, and [E] capacity and demand for prefilled syringes in that particular geographical region.
- Likely Partner Analysis: A detailed analysis of the potential strategic partners for prefilled syringe fill / finish service providers, based on various parameters, such as [A] developer strength, [B] pipeline strength, [C] type of drug molecule, [D] target therapeutic area and [E] location of the headquarters of the company.
- Case Study 1: A detailed discussion on the potential areas of growth, such as [A] growing injectable drugs pipeline, [B] increasing popularity of prefilled syringes, [C] rise in preference for outsourcing of fill / finish operations, [D] technological advancements in aseptic fill / finish processes and [E] growing opportunities in the Asia-Pacific region.
- Case Study 2: Elaborate assessment of prefilled syringe manufacturers landscape, based on a number of relevant parameters, such as [A] syringe barrel material, [B] number of barrel chambers, [C] type of needle system, [D] barrel volume, [E] year of establishment and [F] location of the headquarters of manufacturers.
KEY QUESTIONS ANSWERED IN THIS REPORT
- How many companies are currently engaged in this market?
- Which are the leading companies in this market?
- What factors are likely to influence the evolution of this market?
- What is the current and future market size?
- What is the CAGR of this market?
- How is the current and future market opportunity likely to be distributed across key market segments?
REASONS TO BUY THIS REPORT
- The report provides a comprehensive market analysis, offering detailed revenue projections of the overall market and its specific sub-segments. This information is valuable to both established market leaders and emerging entrants.
- Stakeholders can leverage the report to gain a deeper understanding of the competitive dynamics within the market. By analyzing the competitive landscape, businesses can make informed decisions to optimize their market positioning and develop effective go-to-market strategies.
- The report offers stakeholders a comprehensive overview of the market, including key drivers, barriers, opportunities, and challenges. This information empowers stakeholders to stay abreast of market trends and make data-driven decisions to capitalize on growth prospects.
ADDITIONAL BENEFITS
- Complimentary PPT Insights Packs
- Complimentary Excel Data Packs for all Analytical Modules in the Report
- 15% Free Content Customization
- Detailed Report Walkthrough Session with Research Team
- Free Updated report if the report is 6-12 months old or older
TABLE OF CONTENTS
1. PREFACE
- 1.1. Scope of the Report
- 1.2. Research Methodology
- 1.2.1. Research Assumptions
- 1.2.2. Project Methodology
- 1.2.3. Forecast Methodology
- 1.2.4. Robust Quality Control
- 1.2.5. Key Considerations
- 1.2.5.1. Demographics
- 1.2.5.2. Economic Factors
- 1.2.5.3. Government Regulations
- 1.2.5.4. Supply Chain
- 1.2.5.5. COVID Impact / Related Factors
- 1.2.5.6. Market Access
- 1.2.5.7. Healthcare Policies
- 1.2.5.8. Industry Consolidation
- 1.3 Key Questions Answered
- 1.4. Chapter Outlines
2. EXECUTIVE SUMMARY
3. INTRODUCTION
- 3.1. Chapter Overview
- 3.2. Introduction to Prefilled Syringes
- 3.2.1. Classification of Prefilled Syringes
- 3.2.2. Manufacturing of Prefilled Syringes
- 3.2.3. Advantages of Prefilled Syringes
- 3.2.3.1. Benefits to Healthcare Professionals and End Users
- 3.2.3.2. Benefits to Manufacturers
- 3.3. Fill / Finish Processing of Prefilled Syringes
- 3.3.1. Steps Involved in Fill / Finish Process
- 3.3.2. Methods of Filling and Stoppering of Prefilled Syringes
- 3.3.3. Prefilled Syringe Filling Technologies
- 3.4. Factors Contributing to the Growth of Prefilled Syringe Fill / Finish Market
- 3.5. Need for Outsourcing Fill / Finish Operations of Sterile Injectables
- 3.6. Advantages of Outsourcing Fill / Finish Services
- 3.7. Risks Associated with Outsourcing of Fill / Finish Operations
- 3.8. Key Considerations While Selecting a Fill / Finish Service Provider
4. MARKET LANDSCAPE
- 4.1. Chapter Overview
- 4.2. Prefilled Syringe Fill / Finish Service Providers: Overall Market Landscape
- 4.2.1. Analysis by Year of Establishment
- 4.2.2. Analysis by Company Size
- 4.2.3. Analysis by Scale of Operation
- 4.2.4. Analysis by Location of Headquarters
- 4.2.5. Analysis by Location of Prefilled Syringe Fill / Finish Facilities
- 4.2.6. Analysis by Type of Drug Molecule
- 4.2.7. Analysis by Syringe Barrel Material
- 4.2.8. Analysis by Syringe Fill Volume
- 4.2.9. Analysis by Additional Services Offered
- 4.2.10. Heat Map: Analysis by Company Size and Location of Headquarters
- 4.2.11. Logo Landscape: Analysis by Company Size and Type of Drug Molecule
- 4.2.12. Geographical Map: Analysis by Scale of Operation and Location of Fill / Finish Facilities
- 4.2.13. Grid Representation: Distribution by Year of Establishment, Company Size and Type of Drug Molecule
5. PREFILLED SYRINGE FILL / FINISH SERVICE PROVIDERS IN NORTH AMERICA: COMPANY PROFILES
- 5.1. Chapter Overview
- 5.2. Ajinomoto Bio-Pharma Services
- 5.2.1. Company Overview
- 5.2.2. Recent Developments and Future Outlook
- 5.3. AMRI
- 5.3.1. Company Overview
- 5.3.2. Recent Developments and Future Outlook
- 5.4. BioPharma Solutions
- 5.4.1. Company Overview
- 5.4.2. Recent Developments and Future Outlook
- 5.5. Emergent BioSolutions
- 5.5.1. Company Overview
- 5.5.2. Recent Developments and Future Outlook
- 5.6. Patheon (a Thermo Fisher Scientific Company)
- 5.6.1. Company Overview
- 5.6.2. Recent Developments and Future Outlook
6. PREFILLED SYRINGE FILL / FINISH SERVICE PROVIDERS IN EUROPE: COMPANY PROFILES
- 6.1. Chapter Overview
- 6.2. Consort Medical
- 6.2.1. Company Overview
- 6.2.2. Recent Developments and Future Outlook
- 6.3. EVER Pharma
- 6.3.1. Company Overview
- 6.3.2. Recent Developments and Future Outlook
- 6.4. GlaxoSmithKline
- 6.4.1. Company Overview
- 6.4.2. Recent Developments and Future Outlook
- 6.5. IDT Biologika
- 6.5.1. Company Overview
- 6.5.2. Recent Developments and Future Outlook
- 6.6. Rentschler Biopharma
- 6.6.1. Company Overview
- 6.6.2. Recent Developments and Future Outlook
- 6.7. Siegfried
- 6.7.1. Company Overview
- 6.7.2. Recent Developments and Future Outlook
- 6.8. Vetter Pharma
- 6.8.1. Company Overview
- 6.8.2. Recent Developments and Future Outlook
7. PREFILLED SYRINGE FILL / FINISH SERVICE PROVIDERS IN ASIA-PACIFIC: COMPANY PROFILES
- 7.1. Chapter Overview
- 7.2. Biocon
- 7.2.1. Company Overview
- 7.2.2. Recent Developments and Future Outlook
- 7.3. Intas Pharmaceuticals
- 7.3.1. Company Overview
- 7.3.2. Recent Developments and Future Outlook
- 7.4. Kemwell Biopharma
- 7.4.1. Company Overview
- 7.4.2. Recent Developments and Future Outlook
- 7.5. Square Pharmaceuticals
- 7.5.1. Company Overview
- 7.5.2. Recent Developments and Future Outlook
8. PREFILLED SYRINGE FILL / FINISH SERVICE PROVIDERS: RECENT DEVELOPMENTS
- 8.1. Chapter Overview
- 8.2. List of Expansions
- 8.2.1. Analysis by Year of Expansion
- 8.2.2. Analysis by Type of Expansion
- 8.2.3. Analysis by Expanded Scale of Operation
- 8.2.4. Analysis by Location of Expansion Project
- 8.2.5. Analysis by Type of Drug Molecule Involved
- 8.2.6. Analysis by Additional Services Offered (Expansion Specific)
- 8.3. Partnership Models
- 8.4. List of Partnerships and Collaborations
- 8.4.1. Analysis by Year of Partnership
- 8.4.2. Analysis by Type of Partnership
- 8.4.3. Analysis by Scale of Operation (Deal Specific)
- 8.4.4. Analysis by Additional Services Offered (Deal Specific)
9. CAPACITY ANALYSIS
- 9.1. Chapter Overview
- 9.2. Assumptions and Methodology
- 9.3. Global, Prefilled Syringe Fill / Finish Capacity (by Number of Units)
- 9.3.1. Analysis by Company Size
- 9.3.2. Analysis by Scale of Operation
- 9.3.3. Analysis by Location of Headquarters
- 9.3.4. Analysis by Location of Fill / Finish Facilities
- 9.3.5. Analysis by Type of Drug Molecule
- 9.4. Global, Prefilled Syringe Fill / Finish Capacity (by Volume)
- 9.4.1. Analysis by Company Size (Manufacturer)
- 9.4.2. Analysis by Scale of Operation
- 9.4.3. Analysis by Location of Headquarters
- 9.4.4. Analysis by Location of Fill / Finish Facilities
- 9.4.5. Analysis by Type of Drug Molecule
10. DEMAND ANALYSIS
- 10.1. Chapter Overview
- 10.2. Assumptions and Methodology
- 10.3. Global Demand for Prefilled Syringes Fill / Finish Services
- 10.3.1. Global Demand for Commercialized Prefilled Syringes Fill / Finish Services
- 10.3.1.1. Analysis by Geography
- 10.3.1.1.1. North America
- 10.3.1.1.2. Europe
- 10.3.1.1.3. Asia-Pacific
- 10.3.1.1.4. Latin America
- 10.3.1.1.5. Middle East and Africa
- 10.3.1.2. Analysis by Syringe Barrel Material
- 10.3.1.3. Analysis by Number of Barrel Chambers
- 10.3.1.4. Analysis by Type of Drug Molecule
- 10.3.1.5. Analysis by Therapeutic Area
- 10.3.1.6. Analysis by Specialty Syringes
- 10.3.1.1. Analysis by Geography
- 10.3.2. Global Demand for Clinical Prefilled Syringes Fill / Finish Services
- 10.3.1. Global Demand for Commercialized Prefilled Syringes Fill / Finish Services
- 10.4. Demand and Supply Analysis
- 10.4.1. Demand and Supply Analysis (Scenario 1)
- 10.4.2. Demand and Supply Analysis (Scenario 2)
- 10.4.3. Demand and Supply Analysis (Scenario 3)
11. GEOGRAPHICAL ASSESSMENT OF DEMAND AND SUPPLY
- 11.1. Chapter Overview
- 11.2. Assumptions and Key Parameters
- 11.3. Demand and Supply Assessment in North America
- 11.3.1. Key Geographies
- 11.3.1.1. US
- 11.3.1. Key Geographies
- 11.4. Demand and Supply Assessment in Europe
- 11.4.1. Key Geographies
- 11.4.1.1. France
- 11.4.1.2. Germany
- 11.4.1.3. Italy
- 11.4.1. Key Geographies
- 11.5. Demand and Supply Assessment in Asia-Pacific Region
- 11.5.1. Key Geographies
- 11.5.1.1. India
- 11.5.1.2. Japan
- 11.5.1. Key Geographies
12. LIKELY PARTNER ANALYSIS
- 12.1. Chapter Overview
- 12.2. Methodology and Key Parameters
- 12.3. Likely Partner Analysis
- 12.3.1. Opportunities in North America
- 12.3.1.1. Most Likely Partners for Prefilled Syringe Fill / Finish Service Providers
- 12.3.1.2. Likely Partners for Prefilled Syringe Fill / Finish Service Providers
- 12.3.2. Opportunities in Europe
- 12.3.2.1. Most Likely Partners for Prefilled Syringe Fill / Finish Service Providers
- 12.3.2.2. Likely Partners for Prefilled Syringe Fill / Finish Service Providers
- 12.3.3. Opportunities in Asia-Pacific and Rest of the World
- 12.3.3.1. Most Likely Partners for Prefilled Syringe Fill / Finish Service Providers
- 12.3.3.2. Likely Partners for Prefilled Syringe Fill / Finish Service Providers
- 12.3.1. Opportunities in North America
13. MARKET SIZING AND OPPORTUNITY ANALYSIS
- 13.1. Chapter Overview
- 13.2. Forecast Methodology and Key Assumptions
- 13.3. Overall Prefilled Syringe Fill / Finish Services Market, Till 2035
- 13.3.1. Prefilled Syringe Fill / Finish Services Market: Distribution by Scale of Operation, Till 2035
- 13.3.2. Prefilled Syringe Fill / Finish Services Market: Distribution by Geographical Region
- 13.3.2.1. Prefilled Syringe Fill / Finish Services Market in North America
- 13.3.2.2. Prefilled Syringe Fill / Finish Services Market in Europe
- 13.3.2.3. Prefilled Syringe Fill / Finish Services Market in Asia-Pacific
- 13.3.2.4. Prefilled Syringe Fill / Finish Services Market Latin America
- 13.3.2.5. Prefilled Syringe Fill / Finish Services Market in Middle East and Africa
- 13.3.3. Prefilled Syringe Fill / Finish Services Market: Distribution by Type of Drug Molecule, Till 2035
- 13.3.4. Prefilled Syringe Fill / Finish Services Market: Distribution by Therapeutic Area
- 13.3.5. Prefilled Syringe Fill / Finish Services Market: Distribution by Syringe Barrel Material, Till 2035
- 13.3.6. Prefilled Syringe Fill / Finish Services Market: Distribution by Number of Barrel Chambers, Till 2035
14. FUTURE GROWTH OPPORTUNITIES
- 14.1. Chapter Overview
- 14.2. Growing Injectable Drugs Pipeline
- 14.3. Increase in Popularity of Prefilled Syringes
- 14.4. Rise in Preference for Outsourcing Fill / Finish Activities
- 14.5. Advances in Aseptic Fill / Finish Technologies
- 14.6. Growing Opportunities in the Asia-Pacific Region
15. CASE STUDY: PREFILLED SYRINGE MANUFACTURERS
- 15.1. Chapter Overview
- 15.2. Prefilled Syringes: List of Available / Under Development Devices
- 15.2.1. Analysis by Syringe Barrel Material
- 15.2.2. Analysis by Number of Barrel Chambers
- 15.2.3. Analysis by Type of Needle System
- 15.2.4. Analysis by Barrel Volume
- 15.3. Prefilled Syringes: List of Manufacturers
- 15.3.1. Analysis by Year of Establishment
- 15.3.2. Analysis by Location of Headquarters
16. CONCLUDING REMARKS
- 16.1. Chapter Overview
- 16.2. Key Takeaways
17. INTERVIEW TRANSCRIPTS
- 17.1. Chapter Overview
- 17.2. Company A
- 17.2.1. Company Snapshot
- 17.2.2. Interview Transcript: President and Cofounder
- 17.3. Company B
- 17.3.1. Company Snapshot
- 17.3.2. Interview Transcript: Chief Technical Officer
- 17.4. Company C
- 17.4.1. Company Snapshot
- 17.4.2. Interview Transcript: Chief Commercial Officer
- 17.5. Company D
- 17.5.1. Company Snapshot
- 17.5.2. Interview Transcript: Associate Director, Head of Process Sciences Formulation and Fill / Finish
- 17.6. Company E
- 17.6.1. Company Snapshot
- 17.6.2. Interview Transcript: Research Director and Head of Formulation Development
- 17.7. Company F
- 17.7.1. Company Snapshot
- 17.7.2. Interview Transcript: Design Director
18. APPENDIX 1: TABULATED DATA
19. APPENDIX 2: LIST OF COMPANIES
List of Tables
- Table 3.1 Classification of Prefilled Syringes
- Table 4.1 Prefilled Syringe Fill / Finish Service Providers: List of Companies
- Table 4.2 Prefilled Syringe Fill / Finish Service Providers: Information on Location of Fill / Finish Facilities
- Table 4.3 Prefilled Syringe Fill / Finish Service Providers: Information on Type of Drug Molecule
- Table 4.4 Prefilled Syringe Fill / Finish Service Providers: Information on Syringe Barrel Material
- Table 4.5 Prefilled Syringe Fill / Finish Service Providers: Information on Syringe Fill Volume Range
- Table 4.6 Prefilled Syringe Fill / Finish Service Providers: Information on Additional Services Offered
- Table 4.7 Prefilled Syringe Fill / Finish Service Providers: Distribution by Company Size and Location of Headquarters
- Table 4.8 Prefilled Syringe Fill / Finish Service Providers: Information on Fill / Finish Capability
- Table 5.1 Prefilled Syringes Fill / Finish Service Providers in North America: List of Profiled Companies
- Table 5.2 Ajinomoto Bio-Pharma Services: Company Snapshot
- Table 5.3 Ajinomoto Bio-Pharma Services: Recent Developments and Future Outlook
- Table 5.4 AMRI: Company Snapshot
- Table 5.5 AMRI: Recent Developments and Future Outlook
- Table 5.6 BioPharma Solutions: Company Snapshot
- Table 5.7 BioPharma Solutions: Recent Developments and Future Outlook
- Table 5.8 Emergent BioSolutions: Company Snapshot
- Table 5.9 Emergent BioSolutions: Recent Developments and Future Outlook
- Table 5.10 Patheon: Company Snapshot
- Table 5.11 Patheon: Recent Developments and Future Outlook
- Table 6.1 Prefilled Syringe Fill / Finish Service Providers in Europe: List of Profiled Companies
- Table 6.2 Consort Medical: Company Snapshot
- Table 6.3 Consort Medical: Recent Developments and Future Outlook
- Table 6.4 EVER Pharma: Company Snapshot
- Table 6.5 EVER Pharma: Recent Developments and Future Outlook
- Table 6.6 GlaxoSmithKline: Company Snapshot
- Table 6.7 GlaxoSmithKline: Recent Developments and Future Outlook
- Table 6.8 IDT Biologika: Company Snapshot
- Table 6.9 IDT Biologika: Recent Developments and Future Outlook
- Table 6.10 Rentschler Biopharma: Company Snapshot
- Table 6.11 Rentschler Biopharma: Recent Developments and Future Outlook
- Table 6.12 Siegfried: Company Snapshot
- Table 6.13 Siegfried: Recent Developments and Future Outlook
- Table 6.14 Vetter Pharma: Company Snapshot
- Table 6.15 Vetter Pharma: Recent Developments and Future Outlook
- Table 7.1 Prefilled Syringes Fill / Finish Service Providers in Asia-Pacific: List of Profiled Companies
- Table 7.2 Biocon: Company Snapshot
- Table 7.3 Biocon: Recent Developments and Future Outlook
- Table 7.4 Intas Pharmaceuticals: Company Snapshot
- Table 7.5 Intas Pharmaceuticals: Recent Developments and Future Outlook
- Table 7.6 Kemwell Biopharma: Company Snapshot
- Table 7.7 Kemwell Biopharma: Recent Developments and Future Outlook
- Table 7.8 Square Pharmaceuticals: Company Snapshot
- Table 7.9 Square Pharmaceuticals: Recent Developments and Future Outlook
- Table 8.1 Prefilled Syringe Fill / Finish Service Providers: Recent Expansions, Since 2015
- Table 8.2 Expansions: Information on Additional Services Offered
- Table 8.3 Prefilled Syringe Fill / Finish Service Providers: Partnerships and Collaborations, Since 2015
- Table 8.4 Partnerships: Information on Type of Services
- Table 9.1 Global, Prefilled Syringe Fill / Finish Capacity (by Number of Units): Average Capacity by Company Size (Sample Data Set)
- Table 10.1 Global Prefilled Syringe Fill / Finish Services Annual Supply, Till 2035 (Million Units)
- Table 10.2 Global Annual Outsourcing Demand for Prefilled Syringe Fill / Finish Services (Million Units)
- Table 10.3 Global Annual Outsourcing Demand for Prefilled Syringe Fill / Finish Services (Million Units)
- Table 10.4 Global Annual Outsourcing Demand for Prefilled Syringe Fill / Finish Services (Million Units)
- Table 11.1 Demand and Supply Assessment: North America
- Table 11.2 Demand and Supply Assessment: Europe
- Table 11.3 Demand and Supply Assessment: Asia-Pacific
- Table 12.1 Opportunities in North America: Most Likely Partners for Prefilled Syringe Fill / Finish Service Providers
- Table 12.2 Opportunities in North America: Likely Partners for Prefilled Syringe Fill / Finish Service Providers
- Table 12.3 Opportunities in Europe: Most Likely Partners for Prefilled Syringe Fill / Finish Service Providers
- Table 12.4 Opportunities in Europe: Likely Partners for Prefilled Syringe Fill / Finish Service Providers
- Table 12.5 Opportunities in Asia-Pacific and Rest of the World: Most Likely Partners for Prefilled Syringe Fill / Finish Service Providers
- Table 12.6 Opportunities in Asia-Pacific and Rest of the World: Likely Partners for Prefilled Syringe Fill / Finish Service Providers
- Table 14.1 List of Pharmaceutical Robotics Manufacturers
- Table 14.2 List of Companies Supplying Ready-to-Use Packaging Components
- Table 14.3 Patent Expiry of Biologics, Since 2018
- Table 15.1 Prefilled Syringes: List of Available / Under Development Devices
- Table 15.2 Prefilled Syringes: List of Manufacturers
- Table 16.1 Prefilled Syringe Fill / Finish Services Market: Key Takeaways
- Table 17.1 Bio Elpida: Key Highlights
- Table 17.2 Intas Pharmaceuticals: Key Highlights
- Table 17.3 IDT Biologika: Key Highlights
- Table 17.4 Takeda: Key Highlights
- Table 17.5 Syngene: Key Highlights
- Table 17.6 IDEO: Key Highlights
- Table 18.1 Prefilled Syringe Fill / Finish Service Providers: Distribution by Year of Establishment
- Table 18.2 Prefilled Syringe Fill / Finish Service Providers: Distribution by Company Size
- Table 18.3 Prefilled Syringe Fill / Finish Service Providers: Distribution by Scale of Operation
- Table 18.4 Prefilled Syringe Fill / Finish Service Providers: Distribution by Location of Headquarters
- Table 18.5 Prefilled Syringe Fill / Finish Service Providers: Distribution by Location of Fill / Finish Facilities
- Table 18.6 Prefilled Syringe Fill / Finish Service Providers: Distribution by Company Size and Type of Drug Molecule
- Table 18.7 Prefilled Syringe Fill / Finish Service Providers: Distribution by Syringe Barrel Material
- Table 18.8 Prefilled Syringe Fill / Finish Service Providers: Distribution by Syringe Fill Volume
- Table 18.9 Prefilled Syringe Fill / Finish Service Providers: Distribution by Additional Services Offered
- Table 18.10 Partnerships and Collaborations: Distribution by Year of Partnership, Since 2015
- Table 18.11 Partnerships and Collaborations: Distribution by Type of Partnership
- Table 18.12 Partnerships and Collaborations: Distribution by Scale of Operation (Deal Specific)
- Table 18.13 Partnerships and Collaborations: Distribution by Additional Services Offered (Deal Specific)
- Table 18.14 Most Active Players: Distribution by Number of Partnerships
- Table 18.15 Expansions: Distribution by Year of Expansion, Since 2015
- Table 18.16 Expansions: Distribution by Type of Expansion
- Table 18.17 Expansions: Distribution by Expanded Scale of Operation
- Table 18.18 Expansions: Distribution by Location of Expansion Project
- Table 18.19 Expansions: Distribution by Type of Drug Molecule Involved
- Table 18.20 Expansions: Distribution by Additional Services Offered (Expansion Specific)
- Table 18.21 Global, Prefilled Syringe Fill / Finish Capacity: Distribution of Capacity by Size of Manufacturer (Sample Data Set)
- Table 18.22 Global, Prefilled Syringe Fill / Finish Capacity: Distribution by Company Size of Manufacturer (in Million Units)
- Table 18.23 Global, Prefilled Syringe Fill / Finish Capacity (by Number of Units): Distribution by Scale of Operation (in Million Units)
- Table 18.24 Global, Prefilled Syringe Fill / Finish Capacity (by Number of Units): Distribution by Location of Headquarters (in Million Units)
- Table 18.25 Global, Prefilled Syringe Fill / Finish Capacity (by Number of Units): Distribution by Location of Fill / Finish Facilities (in Million Units)
- Table 18.26 Global, Prefilled Syringe Fill / Finish Capacity (by Number of Units): Distribution by Type of Drug Molecule (in Million Units)
- Table 18.27 Global, Prefilled Syringe Fill / Finish Capacity: Distribution by Company Size of Manufacturer (in Million Liters)
- Table 18.28 Global, Prefilled Syringe Fill / Finish Capacity (by Volume): Distribution by Scale of Operation (in Million Liters)
- Table 18.29 Global, Prefilled Syringe Fill / Finish Capacity (by Volume): Distribution by Location of Headquarters (in Million Liters)
- Table 18.30 Global, Prefilled Syringe Fill / Finish Capacity (by Volume): Distribution by Location of Fill / Finish Facilities (in Million Liters)
- Table 18.31 Global, Prefilled Syringe Fill / Finish Capacity (by Volume): Distribution by Type of Drug Molecule (in Million Liters)
- Table 18.32 Global, Demand for Prefilled Syringe Fill / Finish Services
- Table 18.33 Global, Demand for Prefilled Syringe Fill / Finish Services: Distribution by Geography
- Table 18.34 Global, Demand for Prefilled Syringe Fill / Finish Services: Distribution by Type of Drug Molecule
- Table 18.35 Global, Demand for Prefilled Syringe Fill / Finish Services: Distribution by Therapeutic Area
- Table 18.36 Global, Demand for Prefilled Syringe Fill / Finish Services: Distribution by Syringe Barrel Material
- Table 18.37 Global, Demand for Prefilled Syringe Fill / Finish Services: Distribution by Number of Barrel Chambers
- Table 18.38 Demand and Supply Assessment: North America
- Table 18.39 Demand and Supply Assessment: Europe
- Table 18.40 Demand and Supply Assessment: Asia-Pacific and Rest of the World
- Table 18.41 Likely Partner Analysis: Distribution by Geography
- Table 18.42 Overall Prefilled Syringe Fill / Finish Services Market, Conservative, Base and Optimistic Scenarios, Till 2035 (USD Billion)
- Table 18.43 Prefilled Syringe Fill / Finish Services Market, Till 2035: Distribution by Scale of Operation, Conservative, Base and Optimistic Scenarios, (USD Million)
- Table 18.44 Prefilled Syringe Fill / Finish Services Market, Till 2035: Distribution by Geographical Location, Conservative, Base and Optimistic Scenarios, (USD Million)
- Table 18.45 Prefilled Syringe Fill / Finish Services Market, Till 2035: Distribution by Type of Drug Molecule, Conservative, Base and Optimistic Scenarios, (USD Million)
- Table 18.46 Prefilled Syringe Fill / Finish Services Market, Till 2035: Distribution by Therapeutic Area, Conservative, Base and Optimistic Scenarios, (USD Million)
- Table 18.47 Prefilled Syringe Fill / Finish Services Market, Till 2035: Distribution by Syringe Barrel Material, Conservative, Base and Optimistic Scenarios, (USD Million)
- Table 18.48 Prefilled Syringe Fill / Finish Services Market, Till 2035: Distribution by Number of Barrel Chambers, Conservative, Base and Optimistic Scenarios, (USD Million)
- Table 18.49 Prefilled Syringes: Distribution by Syringe Barrel Material
- Table 18.50 Prefilled Syringes: Distribution by Number of Barrel Chambers
- Table 18.51 Prefilled Syringes: Distribution by Type of Needle System
- Table 18.52 Prefilled Syringes: Distribution by Barrel Volume
- Table 18.53 Prefilled Syringe Manufacturers: Distribution by Year of Establishment
- Table 18.54 Prefilled Syringe Manufacturers: Distribution by Company Size
- Table 18.55 Prefilled Syringe Manufacturers: Distribution by Location of Headquarters
List of Figures
- Figure 3.1 Prefilled Syringe Manufacturing: Common Processes
- Figure 3.2 Prefilled Syringes: Fill / Finish Process
- Figure 3.3 Risks and Challenges of Outsourcing Fill / Finish Operations
- Figure 3.4 Key Considerations while Selecting a Fill / Finish Service Provider
- Figure 4.1 Prefilled Syringe Fill / Finish Service Providers: Distribution by Year of Establishment
- Figure 4.2 Prefilled Syringe Fill / Finish Service Providers: Distribution by Company Size
- Figure 4.3 Prefilled Syringe Fill / Finish Service Providers: Distribution by Scale of Operation
- Figure 4.4 Prefilled Syringe Fill / Finish Service Providers: Distribution by Location of Headquarters
- Figure 4.5 Prefilled Syringe Fill / Finish Service Providers: Distribution by Location of Prefilled Syringe Fill / Finish Facilities
- Figure 4.6 Prefilled Syringe Fill / Finish Service Providers: Distribution by Type of Drug Molecule
- Figure 4.7 Prefilled Syringe Fill / Finish Service Providers: Distribution by Syringe Barrel Material
- Figure 4.8 Prefilled Syringe Fill / Finish Service Providers: Distribution by Syringe Fill Volume
- Figure 4.9 Prefilled Syringe Fill / Finish Service Providers: Distribution by Additional Services Offered
- Figure 4.10 Prefilled Syringe Fill / Finish Service Providers: Distribution by Company Size and Type of Drug Molecule
- Figure 4.11 Prefilled Syringe Fill / Finish Service Providers: Distribution by Scale of Operation and Location of Fill / Finish Facilities
- Figure 4.12 Prefilled Syringe Fill / Finish Service Providers: Distribution by Year of Establishment, Company Size and Type of Drug Molecule
- Figure 8.1 Expansions: Distribution by Year of Expansion, Since 2015
- Figure 8.2 Expansions: Distribution by Type of Expansion
- Figure 8.3 Expansions: Distribution by Expanded Scale of Operation
- Figure 8.4 Expansions: Distribution by Location of Expansion Project
- Figure 8.5 Expansions: Distribution by Type of Drug Molecule Involved
- Figure 8.6 Expansions: Distribution by Additional Services Offered (Expansion Specific)
- Figure 8.7 Partnerships and Collaborations: Cumulative Trend by Year, Since 2015
- Figure 8.8 Partnerships and Collaborations: Distribution by Type of Partnership
- Figure 8.9 Partnerships and Collaborations: Distribution by Scale of Operation (Deal Specific)
- Figure 8.10 Partnerships and Collaborations: Distribution by Additional Services Offered (Deal Specific)
- Figure 9.1 Global, Prefilled Syringe Fill / Finish Capacity: Distribution of Capacity by Company Size (Sample Data Set)
- Figure 9.2 Global, Prefilled Syringe Fill / Finish Capacity: Distribution by Company Size (in Million Units)
- Figure 9.3 Global, Prefilled Syringe Fill / Finish Capacity (by Number of Units): Distribution by Scale of Operation (in Million Units)
- Figure 9.4 Global, Prefilled Syringe Fill / Finish Capacity (by Number of Units): Distribution by Location of Headquarters (in Million Units)
- Figure 9.5 Global, Prefilled Syringe Fill / Finish Capacity (by Number of Units): Distribution by Location of Fill / Finish Facilities (in Million Units)
- Figure 9.6 Global, Prefilled Syringe Fill / Finish Capacity (by Number of Units): Distribution by Type of Drug Molecule (in Million Units)
- Figure 9.7 Global, Prefilled Syringe Fill / Finish Capacity: Distribution by Company Size (in Million Liters)
- Figure 9.8 Global, Prefilled Syringe Fill / Finish Capacity (by Volume): Distribution by Scale of Operation (in Million Liters)
- Figure 9.9 Global, Prefilled Syringe Fill / Finish Capacity (by Volume): Distribution by Location of Headquarters (in Million Liters)
- Figure 9.10 Global, Prefilled Syringe Fill / Finish Capacity (by Volume): Distribution by Location of Fill / Finish Facilities (in Million Liters)
- Figure 9.11 Global, Prefilled Syringe Fill / Finish Capacity (by Volume): Distribution by Type of Drug Molecule (in Million Liters)
- Figure 10.1 Global, Demand for Prefilled Syringe Fill / Finish Services
- Figure 10.2 Global, Demand for Commercialized Prefilled Syringe Fill / Finish Services
- Figure 10.3 Global, Demand for Prefilled Syringe Fill / Finish Services: Share of North America
- Figure 10.4 Global, Demand for Prefilled Syringe Fill / Finish Services: Share of Europe
- Figure 10.5 Global, Demand for Prefilled Syringe Fill / Finish Services: Share of Asia-Pacific
- Figure 10.6 Global, Demand for Prefilled Syringe Fill / Finish Services: Share of Latin America
- Figure 10.7 Global, Demand for Prefilled Syringe Fill / Finish Services: Share of Middle East and Africa
- Figure 10.8 Global, Demand for Prefilled Syringe Fill / Finish Services: Distribution by Syringe Barrel Material
- Figure 10.9 Global, Demand for Prefilled Syringe Fill / Finish Services: Distribution by Number of Barrel Chambers
- Figure 10.10 Global, Demand for Prefilled Syringe Fill / Finish Services: Distribution by Type of Drug Molecule
- Figure 10.11 Global, Demand for Prefilled Syringe Fill / Finish Services: Distribution by Therapeutic Area
- Figure 10.12 Global, Demand for Prefilled Syringe Fill / Finish Services: Distribution by Specialty Syringes
- Figure 10.13 Global, Demand for Clinical Prefilled Syringe Fill / Finish Services
- Figure 10.14 Global, Prefilled Syringe Fill / Finish Services: Demand and Supply Dynamics (Scenario 1)
- Figure 10.15 Global, Prefilled Syringe Fill / Finish Services: Demand and Supply Dynamics (Scenario 2)
- Figure 10.16 Global, Prefilled Syringe Fill / Finish Services: Demand and Supply Dynamics (Scenario 3)
- Figure 11.1 Demand and Supply Assessment: North America
- Figure 11.2 Demand and Supply Assessment: US
- Figure 11.3 Demand and Supply Assessment: Europe
- Figure 11.4 Demand and Supply Assessment: France
- Figure 11.5 Demand and Supply Assessment: Germany
- Figure 11.6 Demand and Supply Assessment: Italy
- Figure 11.7 Demand and Supply Assessment: Asia-Pacific Region
- Figure 11.8 Demand and Supply Assessment: India
- Figure 11.9 Demand and Supply Assessment: Japan
- Figure 12.1 Likely Partner Analysis: Distribution by Company Size and Location of Headquarters
- Figure 13.1 Overall Prefilled Syringe Fill / Finish Services Market, Till 2035 (USD Billion)
- Figure 13.2 Prefilled Syringe Fill / Finish Services Market, Till 2035: Distribution by Scale of Operation (USD Million)
- Figure 13.3 Prefilled Syringe Fill / Finish Services Market: Distribution by Geographical Location (USD Million)
- Figure 13.4 Prefilled Syringe Fill / Finish Services Market, Till 2035: Distribution by Geographical Location, North America (USD Million)
- Figure 13.5 Prefilled Syringe Fill / Finish Services Market, Till 2035: Distribution by Geographical Location, Europe (USD Million)
- Figure 13.6 Prefilled Syringe Fill / Finish Services Market, Till 2035: Distribution by Geographical Location, Asia-Pacific (USD Million)
- Figure 13.7 Prefilled Syringe Fill / Finish Services Market, Till 2035: Distribution by Geographical Location, Latin America (USD Million)
- Figure 13.8 Prefilled Syringe Fill / Finish Services Market, Till 2035: Distribution by Geographical Location, Middle East and Africa (USD Million)
- Figure 13.9 Prefilled Syringe Fill / Finish Services Market, Till 2035: Distribution by Type of Drug Molecule (USD Million)
- Figure 13.10 Prefilled Syringe Fill / Finish Services Market: Distribution by Therapeutic Area (USD Million)
- Figure 13.11 Prefilled Syringe Fill / Finish Services Market, Till 2035: Distribution by Syringe Barrel Material (USD Million)
- Figure 13.12 Prefilled Syringe Fill / Finish Services Market, Till 2035: Distribution by Number of Barrel Chambers (USD Million)
- Figure 14.1 Growth Opportunities for Prefilled Syringe Fill / Finish Service Providers
- Figure 14.2 Pipeline Distribution by Route of Administration
- Figure 14.3 FDA Approved Biologics and Biosimilars, Since 2014
- Figure 14.4 Approved Prefilled Syringe Combination Products: Cumulative Distribution by Approval Year
- Figure 14.5 Clinical Stage Prefilled Syringes Combination Products: Distribution by Phase of Development
- Figure 15.1 Prefilled Syringes: Distribution by Syringe Barrel Material
- Figure 15.2 Prefilled Syringes: Distribution by Number of Barrel Chambers
- Figure 15.3 Prefilled Syringes: Distribution by Type of Needle System
- Figure 15.4 Prefilled Syringes: Distribution by Barrel Volume
- Figure 15.5 Prefilled Syringe Developers: Distribution by Year of Establishment
- Figure 15.6 Prefilled Syringe Developers: Distribution by Location of Headquarters

