
PUBLISHER: Roots Analysis | PRODUCT CODE: 1762534

PUBLISHER: Roots Analysis | PRODUCT CODE: 1762534
Automated Cell Processing System Market: Industry Trends and Global Forecasts - Distribution by Cell Therapy Processing Step, Scale of Operation, End User and Key Geographical Regions
AUTOMATED CELL PROCESSING SYSTEM MARKET: OVERVIEW
As per Roots Analysis, the global automated cell processing system market valued at USD 220 million in the current year is projected to grow at a CAGR of 16% during the forecast period.
The market sizing and opportunity analysis has been segmented across the following parameters:
Cell Therapy Processing Step
- Apheresis
- Separation
- Expansion
- Harvest
- Fill / Finish
- Cryopreservation
- Thawing
Scale of Operation
- Pre-clinical / Clinical Operations
- Commercial Organizations
End User
- Hospitals / Medical Centers / Clinics / Research Institutes / Academic Institutes
- Cell Therapy Manufacturers / Developers
Key Geographical Regions
- North America
- Europe
- Asia-Pacific
- Latin America
- Middle East and North Africa
AUTOMATED CELL PROCESSING SYSTEM MARKET: GROWTH AND TRENDS
Recently there has been a rise in the number of cell therapies candidates, driven by numerous developmental breakthroughs in the biotechnology industry. In fact, more than 2,000 cell and gene therapy candidates are currently being investigated for the treatment of a myriad of disease indications. Further, the results of FDA approved therapies demonstrated the vast potential of cellular therapies in the treatment of oncological disorders, rare diseases, and chronic diseases. Thus, this therapeutic modality has garnered considerable attention from players engaged in the healthcare industry in the past few years. However, the conventional cell therapy manufacturing process is labor-intensive and time-consuming which results in high cost of production. Moreover, this manual process of cell therapy manufacturing leads to batch-to-batch variation. Consequently, there is an emerging and pressing need for more sophisticated and time efficient solutions for production.
Over the years, several advanced and innovative automation tools and technologies have been developed. These automated and closed cell processing systems have been demonstrated to hold the potential for significant reduction in the cost associated with the manufacturing of advanced cell therapies. One such automated system, namely GMP-In-A Box, offers several advantages, including increased throughput, decreased idle time between batch runs and reduced manual labor. Owing to such benefits of automation, the cell processing systems market is poised to witness lucrative growth in the coming future.
AUTOMATED CELL PROCESSING SYSTEM MARKET: KEY INSIGHTS
The report delves into the current state of the automated cell processing system market and identifies potential growth opportunities within industry. Some key findings from the report include:
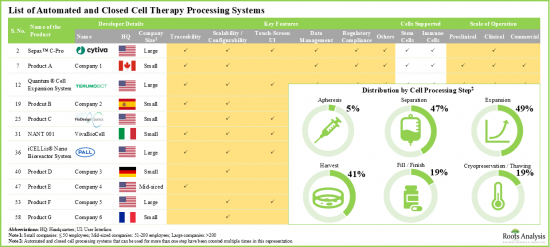
- Presently, over 60 innovative, automated and closed systems have been developed by different companies in order to automate various stages of cell therapy development, production, and cryopreservation.
- The market landscape is fragmented, featuring both established players and new entrants, engaged in developing novel technologies with distinct features, for processing cells across different scales of operation.
- Since 2010, many startups, focused on developing automated and closed cell processing systems, have been established; this upcoming domain has captured the interest of both big and small players.
- Majority of the available systems are compliant with the current regulatory requirements; examples include BATON, NANT 001, robotic cell culture systems and the volta loop.
- The increasing interest of stakeholders in this field is also reflected in the recent partnership activity; most recent deals are focused on novel technologies and involve the active participation of both international and indigenous players.
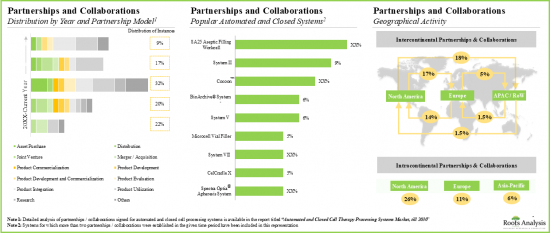
- The number of partnerships in this domain have increased at a CAGR of 24%; more than 70% of these partnerships have been signed since 2018.
- Several deals focused on utilization or integration of SA25 aseptic filling work cell (vanrx pharma systems) were signed for fill / finish of cell therapy products.
- In pursuit of a competitive advantage, equipment developers are presently focusing on the integration of advanced features into their respective products and affiliated offerings.
- An evaluation of more than 300+ stakeholders engaged in the development of cell therapies, including big pharma players, reveals several likely strategic partnership opportunities for equipment providers in this field.
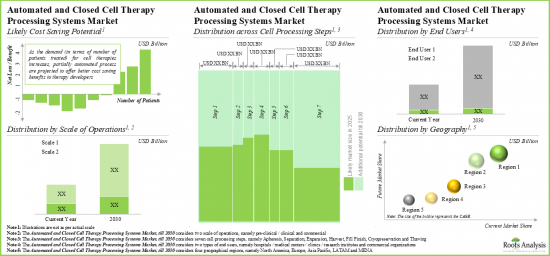
- Given their cost saving potential across different processing steps, we expect the automated and closed cell therapy systems market to grow at an annualized rate of 16% over the next decade.
Example Players in the Automated Cell Processing System Market
- AstraZeneca
- Baxter
- Bayer
- Cytiva (Acquired by Danaher Corporation)
- Cellular Therapeutics
- Lonza
- Merck
- Pall (Acquired by Danaher Corporation)
- Terumo BCT
- ThermoGenesis
AUTOMATED CELL PROCESSING SYSTEM MARKET: RESEARCH COVERAGE
- Market Sizing and Opportunity Analysis: The report features an in-depth analysis of the global automated cell processing system market, focusing on key market segments, including [A] cell therapy processing step, [B] scale of operation, [C] end user and [D] key geographical regions.
- Market Landscape: A comprehensive evaluation of the automated and closed systems, based on several relevant parameters, such as [A] cell therapy processing step, [B] their key features, [C] product specifications, [D] type of cells supported, [E] type of cell culture, [F] scale of operation, [G] application, [H] end users, [I] key support services offered and [J] regulatory certification / accreditations obtained.
- Product Competitiveness Analysis: A comprehensive competitive analysis of automated and closed systems, examining factors, such as [A] supplier power and [B] portfolio-related parameters.
- Company Profiles: In-depth profiles of key players that are engaged in offering automated and closed cell therapy processing systems, focusing on [A] overview of the company, [B] financial information (if available), [C] detailed description of the system(s) they offer and [D] recent developments and an informed future outlook.
- Partnerships and Collaborations: An insightful analysis of the deals inked by stakeholders in the automated cell processing system market, based on several parameters, such as [A] year of partnership, [B] type of partnership, [C] type of therapy, [D] type of cell processing step, [E] key automated and closed cell processing systems, [F] partner's focus area, [G] most active players (in terms of number of partnerships signed), and [H] geographical location of collaborators.
- Big Pharma Initiatives: A comprehensive evaluation of recent initiatives undertaken by big pharma players engaged in the automated cell processing system market.
KEY QUESTIONS ANSWERED IN THIS REPORT
- How many companies are currently engaged in this market?
- Which are the leading companies in this market?
- What factors are likely to influence the evolution of this market?
- What is the current and future market size?
- What is the CAGR of this market?
- How is the current and future market opportunity likely to be distributed across key market segments?
REASONS TO BUY THIS REPORT
- The report provides a comprehensive market analysis, offering detailed revenue projections of the overall market and its specific sub-segments. This information is valuable to both established market leaders and emerging entrants.
- Stakeholders can leverage the report to gain a deeper understanding of the competitive dynamics within the market. By analyzing the competitive landscape, businesses can make informed decisions to optimize their market positioning and develop effective go-to-market strategies.
- The report offers stakeholders a comprehensive overview of the market, including key drivers, barriers, opportunities, and challenges. This information empowers stakeholders to stay abreast of market trends and make data-driven decisions to capitalize on growth prospects.
ADDITIONAL BENEFITS
- Complimentary PPT Insights Packs
- Complimentary Excel Data Packs for all Analytical Modules in the Report
- 15% Free Content Customization
- Detailed Report Walkthrough Session with Research Team
- Free Updated report if the report is 6-12 months old or older
TABLE OF CONTENTS
1. PREFACE
- 1.1. Scope of the Report
- 1.2. Research Methodology
- 1.2.1. Research Assumptions
- 1.2.2. Project Methodology
- 1.2.3. Forecast Methodology
- 1.2.4. Robust Quality Control
- 1.2.5. Key Considerations
- 1.2.5.1. Demographics
- 1.2.5.2. Economic Factors
- 1.2.5.3. Government Regulations
- 1.2.5.4. Supply Chain
- 1.2.5.6. COVID Impact / Related Factors
- 1.2.5.7. Market Access
- 1.2.5.8. Healthcare Policies
- 1.2.5.9. Industry Consolidation
- 1.3 Key Questions Answered
- 1.4. Chapter Outlines
2. EXECUTIVE SUMMARY
3. INTRODUCTION
- 3.1. Context and Background
- 3.2. Cell Therapies
- 3.3. Cell Therapy Manufacturing
- 3.4. Key Challenges Associated with Manufacturing Cell Therapies
- 3.5. Overview of Automated and Closed Cell Processing Systems
- 3.5.1. Need for Automated and Closed Cell Processing in Cell Therapy Manufacturing
- 3.5.2. Advantages and Affiliated Challenges
- 3.6. Key Growth Drivers and Roadblocks
- 3.7. Recent Developments and Upcoming Trends
4. COMPETITIVE LANDSCAPE
- 4.1. Chapter Overview
- 4.2. Automated and Closed Cell Therapy Processing Systems: Overall Market Landscape
- 4.2.1. Analysis by Cell Processing Step
- 4.2.2. Analysis by Types of Cells
- 4.2.3. Analysis by Type of Culture
- 4.2.4. Analysis by Scale of Operation
- 4.2.5. Analysis by Key Features
- 4.2.6. Analysis by Application Area
- 4.2.7. Analysis by Regulatory Certifications / Accreditations
- 4.2.8. Analysis by End User
- 4.3. Automated and Closed Cell Therapy Processing Systems: Developer Landscape
- 4.3.1. Analysis by Year of Establishment
- 4.3.2. Analysis by Company Size
- 4.3.3. Analysis by Type of Support Service(s) Offered
- 4.3.4. Analysis by Location of Headquarters
5. PRODUCT COMPETITIVENESS ANALYSIS
- 5.1. Chapter Overview
- 5.2. Assumptions / Key Parameters
- 5.3. Methodology
- 5.4. Product Competitiveness Analysis
- 5.4.1. Automated and Closed Cell Processing Systems for Apheresis
- 5.4.2. Automated and Closed Cell Processing Systems for Separation
- 5.4.3. Automated and Closed Cell Processing Systems for Expansion
- 5.4.4. Automated and Closed Cell Processing Systems for Harvest
- 5.4.5. Automated and Closed Cell Processing Systems for Fill Finish
- 5.4.6. Automated and Closed Cell Processing Systems for Cryopreservation
- 5.4.7. Automated and Closed Cell Processing Systems for Thawing
6. COMPANY PROFILES
- 6.1. Chapter Overview
- 6.2. Cytiva
- 6.2.1. Company Overview
- 6.2.2. Product Portfolio
- 6.2.3. Recent Developments and Future Outlook
- 6.3. Pall
- 6.3.1. Company Overview
- 6.3.2. Product Portfolio
- 6.3.3. Recent Developments and Future Outlook
- 6.4. Terumo BCT
- 6.4.1. Company Overview
- 6.4.2. Product Portfolio
- 6.4.3. Financial Information
- 6.4.4. Recent Developments and Future Outlook
- 6.5 ThermoGenesis
- 6.5.1. Company Overview
- 6.5.2. Product Portfolio
- 6.5.3. Financial Information
- 6.5.4. Recent Developments and Future Outlook
7. PARTNERSHIPS
- 7.1. Chapter Overview
- 7.2. Partnership Models
- 7.3. Automated and Closed Cell Therapy Processing Systems: Recent Partnerships
- 7.3.1. Analysis by Year of Partnership
- 7.3.2. Analysis by Type of Partnership
- 7.3.3. Analysis by Type of Therapy
- 7.3.4. Analysis by Cell Processing Step
- 7.3.5. Analysis by Type of Automated and Closed Cell Processing Systems
- 7.3.6. Analysis by Partner's Focus Area
- 7.3.7. Most Active Players: Analysis by Number of Partnerships
- 7.3.8. Geographical Analysis
- 7.3.8.1. Country-Wise Distribution
- 7.3.8.2. Intercontinental and Intracontinental Agreements
8. BIG PHARMA INITIATIVES IN AUTOMATED AND CLOSED CELL THERAPY PROCESSING SYSTEMS DOMAIN
- 8.1. Chapter Overview
- 8.2. Initiatives Undertaken by Big Pharma Players
- 8.2.1. Initiatives Undertaken by AbbVie
- 8.2.2. Initiatives Undertaken by Bristol Myers Squibb
- 8.2.3. Initiatives Undertaken by Gilead Sciences
- 8.2.4. Initiatives Undertaken by GlaxoSmithKline
- 8.2.5. Initiatives Undertaken by Johnson & Johnson
- 8.2.6. Initiatives Undertaken by Novartis
- 8.2.7. Initiatives Undertaken by Roche
- 8.2.8. Initiatives Undertaken by Sanofi
- 8.2.9. Initiatives Undertaken by Takeda Pharmaceutical
- 8.2.10. Summary of Big Pharma Initiatives
9. LIKELY PARTNER
- 9.1. Chapter Overview
- 9.2. Scope and Methodology
- 9.3. Automated and Closed Cell Therapy Processing Systems: Potential Strategic Partners for Cell Therapy Development
- 9.3.1. Dendritic Cell Therapy
- 9.3.2. Stem Cell Therapy
- 9.3.3. T-cell Therapy
- 9.3.4. Natural Killer Cell Therapy
- 9.4. Automated and Closed Cell Therapy Processing Systems: Potential Strategic Partners for Cell Therapy Manufacturing
- 9.4.1. Dendritic Cell Therapy
- 9.4.2. Stem Cell Therapy,
- 9.4.3. T-cell Therapy
- 9.4.4. Natural Killer Cell Therapy
10. CASE STUDY: COST BENEFIT ANALYSIS USING PARTIALLY AUTOMATED AND FULLY AUTOMATED SYSTEMS
- 10.1. Chapter Overview
- 10.2. Comparative Analysis of Manual, Partially Automated and Fully Automated Cell Processing Systems
- 10.3. Likely Cost Saving Potential for Kymriah(R)
- 10.4. Likely Cost Saving Potential for Yescarata(R)
- 10.5. Cost Saving Potential of Fully Automated Processing Systems: Regional Trends
- 10.6. Concluding Remarks
11. MARKET SIZING AND OPPORTUNITY ANALYSIS
- 11.1. Chapter Overview
- 11.2. Key Assumptions and Methodology
- 11.3. Overall Automated and Closed Cell Therapy Processing Systems Market, Till 2035
- 11.3.1. Overall Automated and Closed Cell Therapy Processing Systems Market: Distribution by Cell Therapy Processing Step
- 11.3.1.1. Automated and Closed Cell Therapy Processing Systems Market for Apheresis, Till 2035
- 11.3.1.2. Automated and Closed Cell Therapy Processing Systems Market for Separation, Till 2035
- 11.3.1.3. Automated and Closed Cell Therapy Processing Systems Market for Expansion, Till 2035
- 11.3.1.4. Automated and Closed Cell Therapy Processing Systems Market for Harvest, Till 2035
- 11.3.1.5. Automated and Closed Cell Therapy Processing Systems Market for Fill / Finish, Till 2035
- 11.3.1.6. Automated and Closed Cell Therapy Processing Systems Market for Cryopreservation, Till 2035
- 11.3.1.7. Automated and Closed Cell Therapy Processing Systems Market for Thawing, Till 2035
- 11.3.2. Automated and Closed Cell Therapy Processing Systems Market: Distribution by Scale of Operation
- 11.3.2.1. Automated and Closed Cell Therapy Processing Systems Market for Pre-clinical / Clinical Operations, Till 2035
- 11.3.2.2. Automated and Closed Cell Therapy Processing Systems Market for Commercial Operations, Till 2035
- 11.3.3. Automated and Closed Cell Therapy Processing Systems Market: Distribution by End User
- 11.3.3.1. Automated and Closed Cell Therapy Processing Systems Market for Hospitals / Medical Centers / Clinics / Research Institutes / Academic Institutes, Till 2035
- 11.3.3.2. Automated and Closed Cell Therapy Processing Systems Market for Cell Therapy Manufacturers / Developers, Till 2035
- 11.3.4. Automated and Closed Cell Therapy Processing Systems Market: Distribution by Key Geographic Regions
- 11.3.4.1. Automated and Closed Cell Therapy Processing Systems Market in North America, Till 2035
- 11.3.4.2. Automated and Closed Cell Therapy Processing Systems Market in Europe, Till 2035
- 11.3.4.3. Automated and Closed Cell Therapy Processing Systems Market in Asia-Pacific, Till 2035
- 11.3.4.4. Automated and Closed Cell Therapy Processing Systems Market in Latin America (LATAM), Till 2035
- 11.3.4.5. Automated and Closed Cell Therapy Processing Systems Market in Middle East North America (MENA), Till 2035
- 11.3.1. Overall Automated and Closed Cell Therapy Processing Systems Market: Distribution by Cell Therapy Processing Step
12. CONCLUSION
- 12.1. Chapter Overview
- 12.2. Key Takeaways
13. INTERVIEW / SURVEY TRANSCRIPT(S)
14. APPENDIX 1: TABULATED DATA
15. APPENDIX 2: LIST OF COMPANIES AND ORGANIZATIONS
List of Tables
- Table 3.1. Cell and Advanced Therapies: Key Applications
- Table 3.2. Assessment of Key Cell Therapy Manufacturing Steps
- Table 4.1. List of Automated and Closed Cell Therapy Processing Systems: Information on Cell Processing Step
- Table 4.2. List of Automated and Closed Cell Therapy Processing Systems: Information on Types of Cells
- Table 4.3. List of Automated and Closed Cell Therapy Processing Systems: Information on Type of Culture
- Table 4.4. List of Automated and Closed Cell Therapy Processing Systems: Information on Scale of Operation
- Table 4.5. List of Automated and Closed Cell Therapy Processing Systems: Information on Key Features
- Table 4.6. List of Automated and Closed Cell Therapy Processing Systems: Information on Application Area
- Table 4.7. List of Automated and Closed Cell Therapy Processing Systems: Information on Regulatory Certifications / Accreditations Obtained
- Table 4.8. List of Automated and Closed Cell Therapy Processing Systems: Information on End Users
- Table 4.9. List of Automated and Closed Cell Therapy Processing System Providers
- Table 4.10. List of Automated and Closed Cell Therapy Processing System Providers: Information on Type of Support Service(s) Offered
- Table 6.1. Cytiva: Key Highlights
- Table 6.2. Cytiva: Product Portfolio
- Table 6.3. Pall: Key Highlights
- Table 6.4. Pall: Product Portfolio
- Table 6.5. Terumo BCT: Key Highlights
- Table 6.6. Terumo BCT: Product Portfolio
- Table 6.7. Terumo BCT: Recent Developments and Future Outlook
- Table 6.8. ThermoGenesis: Key Highlights
- Table 6.9. ThermoGenesis: Product Portfolio
- Table 6.10. ThermoGenesis: Recent Developments and Future Outlook
- Table 7.1. Automated and Closed Cell Processing Systems: List of Partnerships, Since 2016
- Table 8.1. Automated and Closed Cell Processing Systems: List of Big Pharma Players
- Table 9.1. Likely Partners for Automated and Closed Cell Therapy Processing System Providers: Dendritic Cell Therapy Developers
- Table 9.2. Likely Partners for Automated and Closed Cell Therapy Processing System Providers: Stem Cell Therapy Developers
- Table 9.3. Likely Partners for Automated and Closed Cell Therapy Processing System Providers: T-cell Therapy Developers
- Table 9.4. Likely Partners for Automated and Closed Cell Therapy Processing System Providers: Natural Killer Cell Therapy Developers
- Table 9.5. Likely Partners for Automated and Closed Cell Therapy Processing System Providers: Dendritic Cell Therapy Manufacturers
- Table 9.6. Likely Partners for Automated and Closed Cell Therapy Processing System Providers: Stem Cell Therapy Manufacturers
- Table 9.7. Likely Partners for Automated and Closed Cell Therapy Processing System Providers: T-cell Therapy Manufacturers
- Table 9.8. Likely Partners for Automated and Closed Cell Therapy Processing System Providers: Natural Killer Cell Therapy Manufacturers
- Table 10.1. Comparative Analysis of Manual, Partially Automated and Fully Automated Cell Processing Systems, Since 2020
- Table 10.2. Cost Saving Potential of Fully Automated Systems
- Table 14.1. Automated and Closed Cell Therapy Processing Systems: Distribution by Cell Processing Step
- Table 14.2. Automated and Closed Cell Therapy Processing Systems: Distribution by Types of Cells
- Table 14.3. Automated and Closed Cell Therapy Processing Systems: Distribution by Type of Culture
- Table 14.4. Automated and Closed Cell Therapy Processing Systems: Distribution by Scale of Operation
- Table 14.5. Automated and Closed Cell Therapy Processing Systems: Distribution by Key Features
- Table 14.6. Automated and Closed Cell Therapy Processing Systems: Distribution by Application Area
- Table 14.7. Automated and Closed Cell Therapy Processing Systems: Distribution by Regulatory Certifications / Accreditations
- Table 14.8. Automated and Closed Cell Therapy Processing Systems: Distribution by End Users
- Table 14.9. Automated and Closed Cell Therapy Processing System Providers: Distribution Year of Establishment
- Table 14.10. Automated and Closed Cell Therapy Processing System Providers: Distribution by Company Size
- Table 14.11. Automated and Closed Cell Therapy Processing System Providers: Distribution by Type of Support Services Offered
- Table 14.12. Automated and Closed Cell Therapy Processing System Providers: Distribution by Geographical Location
- Table 14.13. Automated and Closed Cell Therapy Processing System Providers: Distribution by Geographical Location (Country-Wise)
- Table 14.14. Leading Developers: Distribution by Number of Automated and Closed Cell Therapy Processing Systems
- Table 14.15. Terumo BCT: Annual Revenues, Since FY 2016
- Table 14.16. ThermoGenesis: Annual Revenues, Since FY 2016
- Table 14.17. Recent Partnerships: Cumulative Distribution by Year of Partnership
- Table 14.18. Recent Partnerships: Distribution by Type of Partnership Model Adopted
- Table 14.19. Recent Partnerships: Year-wise Trend by Type of Partnership Model Adopted
- Table 14.20. Recent Partnerships: Distribution by Type of Therapy
- Table 14.21. Recent Partnerships: Distribution by Type of Therapy and Type of Partnership Model Adopted
- Table 14.22. Recent Partnerships: Distribution by Cell Processing Step
- Table 14.23. Recent Partnerships: Distribution by Automated and Closed Cell Processing System
- Table 14.24. Recent Partnerships: Distribution by Type of Partner
- Table 14.25. Recent Partnerships: Distribution by Type of Cell Processing Step and Developer
- Table 14.26. Recent Partnerships: Most Active Players
- Table 14.27. Recent Partnerships: Country-Wise Distribution
- Table 14.28. Recent Partnerships: Intercontinental and Intracontinental Distribution
- Table 14.29. Big Pharma Initiatives Summary
- Table 14.30. Cost Saving Analysis: Comparative Analysis of Manual, Partially Automated and Fully Automated Processing Systems, Till 2035
- Table 14.31. Cost Saving Potential of Fully Automated Processing Systems Based on Number of Patients
- Table 14.32. Cost Saving Potential of Fully Automated Processing Systems Across Different Regions
- Table 14.33. Overall Automated and Closed Cell Therapy Processing Systems Market, Till 2035 (USD Million)
- Table 14.34. Automated and Closed Cell Therapy Processing Systems Market: Distribution by Cell Therapy Processing Step (USD Million)
- Table 14.35. Automated and Closed Cell Therapy Processing Systems Market: Share of Cell Apheresis Systems, Till 2035 (USD Million)
- Table 14.36. Automated and Closed Cell Therapy Processing Systems Market: Share of Cell Separation Systems, Till 2035 (USD Million)
- Table 14.37. Automated and Closed Cell Therapy Processing Systems Market: Share of Cell Expansion Systems, Till 2035 (USD Million)
- Table 14.38. Automated and Closed Cell Therapy Processing Systems Market: Share of Cell Harvesting Systems, Till 2035 (USD Million)
- Table 14.39. Automated and Closed Cell Therapy Processing Systems Market: Share of Fill Finish Systems, Till 2035 (USD Million)
- Table 14.40. Automated and Closed Cell Therapy Processing Systems Market: Share of Cryopreservation Systems, Till 2035 (USD Million)
- Table 14.41. Automated and Closed Cell Therapy Processing Systems Market: Share of Thawing Systems, Till 2035 (USD Million)
- Table 14.42. Automated and Closed Cell Therapy Processing Systems Market: Distribution by Scale of Operation (USD Million)
- Table 14.43. Automated and Closed Cell Therapy Processing Systems Market: Share of Preclinical / Clinical Scale Operations, Till 2035 (USD Million)
- Table 14.44. Automated and Closed Cell Therapy Processing Systems Market: Share of Commercial Operations, Till 2035 (USD Million)
- Table 14.45. Automated and Closed Cell Therapy Processing Systems Market: Distribution by End User (USD Million)
- Table 14.46. Automated and Closed Cell Therapy Processing Systems Market: Share of Hospitals / Medical Centers / Clinics / Research Institutes / Academic Institutes, Till 2035 (USD Million)
- Table 14.47. Automated and Closed Cell Therapy Processing Systems Market: Share of Commercial Organizations, Till 2035 (USD Million)
- Table 14.48. Automated and Closed Cell Therapy Processing Systems Market: Distribution by Key Geographical Regions (USD Million)
- Table 14.49. Automated and Closed Cell Therapy Processing Systems Market: Share of North America, Till 2035 (USD Million)
- Table 14.50. Automated and Closed Cell Therapy Processing Systems Market: Share of Europe, Till 2035 (USD Million)
- Table 14.51. Automated and Closed Cell Therapy Processing Systems Market: Share of Asia-Pacific, Till 2035 (USD Million)
- Table 14.52. Automated and Closed Cell Therapy Processing Systems Market: Share of LATAM, Till 2035 (USD Million)
- Table 14.53. Automated and Closed Cell Therapy Processing Systems Market: Share of MENA, Till 2035 (USD Million)
List of Figures
- Figure 3.1. Key Steps Involved in Manufacturing of Cell Therapies
- Figure 3.2. Key Considerations while Automating Cell Therapy Manufacturing Process
- Figure 3.3. Role of Automated and Closed Systems across Each Cell Therapy Processing Step
- Figure 3.4. Advantages offered by Automated and Closed Cell Processing Systems
- Figure 3.5. Challenges Associated with Automated and Closed Cell Processing Systems
- Figure 3.6. Growth Drivers and Roadblocks in the Automated and Closed Systems Market
- Figure 4.1. Automated and Closed Cell Therapy Processing Systems: Distribution by Cell Processing Step
- Figure 4.2. Automated and Closed Cell Therapy Processing Systems: Distribution by Types of Cells
- Figure 4.3. Automated and Closed Cell Therapy Processing Systems: Distribution by Type of Culture
- Figure 4.4. Automated and Closed Cell Therapy Processing Systems: Distribution by Scale of Operation
- Figure 4.5. Automated and Closed Cell Therapy Processing Systems: Distribution by Key Features
- Figure 4.6. Automated and Closed Cell Therapy Processing Systems: Distribution by Application Area
- Figure 4.7. Automated and Closed Cell Therapy Processing Systems: Distribution by Regulatory Certifications / Accreditations
- Figure 4.8. Automated and Closed Cell Therapy Processing Systems: Distribution by End Users
- Figure 4.9. Automated and Closed Cell Therapy Processing System Providers: Distribution by Year of Establishment
- Figure 4.10. Automated and Closed Cell Therapy Processing System Providers: Distribution by Company Size
- Figure 4.11. Automated and Closed Cell Therapy Processing System Providers: Distribution by Type of Support Services Offered
- Figure 4.12. Automated and Closed Cell Therapy Processing System Providers: Distribution by Geographical Location
- Figure 4.13. Automated and Closed Cell Therapy Processing System Providers: Distribution by Geographical Location (Country-Wise)
- Figure 4.14. Leading Developers: Distribution by Number of Automated and Closed Cell Therapy Processing Systems
- Figure 5.1. Product Competitiveness Analysis: Automated and Closed Systems for Cell Apheresis
- Figure 5.2. Product Competitiveness Analysis: Automated and Closed Systems for Cell Separation
- Figure 5.3. Product Competitiveness Analysis: Automated and Closed Systems for Cell Expansion
- Figure 5.4. Product Competitiveness Analysis: Automated and Closed Systems for Cell Harvesting
- Figure 5.5. Product Competitiveness Analysis: Automated and Closed Systems for Fill Finish
- Figure 5.6. Product Competitiveness Analysis: Automated and Closed Systems for Cryopreservation
- Figure 5.7. Product Competitiveness Analysis: Automated and Closed Systems for Thawing
- Figure 6.1. Terumo BCT: Annual Revenues, Since FY 2016
- Figure 6.2. ThermoGenesis: Annual Revenues, Since FY 2016
- Figure 7.1. Recent Partnerships: Cumulative Distribution by Year of Partnership
- Figure 7.2. Recent Partnerships: Distribution by Type of Partnership Model Adopted
- Figure 7.3. Recent Partnerships: Year-wise Trend by Type of Partnership Model Adopted
- Figure 7.4. Recent Partnerships: Distribution by Type of Therapy
- Figure 7.5. Recent Partnerships: Distribution by Type of Therapy and Type of Partnership Model Adopted
- Figure 7.6. Recent Partnerships: Distribution by Cell Processing Step
- Figure 7.7. Recent Partnerships: Distribution by Automated and Closed Cell Processing System
- Figure 7.8. Recent Partnerships: Distribution by Type of Partner
- Figure 7.9. Recent Partnerships: Distribution by Type of Cell Processing Step and Developer
- Figure 7.10. Recent Partnerships: Most Active Players
- Figure 7.11. Recent Partnerships: Country-Wise Distribution
- Figure 7.12. Recent Partnerships: Intercontinental and Intracontinental Distribution
- Figure 8.1. Big Pharma Initiatives Summary
- Figure 10.1. Cost Saving Analysis: Comparative Analysis of Manual, Partially Automated and Fully Automated Processing Systems, Till 2035
- Figure 10.2. Cost Saving Potential of Fully Automated Processing Systems Based on Number of Patients
- Figure 10.3. Cost Saving Potential of Fully Automated Processing Systems Across Different Regions
- Figure 11.1. Overall Automated and Closed Cell Therapy Processing Systems Market, Till 2035 (USD Million)
- Figure 11.2. Automated and Closed Cell Therapy Processing Systems Market: Distribution by Cell Therapy Processing Step (USD Million)
- Figure 11.3. Automated and Closed Cell Therapy Processing Systems Market: Share of Cell Apheresis Systems, Till 2035 (USD Million)
- Figure 11.4. Automated and Closed Cell Therapy Processing Systems Market: Share of Cell Separation Systems, Till 2035 (USD Million)
- Figure 11.5. Automated and Closed Cell Therapy Processing Systems Market: Share of Cell Expansion Systems, Till 2035 (USD Million)
- Figure 11.6. Automated and Closed Cell Therapy Processing Systems Market: Share of Cell Harvesting Systems, Till 2035 (USD Million)
- Figure 11.7. Automated and Closed Cell Therapy Processing Systems Market: Share of Fill Finish Systems, Till 2035 (USD Million)
- Figure 11.8. Automated and Closed Cell Therapy Processing Systems Market: Share of Cryopreservation Systems, Till 2035 (USD Million)
- Figure 11.9. Automated and Closed Cell Therapy Processing Systems Market: Share of Thawing Systems, Till 2035 (USD Million)
- Figure 11.10. Automated and Closed Cell Therapy Processing Systems Market: Distribution by Scale of Operation (USD Million)
- Figure 11.11. Automated and Closed Cell Therapy Processing Systems Market: Share of Preclinical / Clinical Scale Operations, Till 2035 (USD Million)
- Figure 11.12. Automated and Closed Cell Therapy Processing Systems Market: Share of Commercial Operations, Till 2035 (USD Million)
- Figure 11.13. Automated and Closed Cell Therapy Processing Systems Market: Distribution by End User (USD Million)
- Figure 11.14. Automated and Closed Cell Therapy Processing Systems Market: Share of Hospitals / Medical Centers / Clinics / Research Institutes / Academic Institutes, Till 2035 (USD Million)
- Figure 11.16. Automated and Closed Cell Therapy Processing Systems Market: Share of Commercial Organizations, Till 2035 (USD Million)
- Figure 11.17. Automated and Closed Cell Therapy Processing Systems Market: Distribution by Key Geographical Regions (USD Million)
- Figure 11.18. Automated and Closed Cell Therapy Processing Systems Market: Share of North America, Till 2035 (USD Million)
- Figure 11.19. Automated and Closed Cell Therapy Processing Systems Market: Share of Europe, Till 2035 (USD Million)
- Figure 11.20. Automated and Closed Cell Therapy Processing Systems Market: Share of Asia-Pacific, Till 2035 (USD Million)
- Figure 11.21. Automated and Closed Cell Therapy Processing Systems Market: Share of LATAM, Till 2035 (USD Million)
- Figure 11.22. Automated and Closed Cell Therapy Processing Systems Market: Share of MENA, Till 2035 (USD Million)

