
PUBLISHER: Roots Analysis | PRODUCT CODE: 1762540

PUBLISHER: Roots Analysis | PRODUCT CODE: 1762540
Cell Line Characterization and Cell Line Development Market: Industry Trends and Global Forecasts - Distribution by Source of Cell Line / Expression System, Application of Cell Line, Company Size and Key Geographical Regions
CELL LINE CHARACTERIZATION AND CELL LINE DEVELOPMENT MARKET: OVERVIEW
As per Roots Analysis, the global cell line characterization and cell line development market is estimated to grow from USD 2.29 billion in the current year to USD 8.38 billion by 2035, at a CAGR of 12.5% during the forecast period, till 2035.
The market sizing and opportunity analysis has been segmented across the following parameters:
Source of Cell Line / Expression System
- Mammalian
- Microbial
- Insect
- Others
Application of Cell Line
- Research and Development
- Biomanufacturing
Company Size
- Very Large
- Large
- Mid-sized
- Small
Key Geographical Regions
- North America
- Europe
- Asia Pacific
- Rest of the World
CELL LINE CHARACTERIZATION AND CELL LINE DEVELOPMENT MARKET: GROWTH AND TRENDS
Over the years, cell lines (cultured populations of cells) have become a crucial part of the biopharmaceutical industry. They are a valuable tool for screening potential drug candidates, developing biologics, studying biology of chronic diseases and assessing toxicity of drugs. Moreover, the developed cell lines can be characterized and authenticated to determine their origin / history and identify key characteristics and functionality. While most cell lines in use today are derived from humans, mice, and rats, some also originate from other mammalian and non-mammalian species, broadening their applicability across research and development.
Further, it is worth highlighting that over time the increasing advancements in genome editing technology have opened new avenues for cell line development. Despite this, the development and characterization of cell lines is both technically challenging and financially demanding; as a result, drug developers are becoming increasingly dependent on contract service providers for their advanced technologies, infrastructure and expertise. Recent years have witnessed the emergence of a large number of highly qualified contract research organizations (CROs) and contract manufacturing organizations (CMOs) that assist drug developers and strive to expedite cell line development and biomanufacturing.
CELL LINE CHARACTERIZATION AND CELL LINE DEVELOPMENT MARKET: KEY INSIGHTS
The report delves into the current state of the cell line characterization and cell line development market and identifies potential growth opportunities within industry. Some key findings from the report include:
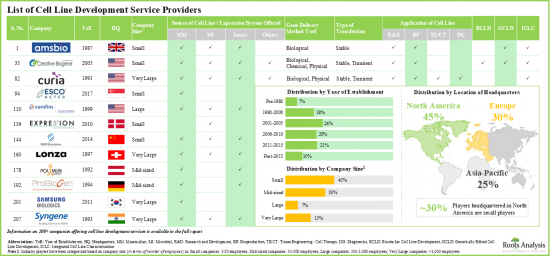
- Presently, over 200 players (established as well as startups) claim to have the necessary capabilities to offer cell line development services; majority of these firms are based in North America.
- Stakeholders have the capability to develop cell lines obtained from different sources that support cell-based research and development operations and facilitate production of biotherapeutics.
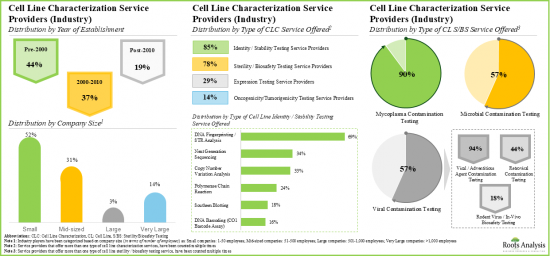
- Over 140 service providers (industry and non-industry) claim to offer cell line characterization services; a sizeable proportion of these players offer genotyping services for accessing the identity and stability of cell lines.
- Majority of the cell line characterization service providers are small and mid-sized firms, established post-2000; notably, around 10% of the players offer all types of characterization services
- In order to cater to the rising demand of novel biologics (developed using cell lines), service providers are upgrading their technical expertise and adding new competencies to augment their service portfolios.
- Both well-established players and new entrants have forged strategic partnerships; licensing agreements emerged as the most prominent partnership model.
- To keep pace with the growing demand for cell lines, companies have made significant investments to expand their facilities and capacities; this trend is most pronounced in the US and China.
- Identifying the driving factors (that fuel advancements) as well as barriers (that slow down the research progress) helps improve strategic planning and results in efficient operations.
- In the long term, cell line development services market is expected to witness growth of 12.5%; the opportunity is likely to be well distributed across different sources of cell lines, application areas and geographies.
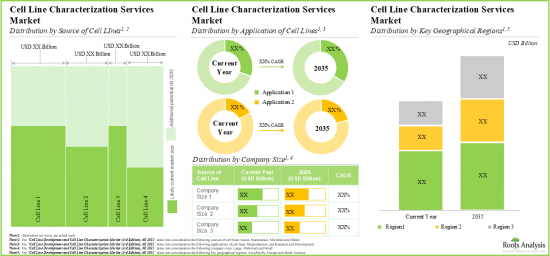
- As pharmaceutical companies and researchers continue outsourcing cell line characterization operations, we anticipate cell line characterization market to grow at an annualized rate of more than 10%, over the next decade.
CELL LINE CHARACTERIZATION AND CELL LINE DEVELOPMENT MARKET: KEY SEGMENTS
Mammalian Cell Line Segment holds the Largest Share of the Global Cell Line Characterization and Cell Line Development Market
Based on the source of cell line / expression system, the market is segmented into mammalian, microbial, insect, and others. At present, the mammalian cell line segment holds the maximum share of the global cell line characterization. This trend is likely to remain the same in the coming years.
By Application of Cell Line, Biomanufacturing is the Fastest Growing Segment of the Global Cell Line Characterization and Cell Line Development Market
Based on the application of cell line, the market is segmented into research and development and biomanufacturing. Currently, the biomanufacturing segment captures the highest proportion of the global cell line characterization and cell line development market. Further due to the growing need for high quality and authentic cell lines for experimental research, the opportunity for cell line application in research and development is anticipated to grow in the future.
Mid-sized Companies Segment Occupy the Largest Share of the Global Cell Line Characterization and Cell Line Development Market
Based on the company size, the market is segmented into very large, large, mid-sized, and small. At present, the mid-sized segment holds the maximum share of the global cell line characterization and cell line development market. Further this segment is expected to grow at a higher CAGR in the coming future.
North America Accounts for the Largest Share of the Market
Based on key geographical regions, the market is segmented into North America, Europe, Asia-Pacific and Rest of the World. Currently, North America dominates the global cell line characterization and cell line development market and accounts for the largest revenue share. Further, the market Asia-Pacific is likely to grow at a higher CAGR in the coming future.
Example Players in the Cell Line Characterization and Cell Line Development Market
- ATUM
- ATZ Labs (a subsidiary of Life Technologies)
- Avance Biosciences
- BioReliance (acquired by Sigma-Aldrich)
- Biovian
- Celonic Group
- Charles River Laboratories
- ChemPartner
- Cleancells
- Creative Biogene
- Curia
- Eurofins BioPharma Product Testing
- FUJIFILM Diosynth Biotechnologies
- Hylabs
- KBI Biopharma
- Kemp Proteins
- KMD Bioscience
- Livogen Pharmed
- Lonza
- Molecular Diagnostic Services
- Mycenax Biotech
- ProBioGen
- Samsung BioLogics
- Sartorius
- SGS Life Sciences
- Syngene International
- Texcell
- TFBS Bioscience
- Thermo Fisher Scientific
- WuXi Advanced Therapies
- WuXi Biologics
CELL LINE CHARACTERIZATION AND CELL LINE DEVELOPMENT MARKET: RESEARCH COVERAGE
- Market Sizing and Opportunity Analysis: The report features an in-depth analysis of the global cell line characterization and cell line development market, focusing on key market segments, including [A] source of cell line / expression system, [B] application of cell line, [C] company size and [D] key geographical regions.
- Cell Line Development Service Providers Market Landscape: A comprehensive evaluation of cell line development service providers, based on several relevant parameters, such as [A] year of establishment, [B] company size, [C] location of headquarters, [D] source of cell lines / expression systems offered, [E] gene delivery method used, [F] type of transfection, [G] availability of serum free / animal component free culturing capability, [H] type of cells offered, [I] application of cell lines, [J] additional cell line related services offered, [K] type of cell banking, [L] availability of integrated cell line characterization, [M] technology platform utilized, [N] monoclonality procedure used, [O] availability of biosimilar cell line development and [P] gene editing cell line development services.
- Cell Line Development Service Providers Company Competitiveness Analysis: A comprehensive competitive analysis of cell line development service providers, examining factors, such as [A] supplier strength and [B] service strength.
- Company Profiles of Cell Line Development Service Providers: In-depth profiles of key players offering cell line development services, focusing on [A] overview of the company, [B] financial information (if available), [C] service portfolio, [D] recent developments and an informed future outlook. Additionally, in-depth profiles of some other prominent players focusing on [E] overview of the company and [F] cell line development service portfolio.
- Cell Line Characterization Service Providers Market Landscape: A comprehensive evaluation of the companies / organizations providing cell line characterization services, based on several relevant parameters, such as [A] year of establishment, [B] company size, [C] location of headquarters, [D] source of cell lines and expression systems offered, [E] type of cell line characterization services offered, [F] type of cell identity testing / cell stability testing services offered, [G] type of sterility / biosafety testing services offered, [H] availability of additional cell line related services, [I] regulatory accreditations / certifications and [J] overall turnaround time. Additional information on [K] number of STR loci amplified, [L] type of genotyping kit used, and [M] service fee charged for non-industry players.
- Cell Line Characterization Service Providers Company Competitiveness Analysis: A comprehensive competitive analysis of cell line characterization service providers, examining factors, such as [A] supplier strength and [B] service strength.
- Company Profiles of Cell Line Characterization Service Providers: In-depth profiles of key players offering cell line characterization services, focusing on [A] overview of the company, [B] financial information (if available), [C] cell line characterization service portfolio, [D] recent developments and an informed future outlook. Additionally, in-depth profiles of some other prominent players focusing on [E] overview of the company and [F] cell line characterization service portfolio.
- Partnerships and Collaborations: An insightful analysis of the deals inked by stakeholders in this domain, based on several parameters, such as [A] year of partnership, [B] type of partnership, [C] type of cells involved, [D] therapeutic area, [E] type of partner, [F] most active players (in terms of the number of partnerships signed) and [G] regional distribution of the companies involved in these agreements.
- Recent Expansions: In-depth analysis of the various expansion initiatives undertaken by various cell line development and cell line characterization service providers, based on several parameters, such as [A] year of expansion, [B] type of expansion, [C] location of headquarters, [D] location of expanded facility, [E] area of expanded facility, [F] purpose of expansion, [G] most active players (in terms of number of recent expansions) and [H] geographical distribution.
- Cell Line Repositories: In-depth profiles of the biorepositories across the globe that play an important role in developing cell lines and have also undertaken initiatives to limit the use of contaminated and / or misidentified cell lines, focusing on [A] overview of the repository and [B] cell line characterization service portfolio.
- Regulatory Recommendations and Guidelines: A detailed discussion on the requirements established by various regulatory authorities, across different regions, related to characterization of cell lines. Additionally, a detailed discussion of the various guidelines that have been issued by these bodies related to the protocols that need to be followed while testing of cell lines. Further, a brief description of the historical overview and contributions of key institutes / organizations involved in this domain was represented.
- Market Impact Analysis: A thorough analysis of various factors, such as drivers, restraints, opportunities, and existing challenges that are likely to impact market growth.
KEY QUESTIONS ANSWERED IN THIS REPORT
- How many companies are currently engaged in this market?
- Which are the leading companies in this market?
- What factors are likely to influence the evolution of this market?
- What is the current and future market size?
- What is the CAGR of this market?
- How is the current and future market opportunity likely to be distributed across key market segments?
REASONS TO BUY THIS REPORT
- The report provides a comprehensive market analysis, offering detailed revenue projections of the overall market and its specific sub-segments. This information is valuable to both established market leaders and emerging entrants.
- Stakeholders can leverage the report to gain a deeper understanding of the competitive dynamics within the market. By analyzing the competitive landscape, businesses can make informed decisions to optimize their market positioning and develop effective go-to-market strategies.
- The report offers stakeholders a comprehensive overview of the market, including key drivers, barriers, opportunities, and challenges. This information empowers stakeholders to stay abreast of market trends and make data-driven decisions to capitalize on growth prospects.
ADDITIONAL BENEFITS
- Complimentary PPT Insights Packs
- Complimentary Excel Data Packs for all Analytical Modules in the Report
- 15% Free Content Customization
- Detailed Report Walkthrough Session with Research Team
- Free Updated report if the report is 6-12 months old or older
TABLE OF CONTENTS
1. PREFACE
- 1.1. Introduction
- 1.2. Project Objectives
- 1.3. Scope of the Report
- 1.4. Inclusions and Exclusions
- 1.5. Key Questions Answered
- 1.6. Chapter Outlines
2. RESEARCH METHODOLOGY
- 2.1. Chapter Overview
- 2.2. Research Assumptions
- 2.3. Project Methodology
- 2.4. Forecast Methodology
- 2.5. Robust Quality Control
- 2.6. Key Market Segmentations
- 2.7. Key Considerations
- 2.7.1. Demographics
- 2.7.2. Economic Factors
- 2.7.3. Government Regulations
- 2.7.4. Supply Chain
- 2.7.5. COVID Impact / Related Factors
- 2.7.6. Market Access
- 2.7.7. Healthcare Policies
- 2.7.8. Industry Consolidation
3. ECONOMIC AND OTHER PROJECT SPECIFIC CONSIDERATIONS
- 3.1. Chapter Overview
- 3.2. Market Dynamics
- 3.2.1. Time Period
- 3.2.1.1. Historical Trends
- 3.2.1.2. Current and Forecasted Estimates
- 3.2.2. Currency Coverage
- 3.2.2.1. Overview of Major Currencies Affecting the Market
- 3.2.2.2. Impact of Currency Fluctuations on the Industry
- 3.2.3. Foreign Exchange Impact
- 3.2.3.1. Evaluation of Foreign Exchange Rates and Their Impact on Market
- 3.2.3.2. Strategies for Mitigating Foreign Exchange Risk
- 3.2.4. Recession
- 3.2.4.1. Historical Analysis of Past Recessions and Lessons Learnt
- 3.2.4.2. Assessment of Current Economic Conditions and Potential Impact on the Market
- 3.2.5. Inflation
- 3.2.5.1. Measurement and Analysis of Inflationary Pressures in the Economy
- 3.2.5.2. Potential Impact of Inflation on the Market Evolution
- 3.2.1. Time Period
4. EXECUTIVE SUMMARY
5. INTRODUCTION
- 5.1. Chapter Overview
- 5.2. Overview of Cell Culture
- 5.2.1. Classification of Cell Cultures
- 5.2.1.1. Classification based on Origin
- 5.2.1.1.1. Primary Cell Cultures
- 5.2.1.1.2. Secondary Cell Cultures
- 5.2.1.2. Classification based on Growth Properties
- 5.2.1.2.1. Adherent Cell Cultures
- 5.2.1.2.2. Suspension Cell Cultures
- 5.2.1.1. Classification based on Origin
- 5.2.2. Classification of Cell Lines
- 5.2.2.1. Classification based on Lifespan of Cell Line
- 5.2.2.1.1. Finite Cell Lines
- 5.2.2.1.2. Continuous Cell Lines
- 5.2.2.2. Classification based on Type of Cell Line
- 5.2.2.2.1. Recombinant Cell Lines
- 5.2.2.2.2. Hybridoma Cell Lines
- 5.2.2.3. Classification based on Source of Cell Line
- 5.2.2.3.1. Mammalian Cell Lines
- 5.2.2.3.2. Non-Mammalian Cell lines
- 5.2.2.1. Classification based on Lifespan of Cell Line
- 5.2.1. Classification of Cell Cultures
- 5.3. Overview of Cell Line Characterization
- 5.3.1. Cell Line Characterization Methods
- 5.3.1.1. Identity / Stability Testing
- 5.3.1.1.1. Karyotype Analysis
- 5.3.1.1.2. Cytochrome C Oxidase I Barcoding Assay
- 5.3.1.1.3. Cell Morphology Analysis
- 5.3.1.1.4. DNA Analysis
- 5.3.1.2. Sterility / Biosafety Testing
- 5.3.1.2.1. Mycoplasma Contamination Testing
- 5.3.1.2.2. Viral Contamination Testing
- 5.3.1.1. Identity / Stability Testing
- 5.3.1. Cell Line Characterization Methods
- 5.4. Applications of Cell Lines
- 5.5. Key Concerns Associated with Cell Lines
- 5.6. Need for Outsourcing Cell Line Related Operations
- 5.7. Concluding Remarks
6. CELL LINE DEVELOPMENT SERVICE PROVIDERS: MARKET LANDSCAPE
- 6.1. Chapter Overview
- 6.2. Cell Line Development Service Providers: Overall Market Landscape
- 6.2.1. Analysis by Year of Establishment
- 6.2.2. Analysis by Company Size
- 6.2.3. Analysis by Location of Headquarters
- 6.2.4. Analysis by Company Size and Location of Headquarters
- 6.2.5. Analysis by Source of Cell Line / Expression System Offered
- 6.2.6. Analysis by Gene Delivery Method Used
- 6.2.7. Analysis by Type of Transfection
- 6.2.8. Analysis by Availability of Serum-Free / Animal Component Free Culturing Capability
- 6.2.9. Analysis by Type of Cells Offered
- 6.2.10. Analysis by Application of Cell Lines
- 6.2.11. Analysis by Additional Cell Line Related Services Offered
- 6.2.12. Analysis by Type of Cell Banking
- 6.2.13. Analysis by Availability of Integrated Cell Line Characterization Service
7. CELL LINE DEVELOPMENT SERVICE PROVIDERS: COMPANY COMPETITIVENESS ANALYSIS
- 7.1. Chapter Overview
- 7.2. Assumptions / Key Parameters
- 7.3. Methodology
- 7.4. Cell Line Development Service Providers: Company Competitiveness Analysis
- 7.4.1. Cell Line Development Service Providers in North America
- 7.4.2. Cell Line Development Service Providers in Europe
- 7.4.3. Cell Line Development Service Providers in Asia-Pacific
8. COMPANY PROFILES: CELL LINE DEVELOPMENT SERVICE PROVIDERS
- 8.1. Chapter Overview
- 8.2. Detailed Company Profiles of Leading Service Providers
- 8.2.1. ATUM
- 8.2.1.1. Company Overview
- 8.2.1.2. Cell Line Development Service Portfolio
- 8.2.1.3. Recent Developments and Future Outlook
- 8.2.2. Curia
- 8.2.2.1. Company Overview
- 8.2.2.2. Cell Line Development Service Portfolio
- 8.2.2.3. Recent Developments and Future Outlook
- 8.2.3. Fujifilm Diosynth Biotechnologies
- 8.2.3.1. Company Overview
- 8.2.3.2. Service Portfolio for Cell Line Development
- 8.2.3.3. Recent Developments and Future Outlook
- 8.2.4. Lonza
- 8.2.4.1. Company Overview
- 8.2.4.2. Cell Line Development Service Portfolio
- 8.2.4.3. Recent Developments and Future Outlook
- 8.2.5. Syngene International
- 8.2.5.1. Company Overview
- 8.2.5.2. Cell Line Development Service Portfolio
- 8.2.5.3. Recent Developments and Future Outlook
- 8.2.6. WuXi Biologics
- 8.2.6.1. Company Overview
- 8.2.6.2. Cell Line Development Service Portfolio
- 8.2.6.3. Recent Developments and Future Outlook
- 8.2.1. ATUM
- 8.3. Short Profiles of Other Prominent Service Providers
- 8.3.1. Biovian
- 8.3.1.1. Company Overview
- 8.3.1.2. Cell Line Development Service Portfolio
- 8.3.2. Celonic
- 8.3.2.1. Company Overview
- 8.3.2.2. Cell Line Development Service Portfolio
- 8.3.3. ChemPartner
- 8.3.3.1. Company Overview
- 8.3.3.2. Cell Line Development Service Portfolio
- 8.3.4. Creative Biogene
- 8.3.4.1. Company Overview
- 8.3.4.2. Cell Line Development Service Portfolio
- 8.3.5. KBI Biopharma
- 8.3.5.1. Company Overview
- 8.3.5.2. Cell Line Development Service Portfolio
- 8.3.6. Kemp Proteins
- 8.3.6.1. Company Overview
- 8.3.6.2. Cell Line Development Service Portfolio
- 8.3.7. KMD Bioscience
- 8.3.7.1. Company Overview
- 8.3.7.2. Cell Line Development Service Portfolio
- 8.3.8. Mycenax Biotech
- 8.3.8.1. Company Overview
- 8.3.8.2. Cell Line Development Service Portfolio
- 8.3.9. ProBioGen
- 8.3.9.1. Company Overview
- 8.3.9.2. Cell Line Development Service Portfolio
- 8.3.10. Thermo Fisher Scientific
- 8.3.10.1. Company Overview
- 8.3.10.2. Cell Line Development Service Portfolio
- 8.3.1. Biovian
9. CELL LINE CHARACTERIZATION SERVICE PROVIDERS: MARKET LANDSCAPE
- 9.1. Chapter Overview
- 9.2. Cell Line Characterization Service Providers: Overall Market Landscape
- 9.2.1. Cell Line Characterization Service Providers Service Providers (Industry Players)
- 9.2.1.1. Analysis by Year of Establishment
- 9.2.1.2. Analysis by Company Size
- 9.2.1.3. Analysis by Location of Headquarters
- 9.2.1.4. Analysis by Location of Headquarters and Company Size
- 9.2.1.5. Analysis by Cell line Characterized
- 9.2.1.6. Analysis by Type of Cell Line Characterization Service Offered
- 9.2.1.6.1. Analysis by Type of Cell Line Identity / Stability Testing Service Offered
- 9.2.1.6.2. Analysis by Type of Cell Line Sterility / Biosafety Testing Service Offered
- 9.2.2. Cell Line Characterization Service Providers (Non-Industry Players)
- 9.2.2.1. Analysis by Location of Organization
- 9.2.2.2. Analysis by Types of Cell Line Characterized
- 9.2.2.3. Analysis by Type of Cell Line Characterization Service Offered
- 9.2.2.4. Analysis by Genotyping Kit Used
- 9.2.2.5. Analysis by Number of Loci Amplified
- 9.2.1. Cell Line Characterization Service Providers Service Providers (Industry Players)
10. CELL LINE CHARACTERIZATION SERVICE PROVIDERS: COMPANY COMPETITIVENESS ANALYSIS
- 10.1. Chapter Overview
- 10.2. Assumptions / Key Parameters
- 10.3. Methodology
- 10.4. Cell Line Characterization Service Providers: Company Competitiveness Analysis
- 10.4.1. Cell Line Characterization Service Providers in North America
- 10.4.2. Cell Line Characterization Service Providers in Europe
- 10.4.3. Cell Line Characterization Service Providers in Asia-Pacific
11. COMPANY PROFILES: CELL LINE CHARACTERIZATION SERVICE PROVIDERS
- 11.1. Chapter Overview
- 11.2. Detailed Company Profiles of Leading Service Provider
- 11.2.1 Charles River Laboratories
- 11.2.1.1. Company Overview
- 11.2.1.2. Cell Line Characterization Service Portfolio
- 11.2.1.3. Recent Developments and Future Outlook
- 11.2.2. Eurofins BioPharma Product Testing
- 11.2.2.1. Company Overview
- 11.2.2.2. Cell Line Characterization Service Portfolio
- 11.2.2.3. Recent Developments and Future Outlook
- 11.2.3. Livogen Pharmed
- 11.2.3.1. Company Overview
- 11.2.3.2. Cell Line Characterization Service Portfolio
- 11.2.3.3. Recent Developments and Future Outlook
- 11.2.4. Molecular Diagnostic Services
- 11.2.4.1. Company Overview
- 11.2.4.2. Cell Line Characterization Service Portfolio
- 11.2.4.3. Recent Developments and Future Outlook
- 11.2.5. Sartorius
- 11.2.5.1. Company Overview
- 11.2.5.2. Cell Line Characterization Service Portfolio
- 11.2.5.3. Recent Developments and Future Outlook
- 11.2.6. TFBS Bioscience
- 11.2.6.1. Company Overview
- 11.2.6.2. Cell Line Characterization Service Portfolio
- 11.2.6.3. Recent Developments and Future Outlook
- 11.2.1 Charles River Laboratories
- 11.3. Short Profiles of Other Prominent Service Providers
- 11.3.1. ATZ Labs (Subsidiary of Life Technologies)
- 11.3.1.1. Company Overview
- 11.3.1.2. Cell Line Characterization Service Portfolio
- 11.3.2. Avance Biosciences
- 11.3.2.1. Company Overview
- 11.3.2.2. Cell Line Characterization Service Portfolio
- 11.3.3. BioReliance
- 11.3.3.1. Company Overview
- 11.3.3.2. Cell Line Characterization Service Portfolio
- 11.3.4. Clean Cells
- 11.3.4.1. Company Overview
- 11.3.4.2. Cell Line Characterization Service Portfolio
- 11.3.5. hylabs
- 11.3.5.1. Company Overview
- 11.3.5.2. Cell Line Characterization Service Portfolio
- 11.3.6. Samsung Biologics
- 11.3.6.1. Company Overview
- 11.3.6.2. Cell Line Characterization Service Portfolio
- 11.3.7. SGS Life Sciences
- 11.3.7.1. Company Overview
- 11.3.7.2. Cell Line Characterization Service Portfolio
- 11.3.8. Texcell
- 11.3.8.1. Company Overview
- 11.3.8.2. Cell Line Characterization Service Portfolio
- 11.3.9. WuXi Advanced Therapies
- 11.3.9.1. Company Overview
- 11.3.9.2. Cell Line Characterization Service Portfolio
- 11.3.1. ATZ Labs (Subsidiary of Life Technologies)
12. PARTNERSHIPS AND COLLABORATIONS
- 12.1. Chapter Overview
- 12.2. Partnership Models
- 12.3. Cell Line Development and Characterization: Partnerships and Collaborations
- 12.3.1. Analysis by Year of Partnership
- 12.3.2. Analysis by Type of Partnership
- 12.3.3. Analysis by Year and Type of Partnership
- 12.3.4. Analysis by Type of Partner
- 12.3.5. Most Active Players: Analysis by Number of Partnerships
- 12.3.6. Analysis by Geography
- 12.3.6.1. Intracontinental and Intercontinental Deals
- 12.3.6.2. International and Local Deals
13. RECENT EXPANSIONS
- 13.1. Chapter Overview
- 13.2. Cell Line Development and Characterization: List of Recent Expansions
- 13.2.1. Analysis by Year of Expansion
- 13.2.2. Analysis by Type of Expansion
- 13.2.3. Analysis by Year and Type of Expansion
- 13.2.4. Analysis by Location of Headquarters and Company Size
- 13.2.5. Analysis by Location of Expanded Facility
- 13.2.6. Analysis by Type of Expansion and Location of Expanded Facility
- 13.2.7. Analysis by Area of Expanded Facility (sq ft)
- 13.2.8. Analysis by Purpose of Expansion
- 13.2.9. Analysis by Geography
- 13.2.10. Most Active Players: Analysis by Number of Recent Expansions
14. CELL LINE REPOSITORIES
- 14.1. Chapter Overview
- 14.2. American Type Culture Collection (ATCC)
- 14.2.1. Overview
- 14.2.2. Service Portfolio
- 14.3. Coriell Institute for Medical Research
- 14.3.1. Overview
- 14.3.2. Service Portfolio
- 14.4. European Collection of Authenticated Cell Cultures (ECACC)
- 14.4.1. Overview
- 14.4.2. Service Portfolio
- 14.5. Leibniz Institute DSMZ - German Collection of Microorganisms and Cell Cultures
- 14.5.1. Overview
- 14.5.2. Service Portfolio
- 14.6. National Centre for Cell Science (NCCS)
- 14.6.1. Overview
- 14.6.2. Service Portfolio
15. REGULATORY RECOMMENDATIONS AND GUIDELINES
- 15.1. Chapter Overview
- 15.2. Cell Line Authentication: Prominent Regulatory Authorities
- 15.2.1. Role of American Type Culture Collection (ATCC)
- 15.2.2. Role of International Cell Line Authentication Committee (ICLAC)
- 15.2.3. Role of Global Biological Standards Institute (GBSI)
- 15.3. Guidelines Issued by International Regulatory Agencies
- 15.3.1. World Health Organization
- 15.3.2. The International Council for Harmonization of Technical Requirements for Pharmaceuticals for Human Use (ICH)
- 15.4. Regulatory Guidelines for Cell Line Characterization in the US
- 15.4.1. Food and Drug Administration
- 15.4.1.1. FDA Points to Consider
- 15.4.1.2. US Pharmacopeial Convention
- 15.4.1.3. US Code for Federal Regulations
- 15.4.1. Food and Drug Administration
- 15.5. Regulatory Guidelines for Cell Line Characterization in Europe
- 15.5.1. European Medicines Agency
- 15.6. Regulatory Guidelines for Cell Line Characterization In Japan
- 15.6.1. Ministry of Health, Labor and Welfare
- 15.7. Concluding Remarks
16. MARKET IMPACT ANALYSIS: DRIVERS, RESTRAINTS, OPPORTUNITIES AND CHALLENGES
- 16.1. Chapter Overview
- 16.2. Market Drivers
- 16.3. Market Restraints
- 16.4. Market Opportunities
- 16.5. Market Challenges
- 16.6. Conclusion
17. GLOBAL CELL LINE DEVELOPMENT SERVICES MARKET
- 17.1. Chapter Overview
- 17.2. Assumptions and Methodology
- 17.3. Global Cell Line Development Services Market, Historical Trends (Since 2019) and Forecasted Estimates (Till 2035)
- 17.3.1. Scenario Analysis
- 17.3.1.1. Conservative Scenario
- 17.3.1.2. Optimistic Scenario
- 17.3.1. Scenario Analysis
- 17.4. Key Market Segmentations
18. CELL LINE DEVELOPMENT SERVICES MARKET, BY SOURCE OF CELL LINES
- 18.1. Chapter Overview
- 18.2. Key Assumptions and Methodology
- 18.3. Cell Line Development Services Market: Distribution by Source of Cell Lines
- 18.3.1. Cell Line Development Services Market for Mammalian Cell Lines: Historical Trends (Since 2019) and Forecasted Estimates (Till 2035)
- 18.3.2. Cell Line Development Services Market for Microbial Cell Lines: Historical Trends (Since 2019) and Forecasted Estimates (Till 2035)
- 18.3.3. Cell Line Development Services Market for Insect Cell Lines: Historical Trends (Since 2019) and Forecasted Estimates (Till 2035)
- 18.3.4. Cell Line Development Services Market for Other Cell Lines: Historical Trends (Since 2019) and Forecasted Estimates (Till 2035)
- 18.4. Data Triangulation and Validation
19. CELL LINE DEVELOPMENT SERVICES MARKET, BY APPLICATION OF CELL LINES
- 19.1. Chapter Overview
- 19.2. Key Assumptions and Methodology
- 19.3. Cell Line Development Services Market: Distribution by Application of Cell Lines
- 19.3.1. Cell Line Development Services Market for Biomanufacturing: Historical Trends (Since 2019) and Forecasted Estimates (Till 2035)
- 19.3.2. Cell Line Development Services Market for Research and Development Operations: Historical Trends (Since 2019) and Forecasted Estimates (Till 2035)
- 19.4. Data Triangulation and Validation
20. CELL LINE DEVELOPMENT SERVICES MARKET, BY COMPANY SIZE
- 20.1. Chapter Overview
- 20.2. Key Assumptions and Methodology
- 20.3. Cell Line Development Services Market: Distribution by Company Size
- 20.3.1. Cell Line Development Services Market for Large Companies: Historical Trends (Since 2019) and Forecasted Estimates (Till 2035)
- 20.3.2. Cell Line Development Services Market for Mid-sized Companies: Historical Trends (Since 2019) and Forecasted Estimates (Till 2035)
- 20.3.3. Cell Line Development Services Market for Small Companies: Historical Trends (Since 2019) and Forecasted Estimates (Till 2035)
- 20.4. Data Triangulation and Validation
21. CELL LINE DEVELOPMENT SERVICES MARKET, BY KEY GEOGRAPHICAL REGIONS
- 21.1. Chapter Overview
- 21.2. Key Assumptions and Methodology
- 21.3. Cell Line Development Services Market: Distribution by Company Size
- 21.3.1. Cell Line Development Services Market for North America: Historical Trends (Since 2019) and Forecasted Estimates (Till 2035)
- 21.3.2. Cell Line Development Services Market for Europe: Historical Trends (Since 2019) and Forecasted Estimates (Till 2035)
- 21.3.3. Cell Line Development Services Market for Asia-Pacific and Rest of the World: Historical Trends (Since 2019) and Forecasted Estimates (Till 2035)
- 21.4. Data Triangulation and Validation
22. GLOBAL CELL LINE CHARACTERIZATION SERVICES MARKET
- 22.1. Chapter Overview
- 22.2. Assumptions and Methodology
- 22.3. Global Cell Line Characterization Services Market, Historical Trends (Since 2019) and Forecasted Estimates (Till 2035)
- 22.3.1. Scenario Analysis
- 22.3.1.1. Conservative Scenario
- 22.3.1.2. Optimistic Scenario
- 22.3.1. Scenario Analysis
- 22.4. Key Market Segmentations
23. CELL LINE CHARACTERIZATION SERVICES MARKET, BY SOURCE OF CELL LINES
- 23.1. Chapter Overview
- 23.2. Key Assumptions and Methodology
- 23.3. Cell Line Characterization Services Market: Distribution by Source of Cell Lines
- 23.3.1. Cell Line Characterization Services Market for Mammalian Cell Lines: Historical Trends (Since 2019) and Forecasted Estimates (Till 2035)
- 23.3.2. Cell Line Characterization Services Market for Microbial Cell Lines: Historical Trends (Since 2019) and Forecasted Estimates (Till 2035)
- 23.3.3. Cell Line Characterization Services Market for Insect Cell Lines: Historical Trends (Since 2019) and Forecasted Estimates (Till 2035)
- 23.3.4. Cell Line Characterization Services Market for Other Cell Lines: Historical Trends (Since 2019) and Forecasted Estimates (Till 2035)
- 23.4. Data Triangulation and Validation
24. CELL LINE CHARACTERIZATION SERVICES MARKET, BY APPLICATION OF CELL LINES
- 24.1. Chapter Overview
- 24.2. Key Assumptions and Methodology
- 24.3. Cell Line Characterization Services Market: Distribution by Application of Cell Lines
- 24.3.1. Cell Line Characterization Services Market for Biomanufacturing: Historical Trends (Since 2019) and Forecasted Estimates (Till 2035)
- 24.3.2. Cell Line Characterization Services Market for Research and Development Operations: Historical Trends (Since 2019) and Forecasted Estimates (Till 2035)
- 24.4. Data Triangulation and Validation
25. CELL LINE CHARACTERIZATION SERVICES MARKET, BY COMPANY SIZE
- 25.1. Chapter Overview
- 25.2. Key Assumptions and Methodology
- 25.3. Cell Line Characterization Services Market: Distribution by Company Size
- 25.3.1. Cell Line Characterization Services Market for Large Companies: Historical Trends (Since 2019) and Forecasted Estimates (Till 2035)
- 25.3.2. Cell Line Characterization Services Market for Mid-sized Companies: Historical Trends (Since 2019) and Forecasted Estimates (Till 2035)
- 25.3.3. Cell Line Characterization Services Market for Small Companies: Historical Trends (Since 2019) and Forecasted Estimates (Till 2035)
- 25.4. Data Triangulation and Validation
26. CELL LINE CHARACTERIZATION SERVICES MARKET, BY KEY GEOGRAPHICAL REGIONS
- 26.1. Chapter Overview
- 26.2. Key Assumptions and Methodology
- 26.3. Cell Line Characterization Services Market: Distribution by Key Geographical Regions
- 26.3.1. Cell Line Characterization Services Market for North America: Historical Trends (Since 2019) and Forecasted Estimates (Till 2035)
- 26.3.2. Cell Line Characterization Services Market for Europe: Historical Trends (Since 2019) and Forecasted Estimates (Till 2035)
- 26.3.3. Cell Line Characterization Services Market for Asia-Pacific and Rest of the World: Historical Trends (Since 2019) and Forecasted Estimates (Till 2035)
- 26.4. Data Triangulation and Validation
27. CONCLUDING REMARKS
28. EXECUTIVE INSIGHTS
- 28.1. Chapter Overview
- 28.2. Company A
- 28.2.1. Company Snapshot
- 28.2.2. Interview Transcript, Chief Executive Officer
- 28.3. Company B
- 28.3.1. Company Snapshot
- 28.3.2. Interview Transcript, Principal Scientist and Head of R&D
- 28.4. Company C
- 28.4.1. Company Snapshot
- 28.4.2. Interview Transcript, Director of Business Development and Marketing
- 28.5. Company D
- 28.5.1. Company Snapshot
- 28.5.2. Interview Transcript, Founder and President
- 28.6. Company E
- 28.6.1. Company Snapshot
- 28.6.2. Interview Transcript, President
- 28.7. Company F
- 28.7.1. Company Snapshot
- 28.7.2. Interview Transcript, Chief Scientific Officer
- 28.8. Company G
- 28.8.1. Company Snapshot
- 28.8.2. Interview Transcript, Former Vice President BioProcessing
- 28.9. Company H
- 28.9.1. Company Snapshot
- 28.9.2. Interview Transcript, Founder and Managing Director
- 28.10. Company I
- 28.10.1. Company Snapshot
- 28.10.2. Interview Transcript, Client Relations Manager
- 28.11. Company J
- 28.11.1. Company Snapshot
- 28.11.2. Interview Transcript, Former Business Development Manager
29. APPENDIX 1: TABULATED DATA
30. APPENDIX 2: LIST OF COMPANIES AND ORGANIZATIONS
31. APPENDIX 3: DETAILS OF PARTNERSHIPS AND COLLABORATIONS
List of Tables
- Table 5.1 Comparison between Finite and Continuous Cell Lines
- Table 5.2 Popular Mammalian Cell Lines used in Biopharmaceutical Production
- Table 5.3 Human Cell Lines and Therapeutic Protein Products
- Table 5.4 Cell Lines and Viral Vaccine Products
- Table 6.1 Cell Line Development: List of Service Providers
- Table 6.2 Cell Line Development Service Providers: Information on Source of Cell Line / Expression System Offered, Gene Delivery Method Used and Type of Transfection
- Table 6.3 Cell Line Development Service Providers: Information on Availability Serum free / Animal Component Free Culturing Capability, Types of Cells Offered and Applications of Cell Lines
- Table 6.4 Cell Line Development Service Providers: Information on Additional Cell Line Related Services Offered, Type of Cell Banking and Integrated Cell Line Characterization Service
- Table 6.5 Cell Line Development Service Providers: Information on Technology/Cell Line / Vectors / Expression System Used (if available), Availability of Monoclonality Procedure, Availability of Biosimilar Cell Line Development Service and Availability of Genetically Edited Cell Line Development Service
- Table 8.1 Cell Line Development Service Providers: List of Companies Profiled
- Table 8.2 ATUM: Company Snapshot
- Table 8.3 ATUM: Cell Line Development Service Portfolio
- Table 8.4 ATUM: Recent Developments and Future Outlook
- Table 8.5 Curia: Company Snapshot
- Table 8.6 Curia: Cell Line Development Service Portfolio
- Table 8.7 Curia: Recent Developments and Future Outlook
- Table 8.8 FUJIFILM Diosynth Biotechnologies: Company Snapshot
- Table 8.9 FUJIFILM Diosynth Biotechnologies: Cell Line Development Service Portfolio
- Table 8.10 FUJIFILM Diosynth Biotechnologies: Recent Developments and Future Outlook
- Table 8.11 Lonza: Company Snapshot
- Table 8.12 Lonza: Cell Line Development Service Portfolio
- Table 8.13 Lonza: Recent Developments and Future Outlook
- Table 8.14 Syngene International: Company Snapshot
- Table 8.15 Syngene International: Cell Line Development Service Portfolio
- Table 8.16 Syngene International: Recent Developments and Future Outlook
- Table 8.17 WuXi Biologics: Company Snapshot
- Table 8.18 WuXi Biologics: Cell Line Development Service Portfolio
- Table 8.19 WuXi Biologics: Recent Developments and Future Outlook
- Table 8.20 Biovian: Company Snapshot
- Table 8.21 Biovian: Cell Line Development Service Portfolio
- Table 8.22 Celonic: Company Snapshot
- Table 8.23 Celonic: Cell Line Development Service Portfolio
- Table 8.24 ChemPartner: Company Snapshot
- Table 8.25 ChemPartner: Cell Line Development Service Portfolio
- Table 8.26 Creative Biogene: Company Snapshot
- Table 8.27 Creative Biogene: Cell Line Development Service Portfolio
- Table 8.28 KBI Biopharma: Company Snapshot
- Table 8.29 KBI Biopharma: Cell Line Development Service Portfolio
- Table 8.30 Kemp Proteins: Company Snapshot
- Table 8.31 Kemp Proteins: Cell Line Development Service Portfolio
- Table 8.32 KMD Bioscience: Company Snapshot
- Table 8.33 KMD Bioscience: Cell Line Development Service Portfolio
- Table 8.34 Mycenax Biotech: Company Snapshot
- Table 8.35 Mycenax Biotech: Cell Line Development Service Portfolio
- Table 8.36 ProBioGen: Company Snapshot
- Table 8.37 ProBioGen: Cell Line Development Service Portfolio
- Table 8.38 Thermo Fisher Scientific: Company Snapshot
- Table 8.39 Thermo Fisher Scientific: Cell Line Development Service Portfolio
- Table 9.1 Cell Line Characterization: List of Service Providers (Industry Players)
- Table 9.2 Cell line Development Service Providers: Information on Cell Line Characterized and Type of Cell Line Characterization Services Offered
- Table 9.3 Cell Line Characterization Service Providers: Information on Type of Cell Line Identity/ Stability Testing Services Offered and Type of Cell Line Sterility / Biosafety Testing Services Offered
- Table 9.4 Cell line Characterization Service Providers: Information on Regulatory Compliance Regulatory Accreditations /Certifications Overall Turnaround Time, and Availability of Additional Cell Line Related Services
- Table 9.5 Cell Line Characterization: List of Service Providers (Non-Industry Players)
- Table 9.6 Cell Line Characterization Service Providers: Information on Type of Cell Line Characterization Service Offered and Type of Genotyping Services Offered
- Table 9.7 Cell Line Characterization Service Providers: Information on Genotyping Kit Used, Number of Loci Amplified, Service Charges and Overall Turnaround Time
- Table 11.1 Cell Line Characterization Service Providers: List of Companies Profiled
- Table 11.2 Charles River Laboratories: Company Snapshot
- Table 11.3 Charles River laboratories: Cell Line Characterization Service Portfolio
- Table 11.4 Charles River Laboratories: Recent Developments and Future Outlook
- Table 11.5 Eurofins BioPharma Product Testing: Company Snapshot
- Table 11.6 Eurofins BioPharma Product Testing: Cell Line Characterization Service Portfolio
- Table 11.7 Eurofins BioPharma Product Testing: Recent Developments and Future Outlook
- Table 11.8 Livogen Pharmed: Company Snapshot
- Table 11.9 Livogen Pharmed: Cell Line Characterization Service Portfolio
- Table 11.10 Molecular Diagnostic Services: Company Snapshot
- Table 11.11 Molecular Diagnostic Services: Cell Line Characterization Service Portfolio
- Table 11.12 Sartorius: Company Snapshot
- Table 11.13 Sartorius: Cell Line Characterization Service Portfolio
- Table 11.14 Sartorius: Recent Developments and Future Outlook
- Table 11.15 TFBS Bioscience: Company Snapshot
- Table 11.16 TFBS Bioscience: Cell Line Characterization Service Portfolio
- Table 11.17 TFBS Bioscience: Recent Developments and Future Outlook
- Table 11.18 ATZ Labs: Company Snapshot
- Table 11.19 ATZ Labs: Cell Line Characterization Service Portfolio
- Table 11.20 Avance Biosciences: Company Snapshot
- Table 11.21 Avance Biosciences: Cell Line Characterization Service Portfolio
- Table 11.22 BioReliance: Company Snapshot
- Table 11.23 BioReliance: Cell Line Characterization Service Portfolio
- Table 11.24 Clean Cells: Company Snapshot
- Table 11.25 Clean Cells: Cell Line Characterization Service Portfolio
- Table 11.26 Hylabs: Company Snapshot
- Table 11.27 Hylabs: Cell Line Characterization Service Portfolio
- Table 11.28 Samsung Biologics: Company Snapshot
- Table 11.29 Samsung Biologics: Cell Line Characterization Service Portfolio
- Table 11.30 SGS Life Sciences: Company Snapshot
- Table 11.31 SGS Life Sciences: Cell Line Characterization Service Portfolio
- Table 11.32 Texcell: Company Snapshot
- Table 11.33 Texcell: Cell Line Characterization Service Portfolio
- Table 11.34 WuXi Advanced Therapies: Company Snapshot
- Table 11.35 WuXi Advanced Therapies: Cell Line Characterization Service Portfolio
- Table 12.1 Cell Line Development and Characterization: List of Partnerships and Collaborations, Since 2019
- Table 13.1 Cell Line Development and Characterization Services: List of Recent Expansions, Since 2019
- Table 15.1 List of Journals with Mandatory Requirement of Cell Line Authentication for Research Submissions
- Table 15.2 International Cell Line Authentication Committee (ICLAC): Partner Organizations
- Table 15.3 WHO Recommendations: Cell Bank Characterization
- Table 15.4 Regulatory Documents for Cell Line Characterization in the US
- Table 15.5 US Pharmacopoeia (USP) 1050: Virus Testing in Cell Banks
- Table 15.6 European Pharmacopoeias: Testing in Cell Banks
- Table 28.1 Biofortuna: Company Snapshot
- Table 28.2 Abgenex: Company Snapshot
- Table 28.3 GTP Bioways: Company Snapshot
- Table 28.4 QuaCell Biotechnology: Company Snapshot
- Table 28.5 Laragen: Company Snapshot
- Table 28.6 Polpharma Biologics: Company Snapshot
- Table 28.7 LakePharam (Acquired by Curia): Company Snapshot
- Table 28.8 ARTES Biotechnology: Company Snapshot
- Table 28.9 ImmunoPrecise Antibodies (Formerly Modiquest): Company Snapshot
- Table 28.10 Polpharma Biologics: Company Snapshot
- Table 29.1 Cell Line Development Service Providers: Distribution by Year of Establishment
- Table 29.2 Cell Line Development Service Providers: Distribution by Company Size
- Table 29.3 Cell Line Development Service Providers: Distribution by Location of Headquarters
- Table 29.4 Cell Line Development Service Providers: Distribution by Company Size and Location of Headquarters
- Table 29.5 Cell Line Development Service Providers: Distribution by Source of Cell Line / Expression System Offered
- Table 29.6 Cell Line Development Service Providers: Distribution by Gene Delivery Method Used
- Table 29.7 Cell Line Development Service Providers: Distribution by Type of Transfection
- Table 29.8 Cell Line Development Service Providers: Distribution by Availability of Serum-Free /Animal Component Free Culturing Capability
- Table 29.9 Cell Line Development Service Providers: Distribution by Type of Cells Offered
- Table 29.10 Cell Line Development Service Providers: Distribution by Application of Cell Lines
- Table 29.11 Cell Line Development Service Providers: Distribution by Additional Cell Line Related Services Offered
- Table 29.12 Cell Line Development Service Providers: Distribution by Type of Cell Banking
- Table 29.13 Cell Line Development Service Providers: Distribution by Availability of Integrated Cell Line Characterization Service
- Table 29.14 Cell Line Characterization Service Providers: Overall Market Landscape
- Table 29.15 Cell Line Characterization Service Providers (Industry): Distribution by Year of Establishment
- Table 29.16 Cell Line Characterization Service Providers (Industry): Distribution by Company Size
- Table 29.17 Cell Line Characterization Service Providers (Industry): Distribution by Location of Headquarters
- Table 29.18 Cell Line Characterization Service Providers (Industry): Distribution by Company Size and Location of Headquarters
- Table 29.19 Cell Line Characterization Service Providers (Industry): Distribution by Cell Line Characterized
- Table 29.20 Cell Line Characterization Service Providers (Industry): Distribution by Type of Cell Line Characterization Services Offered
- Table 29.21 Cell Line Characterization Service Providers (Industry): Distribution by Type of Cell Line Identity / Stability Testing Service Offered
- Table 29.22 Cell Line Characterization Service Providers (Industry): Distribution by Type of Cell Line Sterility / Biosafety Testing Service Offered
- Table 29.23 Cell Line Characterization Service Providers (Non-Industry): Distribution by Location of Organization
- Table 29.24 Cell Line Characterization Service Providers (Non-Industry): Distribution by Type of Cell Line Characterized
- Table 29.25 Cell Line Characterization Service Providers (Non-Industry): Distribution by Type of Cell Line Characterization Service Offered
- Table 29.26 Cell Line Characterization Service Providers (Non-Industry): Distribution by Genotyping Kit Used
- Table 29.27 Cell Line Characterization Service Providers (Non-Industry): Distribution by Number of Loci Amplified
- Table 29.28 Partnerships and Collaborations: Cumulative Year-wise Trend, Since 2015
- Table 29.29 Partnerships and Collaborations: Distribution by Type of Partnership
- Table 29.30 Partnerships and Collaborations: Distribution by Year and Type of Partnership
- Table 29.31 Partnerships and Collaborations: Distribution by Type of Partner
- Table 29.32 Most Active Players: Distribution by Number of Partnerships
- Table 29.33 Partnerships and Collaborations: Distribution by Intracontinental and Intercontinental Deals
- Table 29.34 Partnerships and Collaborations: Local and International Deals
- Table 29.35 Recent Expansions: Cumulative Year-wise Trend, Since 2023
- Table 29.36 Recent Expansions: Distribution by Type of Expansion
- Table 29.37 Recent Expansions: Distribution by Year and Type of Expansion
- Table 29.38 Recent Expansions: Distribution by Location of Headquarters and Company Size
- Table 29.39 Recent Expansions: Distribution by Location of Expanded Facility
- Table 29.40 Recent Expansions: Distribution by Type of Expansion and Location of Expanded Facility
- Table 29.41 Recent Expansions: Distribution by Area of Expanded Facility (sq. ft.)
- Table 29.42 Recent Expansions: Distribution by Purpose of Expansion
- Table 29.43 Recent Expansions: Analysis by Geography
- Table 29.44 Most Active Players: Distribution by Number of Recent Expansions
- Table 29.45 Global Cell Line Development Services Market, Historical Trends (Since 2019) (USD Million)
- Table 29.46 Global Cell Line Development Services Market, Forecasted Estimates (Till 2035), Conservative, Base and Optimistic Scenario (USD Million)
- Table 29.47 Cell Line Development Services Market: Distribution by Source of Cell Line (USD Million)
- Table 29.48 Cell Line Development Services Market for Mammalian Cell Lines: Historical Trends (Since 2019) (USD Million)
- Table 29.49 Cell Line Development Services Market for Mammalian Cell Lines: Forecasted Estimates (Till 2035), Conservative, Base and Optimistic Scenario (USD Million)
- Table 29.50 Cell Line Development Services Market for Microbial Cell Lines: Historical Trends (Since 2019) (USD Million)
- Table 29.51 Cell Line Development Services Market for Microbial Cell Lines: Forecasted Estimates (Till 2035), Conservative, Base and Optimistic Scenario (USD Million)
- Table 29.52 Cell Line Development Services Market for Insect Cell Lines: Historical Trends (Since 2019) (USD Million)
- Table 29.53 Cell Line Development Services Market for Insect Cell Lines: Forecasted Estimates (Till 2035), Conservative, Base and Optimistic Scenario (USD Million)
- Table 29.54 Cell Line Development Services Market for Other Cell Lines: Historical Trends (Since 2019) (USD Million)
- Table 29.55 Cell Line Development Services Market for Other Cell Lines: Forecasted Estimates (Till 2035), Conservative, Base and Optimistic Scenario (USD Million)
- Table 29.56 Cell Line Development Services Market: Distribution by Application of Cell Line (USD Million)
- Table 29.57 Cell Line Development Services Market for Biomanufacturing: Historical Trends (Since 2019) (USD Million)
- Table 29.58 Cell Line Development Services Market for Biomanufacturing: Forecasted Estimates (Till 2035), Conservative, Base and Optimistic Scenario (USD Million)
- Table 29.59 Cell Line Development Services Market for Research and Development Operations: Historical Trends (Since 2019) (USD Million)
- Table 29.60 Cell Line Development Services Market for Research and Development Operations: Forecasted Estimates (Till 2035), Conservative, Base and Optimistic Scenario (USD Million)
- Table 29.61 Cell Line Development Services Market: Distribution by Company Size (USD Million)
- Table 29.62 Cell Line Development Services Market for Large Companies: Historical Trends (Since 2019) (USD Million)
- Table 29.63 Cell Line Development Services Market for Large Companies: Forecasted Estimates (Till 2035), Conservative, Base and Optimistic Scenario (USD Million)
- Table 29.64 Cell Line Development Services Market for Mid-Size Companies: Historical Trends (Since 2019) (USD Million)
- Table 29.65 Cell Line Development Services Market for Mid-sized Companies: Forecasted Estimates (Till 2035), Conservative, Base and Optimistic Scenario (USD Million)
- Table 29.66 Cell Line Development Services Market for Small Companies: Historical Trends (Since 2019) (USD Million)
- Table 29.67 Cell Line Development Services Market for Small Companies: Forecasted Estimates (Till 2035), Conservative, Base and Optimistic Scenario (USD Million)
- Table 29.68 Cell Line Development Services Market: Distribution by Key Geographical Regions (USD Million)
- Table 29.69 Cell Line Development Services Market for North America: Historical Trends (Since 2019) (USD Million)
- Table 29.70 Cell Line Development Services Market for North America: Forecasted Estimates (Till 2035), Conservative, Base and Optimistic Scenario (USD Million)
- Table 29.71 Cell Line Development Services Market for Europe: Historical Trends (Since 2019) (USD Million)
- Table 29.72 Cell Line Development Services Market for Europe: Forecasted Estimates (Till 2035), Conservative, Base and Optimistic Scenario (USD Million)
- Table 29.73 Cell Line Development Services Market for Asia-Pacific and Rest of the World: Historical Trends (Since 2019) (USD Million)
- Table 29.74 Cell Line Development Services Market for Asia-Pacific and Rest of the World: Forecasted Estimates (Till 2035), Conservative, Base and Optimistic Scenario (USD Million)
- Table 29.75 Global Cell Line Characterization Services Market, Historical Trends (Since 2019) (USD Million)
- Table 29.76 Global Cell Line Characterization Services Market, Forecasted Estimates (Till 2035), Conservative, Base and Optimistic Scenario (USD Million)
- Table 29.77 Cell Line Characterization Services Market: Distribution by Source of Cell Line (USD Million)
- Table 29.78 Cell Line Characterization Services Market for Mammalian Cell Lines: Historical Trends (Since 2019) (USD Million)
- Table 29.79 Cell Line Characterization Services Market for Mammalian Cell Lines: Forecasted Estimates (Till 2035), Conservative, Base and Optimistic Scenario (USD Million)
- Table 29.80 Cell Line Characterization Services Market for Microbial Cell Lines: Historical Trends (Since 2019) (USD Million)
- Table 29.81 Cell Line Characterization Services Market for Microbial Cell Lines: Forecasted Estimates (Till 2035), Conservative, Base and Optimistic Scenario (USD Million)
- Table 29.82 Cell Line Characterization Services Market for Insect Cell Lines: Historical Trends (Since 2019) (USD Million)
- Table 29.83 Cell Line Characterization Services Market for Insect Cell Lines: Forecasted Estimates (Till 2035), Conservative, Base and Optimistic Scenario (USD Million)
- Table 29.84 Cell Line Characterization Services Market for Other Cell Lines: Historical Trends (Since 2019) (USD Million)
- Table 29.85 Cell Line Characterization Services Market for Other Cell Lines: Forecasted Estimates (Till 2035), Conservative, Base and Optimistic Scenario (USD Million)
- Table 29.86 Cell Line Characterization Services Market: Distribution by Application of Cell Line (USD Million)
- Table 29.87 Cell Line Characterization Services Market for Biomanufacturing: Historical Trends (Since 2019) (USD Million)
- Table 29.88 Cell Line Characterization Services Market for Biomanufacturing: Forecasted Estimates (Till 2035), Conservative, Base and Optimistic Scenario (USD Million)
- Table 29.89 Cell Line Characterization Services Market for Research and Development Operations: Historical Trends (Since 2019) (USD Million)
- Table 29.90 Cell Line Characterization Services Market for Research and Development Operations: Forecasted Estimates (Till 2035), Conservative, Base and Optimistic Scenario (USD Million)
- Table 29.91 Cell Line Characterization Services Market: Distribution by Company Size (USD Million)
- Table 29.92 Cell Line Characterization Services Market for Large Companies: Historical Trends (Since 2019) (USD Million)
- Table 29.93 Cell Line Characterization Services Market for Large Companies: Forecasted Estimates (Till 2035), Conservative, Base and Optimistic Scenario (USD Million)
- Table 29.94 Cell Line Characterization Services Market for Mid-Size Companies: Historical Trends (Since 2019) (USD Million)
- Table 29.95 Cell Line Characterization Services Market for Mid-sized Companies: Forecasted Estimates (Till 2035), Conservative, Base and Optimistic Scenario (USD Million)
- Table 29.96 Cell Line Characterization Services Market for Small Companies: Historical Trends (Since 2019) (USD Million)
- Table 29.97 Cell Line Characterization Services Market for Small Companies: Forecasted Estimates (Till 2035), Conservative, Base and Optimistic Scenario (USD Million)
- Table 29.98 Cell Line Characterization Services Market: Distribution by Key Geographical Regions (USD Million)
- Table 29.99 Cell Line Characterization Services Market for North America: Historical Trends (Since 2019) (USD Million)
- Table 29.100 Cell Line Characterization Services Market for North America: Forecasted Estimates (Till 2035), Conservative, Base and Optimistic Scenario (USD Million)
- Table 29.101 Cell Line Characterization Services Market for Europe: Historical Trends (Since 2019) (USD Million)
- Table 29.102 Cell Line Characterization Services Market for Europe: Forecasted Estimates (Till 2035), Conservative, Base and Optimistic Scenario (USD Million)
- Table 29.103 Cell Line Characterization Services Market for Asia-Pacific and Rest of the World: Historical Trends (Since 2019) (USD Million)
- Table 29.104 Cell Line Characterization Services Market for Asia-Pacific and Rest of the World: Forecasted Estimates (Till 2035), Conservative, Base and Optimistic Scenario (USD Million)
List of Figures
- Figure 2.1 Research Methodology: Research Assumptions
- Figure 2.2 Research Methodology: Project Methodology
- Figure 2.3 Research Methodology: Forecast Methodology
- Figure 2.4 Research Methodology: Robust Quality Control
- Figure 2.5 Research Methodology: Key Market Segmentations
- Figure 4.1 Executive Summary: Cell Line Development Service Providers Market Landscape
- Figure 4.2 Executive Summary: Cell Line Characterization Service Providers Market Landscape
- Figure 4.3 Executive Summary: Partnership and Collaborations
- Figure 4.4 Executive Summary: Recent Expansions
- Figure 4.5 Executive Summary: Cell line Development Service Providers Market Sizing and Opportunity Analysis
- Figure 4.6 Executive Summary: Cell line Characterization Service Providers Market Sizing and Opportunity Analysis
- Figure 5.1 Process of Cell Culturing
- Figure 5.2 Initiation of Cell Cultures
- Figure 5.3 Sources of Non-Mammalian Cell Lines
- Figure 5.4 Karyotype Preparation: Process Workflow
- Figure 5.5 DNA Hybridization: Process Workflow
- Figure 5.6 DNA Fingerprinting: Process Workflow
- Figure 5.7 Applications of Cell Lines
- Figure 5.8 Factors Affecting the Quality of Cell Lines
- Figure 5.9 Advantages and Risks Associated with Outsourcing of Cell Line Related Operations
- Figure 6.1 Cell Line Development Service Providers: Distribution by Year of Establishment
- Figure 6.2 Cell Line Development Service Providers: Distribution by Company Size
- Figure 6.3 Cell Line Development Service Providers: Distribution by Location of Headquarters
- Figure 6.4 Cell Line Development Service Providers: Distribution by Company Size and Location of Headquarters
- Figure 6.5 Cell Line Development Service Providers: Distribution by Source of Cell Line / Expression System Offered
- Figure 6.6 Cell Line Development Service Providers: Distribution by Gene Delivery Method Used
- Figure 6.7 Cell Line Development Service Providers: Distribution by Type of Transfection
- Figure 6.8 Cell Line Development Service Providers: Distribution by Availability of Serum-Free / Animal Component Free Culturing Capability
- Figure 6.9 Cell Line Development Service Providers: Distribution by Type of Cells Offered
- Figure 6.10 Cell Line Development Service Providers: Distribution by Application of Cell Line
- Figure 6.11 Cell Line Development Service Providers: Distribution by Additional Cell Line Related Services Offered
- Figure 6.12 Cell Line Development Service Providers: Distribution by Type of Cell Banking
- Figure 6.13 Cell Line Development Service Providers: Distribution by Availability of Integrated Cell Line Characterization Service
- Figure 7.1 Company Competitiveness Analysis: Cell Line Development Service Providers in North America
- Figure 7.2 Company Competitiveness Analysis: Cell Line Development Service Providers in Europe
- Figure 7.3 Company Competitiveness Analysis: Cell Line Development Service Providers in Asia-Pacific and rest of the world
- Figure 9.1 Cell Line Characterization Service Providers: Overall Market Landscape
- Figure 9.2 Cell Line Characterization Service Providers (Industry): Distribution by Year of Establishment
- Figure 9.3 Cell Line Characterization Service Providers (Industry): Distribution by Company Size
- Figure 9.4 Cell Line Characterization Service Providers (Industry): Distribution by Location of Headquarters
- Figure 9.5 Cell Line Characterization Service Providers (Industry): Distribution by Company Size and Location of Headquarters
- Figure 9.6 Cell Line Characterization Service Providers (Industry): Distribution by Cell Line Characterized
- Figure 9.7 Cell Line Characterization Service Providers (Industry): Distribution by Type of Cell Line Characterization Service Offered
- Figure 9.8 Cell Line Characterization Service Providers (Industry): Distribution by Type of Cell Line Identity / Stability Testing Service Offered
- Figure 9.9 Cell Line Characterization Service Providers (Industry): Distribution by Type of Cell Line Sterility / Biosafety Testing Service Offered
- Figure 9.10 Cell Line Characterization Service Providers (Non-Industry): Distribution by Location of Organization
- Figure 9.11 Cell Line Characterization Service Providers (Non-Industry): Distribution by Type of Cell Line Characterized
- Figure 9.12 Cell Line Characterization Service Providers (Non-Industry): Distribution by Type of Cell Line Characterization Service Offered
- Figure 9.13 Cell Line Characterization Service Providers (Non-Industry): Distribution by Genotyping Kit Used
- Figure 9.14 Cell Line Characterization Service Providers (Non-Industry): Distribution by Number of Loci Amplified
- Figure 10.1 Company Competitiveness Analysis: Cell Line Development Service Providers in North America
- Figure 10.2 Company Competitiveness Analysis: Cell Line Development Service Providers in Europe
- Figure 10.3 Company Competitiveness Analysis: Cell Line Development Service Providers in Asia-Pacific and rest of the world
- Figure 12.1 Partnerships and Collaborations: Cumulative Year-wise Trend, Since 2015
- Figure 12.2 Partnerships and Collaborations: Distribution by Type of Partnership
- Figure 12.3 Partnerships and Collaborations: Distribution by Year and Type of Partnership
- Figure 12.4 Partnerships and Collaborations: Distribution by Type of Partner
- Figure 12.5 Most Active Players: Distribution by Number of Partnerships
- Figure 12.6 Partnerships and Collaborations: Intracontinental and Intercontinental Deals
- Figure 12.7 Partnerships and Collaborations: International and Local Deals
- Figure 13.1 Recent Expansions: Cumulative Year-wise Trend, Since 2023
- Figure 13.2 Recent Expansions: Distribution by Type of Expansion
- Figure 13.3 Recent Expansions: Distribution by Year and Type of Expansion
- Figure 13.4 Recent Expansions: Distribution by Location of Headquarters and Company Size
- Figure 13.5 Recent Expansions: Distribution by Location of Expanded Facility
- Figure 13.6 Recent Expansions: Distribution by Type of Expansion and Location of Expanded Facility
- Figure 13.7 Recent Expansions: Distribution by Area of Expanded Facility (sq. ft.)
- Figure 13.8 Recent Expansions: Distribution by Purpose of Expansion
- Figure 13.9 Recent Expansions: Distribution by Geography
- Figure 13.10 Most Active Players: Distribution by Number of Recent Expansions
- Figure 14.1 American Type Culture Collection (ATCC): Service Portfolio
- Figure 14.2 Coriell Institute for Medical Research: Service Portfolio
- Figure 14.3 European Collection of Authenticated Cell Cultures (ECACC): Culture Collection
- Figure 14.4 European Collection of Authenticated Cell Cultures (ECACC): Service Portfolio
- Figure 14.5 Leibniz Institute DSMZ: Biological Material Collection
- Figure 14.6 National Centre for Cell Science (NCCS): Service Portfolio
- Figure 15.1 The International Council for Harmonisation Q5A (R1) Guidelines: Cell Bank Qualification
- Figure 15.2 The International Council for Harmonisation Q5D Guidelines: Cell Bank Characterization
- Figure 15.3 FDA Guidelines: Cell Bank Qualification
- Figure 15.4 US Pharmacopoeia (USP) 63: Mycoplasma Detection in Cell Banks
- Figure 15.5 Code for Federal Regulations (CFR) 610.18: Recommendations for Testing of Cell Lines
- Figure 16.1 Market Drivers
- Figure 16.2 Market Restrainers
- Figure 16.3 Market Opportunities
- Figure 16.4 Market Challenges
- Figure 17.1 Global Cell Line Development Services Market, Historical Trends (Since 2019) and Forecasted Estimates (Till 2035) (USD Million)
- Figure 17.2 Global Cell Line Development Services Market, 2023-2035, Optimistic Scenario (USD Million)
- Figure 17.3 Global Cell Line Development Services Market, 2023-2035, Conservative Scenario (USD Million)
- Figure 18.1 Cell Line Development Services Market: Distribution by Source of Cell Lines
- Figure 18.2 Cell Line Development Services Market for Mammalian Cell Lines: Historical Trends (Since 2019) and Forecasted Estimates (Till 2035) (USD Million)
- Figure 18.3 Cell Line Development Services Market for Microbial Cell Lines: Historical Trends (Since 2019) and Forecasted Estimates (Till 2035) (USD Million)
- Figure 18.4 Cell Line Development Services Market for Insect Cell Lines: Historical Trends (Since 2019) and Forecasted Estimates (Till 2035) (USD Million)
- Figure 18.5 Cell Line Development Services Market for Other Cell Lines: Historical Trends (Since 2019) and Forecasted Estimates (Till 2035) (USD Million)
- Figure 19.1 Cell Line Development Services Market: Distribution by Application of Cell Line
- Figure 19.2 Cell Line Development Services Market for Biomanufacturing: Historical Trends (Since 2019) and Forecasted Estimates (Till 2035) (USD Million)
- Figure 19.3 Cell Line Development Services Market for Research and Development Operations: Historical Trends (Since 2019) and Forecasted Estimates (Till 2035) (USD Million)
- Figure 20.2 Cell Line Development Services Market for Large Companies: Historical Trends (Since 2019) and Forecasted Estimates (Till 2035) (USD Million)
- Figure 20.3 Cell Line Development Services Market for Mid-sized Companies: Historical Trends (Since 2019) and Forecasted Estimates (Till 2035) (USD Million)
- Figure 20.4 Cell Line Development Services Market for Small Companies: Historical Trends (Since 2019) and Forecasted Estimates (Till 2035) (USD Million)
- Figure 21.1 Cell Line Development Services Market: Distribution by Key Geographical Regions
- Figure 21.2 Cell Line Development Services Market for North America: Historical Trends (Since 2019) and Forecasted Estimates (Till 2035) (USD Million)
- Figure 21.3 Cell Line Development Services Market for Europe: Historical Trends (Since 2019) and Forecasted Estimates (Till 2035) (USD Million)
- Figure 21.4 Cell Line Development Services Market for Asia-Pacific and Rest of the World: Historical Trends (Since 2019) and Forecasted Estimates (Till 2035) (USD Million)
- Figure 22.1 Global Cell Line Characterization Services Market, Historical Trends (Since 2019) and Forecasted Estimates (Till 2035) (USD Million)
- Figure 22.2 Global Cell Line Characterization Services Market, 2023-2035, Optimistic Scenario (USD Million)
- Figure 22.3 Global Cell Line Characterization Services Market, 2023-2035, Conservative Scenario (USD Million)
- Figure 23.1 Cell Line Characterization Services Market: Distribution by Source of Cell Line
- Figure 23.2 Cell Line Characterization Services Market for Mammalian Cell Lines: Historical Trends (Since 2019) and Forecasted Estimates (Till 2035) (USD Million)
- Figure 23.3 Cell Line Characterization Services Market for Microbial Cell Lines: Historical Trends (Since 2019) and Forecasted Estimates (Till 2035) (USD Million)
- Figure 23.4 Cell Line Characterization Services Market for Insect Cell Lines: Historical Trends (Since 2019) and Forecasted Estimates (Till 2035) (USD Million)
- Figure 23.5 Cell Line Characterization Services Market for Other Cell Lines: Historical Trends (Since 2019) and Forecasted Estimates (Till 2035) (USD Million)
- Figure 24.1 Cell Line Characterization Services Market: Distribution by Application of Cell Line
- Figure 24.2 Cell Line Characterization Services Market for Biomanufacturing: Historical Trends (Since 2019) and Forecasted Estimates (Till 2035) (USD Million)
- Figure 24.3 Cell Line Characterization Services Market for Research and Characterization Operations: Historical Trends (Since 2019) and Forecasted Estimates (Till 2035) (USD Million)
- Figure 25.1 Cell Line Characterization Services Market: Distribution by Company Size
- Figure 25.2 Cell Line Characterization Services Market for Large Companies: Historical Trends (Since 2019) and Forecasted Estimates (Till 2035) (USD Million)
- Figure 25.3 Cell Line Characterization Services Market for Mid-sized Companies: Historical Trends (Since 2019) and Forecasted Estimates (Till 2035) (USD Million)
- Figure 25.4 Cell Line Characterization Services Market for Small Companies: Historical Trends (Since 2019) and Forecasted Estimates (Till 2035) (USD Million)
- Figure 26.1 Cell Line Characterization Services Market: Distribution by Key Geographical Regions
- Figure 26.2 Cell Line Characterization Services Market for North America: Historical Trends (Since 2019) and Forecasted Estimates (Till 2035) (USD Million)
- Figure 26.3 Cell Line Characterization Services Market for Europe: Historical Trends (Since 2019) and Forecasted Estimates (Till 2035) (USD Million)
- Figure 26.4 Cell Line Characterization Services Market for Asia-Pacific and Rest of the World: Historical Trends (Since 2019) and Forecasted Estimates (Till 2035) (USD Million)
- Figure 27.1 Concluding Remarks: Cell Line Development Service Providers Market Landscape
- Figure 27.2 Concluding Remarks: Cell Line Characterization Service Providers Market Landscape
- Figure 27.3 Concluding Remarks: Partnerships and Collaborations
- Figure 27.4 Concluding Remarks: Recent Expansions
- Figure 27.5 Concluding Remarks: Cell Line Development Service Providers Market Forecast and Opportunity Analysis
- Figure 27.6 Concluding Remarks: Cell Line Characterization Service Providers Market Forecast and Opportunity Analysis

