
PUBLISHER: Roots Analysis | PRODUCT CODE: 1771288

PUBLISHER: Roots Analysis | PRODUCT CODE: 1771288
Biopreservation Market: Industry Trends and Global Forecasts - Distribution by Preservation Condition, Type of Serum, Type of Biological Sample, Area of Application, Type of Packaging Format, End Users, and Geographical Region :
GLOBAL BIOPRESERVATION MARKET: OVERVIEW
As per Roots Analysis, the biopreservation market is estimated to grow from USD 1.9 billion in the current year to USD 15.5 billion by 2035, at a CAGR of 23.6% during the forecast period, till 2035.
The market sizing and opportunity analysis has been segmented across the following parameters:
Preservation Condition
- Refrigerated
- Frozen / Cold Chain
- Frozen (Ultra-low) / DeeAp Frozen
- Cryogenic / LN2 Vapor Phase Storage
Type of Serum
- Fetal Bovine Serum Containing Media
- Fetal Calf Serum Containing Media
- Human Serum Containing Media
- Serum Free Media
Type of Biological Sample
- Germline Cells / Stem Cells
- Organs
- Somatic Cells
- Tissues
Area of Application
- Diagnostic Use
- Research and Development
- Therapeutic Use
Type of Packaging Format
- Bags
- Bottles
- Vials
- Others
End Users
- Academic and Research Institutes
- Biobanks / Genebanks
- Hospitals
- Pharmaceutical and Biotechnology Companies
- Other End Users
Geographical Region
- North America
- Europe
- Asia
- Middle East and North Africa
- Latin America
- Rest of the World
GLOBAL BIOPRESERVATION MARKET: GROWTH AND TRENDS
In recent years, there has been a noticeable increase in the development of cell-based products, driven by the rising demand for effective therapeutic solutions. However, these products are highly sensitive to temperature fluctuations and often require freezing or cryogenic conditions for safe transport and storage. According to a study by the USFDA, over 80% of submissions for mesenchymal cell-based therapies indicated a need for cryopreservation. This highlights the urgent need for advanced preservation strategies that can safeguard both genomic and proteomic integrity, while minimizing stress-induced genetic selection (an aspect where most current preservation methods fall short).
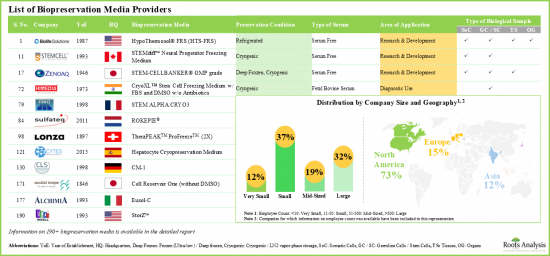
Biopreservation is the exclusive biological approach designated for the preservation of cells, tissues and organs ex-vivo for the purpose of storage, shipment and transportation. Further, biopreservation offers solutions to various product-related challenges by integrating engineering concepts with breakthroughs in cellular and molecular biology. Consequently, industry stakeholders are increasingly turning to pre-formulated, commercially available biopreservation media. Biopreservation media is one of the most crucial entities in conferring effectiveness in preservation of biological samples. The selection of the type of media depends upon the considerable time duration desired for the storage, type of biological material to be preserved and the purpose of biopreservation. Currently, various companies are engaged in providing 190 biopreservation and biobanking solutions designed for the storage and preservation of various types of biological samples.
GLOBAL BIOPRESERVATION MARKET: KEY INSIGHTS
The report delves into the current state of global biopreservation market and identifies potential growth opportunities within industry. Some key findings from the report include:
- Globally, over 60 companies provide biopreservation media, intended for the preservation of biological samples at different preservation conditions.
- Biopreservation media is available in different packaging formats that are compatible with a variety of biological samples.
- Amongst the biopreservation media intended for preservation of somatic cells, nearly 45% are serum free; of these, majority are being used for storage at cryogenic conditions.
- Largely, the biopreservation media support preservation at cryogenic conditions (~90%), prominent examples include C80EZ 2X, C80EZ Standard Medium, C80EZ-Neuron, and C80EZ-TISSUE.
- Prominent examples of companies offering media in multiple packaging formats include Akron Biotech, BioLife Solutions, Fujifilm, Protide Pharmaceuticals, and ScienCell Research Laboratories.
- In order to build a competitive advantage, companies are focused on steadily improving the characteristics of their media offerings.
- The growing interest of stakeholders is also evident from the rise in partnership activity; a relatively larger proportion of the deals were signed by companies based in the US.
- Both established players and new entrants have signed several partnerships in the recent past; most of the companies (~45%) are actively signing manufacturing and supply agreements.
- Industry players have emerged as preferred choice of partner for companies of variable employee strength; however, in mid-to-long term, we expect firms to ink agreements with renowned academic institutes as well.
- Cost is a key determinant of the acceptance and adoption of such biopreservation media; pricing strategy matrix is likely to assist players in evaluating the competitive market prices for their offerings.
- Driven by the rising approval of temperature sensitive products, the market for biopreservation media providers is poised to grow at an annualized rate of over 23.6%, till 2035.
- The projected market opportunity is likely to be well distributed across different end users, biological samples, packaging formats and key geographical regions.
Example Players in the Biopreservation Market
- BioLife Solutions
- Cell Applications
- HiMedia Laboratories
- Merck
- Thermo Fisher Scientific
- United States Biological
- ZenBio
GLOBAL BIOPRESERVATION MARKET: RESEARCH COVERAGE
- Market Sizing and Opportunity Analysis: The report features an in-depth analysis of the global biopreservation market, focusing on key market segments, including [A] preservation condition, [B] type of serum, [C] type of biological sample, [D] area of application, [E] type of packaging format, [F] end users and [E] geographical regions.
- Market Landscape: A comprehensive evaluation of the current biopreservation media providers' landscape, considering various parameters, such as [A] year of establishment, [B] company size, [C] type of company and [D] location of headquarters. Additionally, a comprehensive evaluation of biopreservation media based on several relevant parameters, such as [A] preservation condition, [B] type of serum, [C] type of biological sample, [D] area of application, [E] type of packaging format, [F] packaging volume and [G] product price.
- Key Insights: In-depth analysis of market trends, focusing on location of headquarters and leading players engaged in offering biopreservation media based on the parameters, such as [A] year of establishment, [B] company size, [C] number of biopreservation media offered and [D] region. Further, an insightful representation of biopreservation media, distributed based on [A] preservation condition and [B] area of application, a grid representation illustrating the distribution of biopreservation media based on [A] company size, [B] region, preservation condition, [C] type of serum and type of biological sample, and a heat map representation of biopreservation media, distributed on the basis of [A] minimum packaging volume and [B] minimum price.
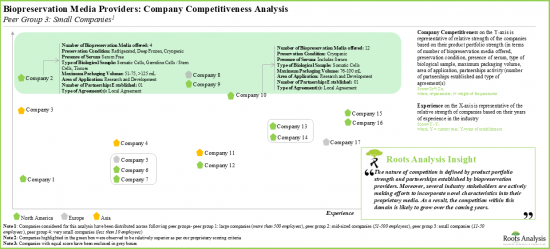
- Company Competitiveness Analysis: A comprehensive competitive analysis of biopreservation media providers, examining factors, such as [A] years of experience, [B] product portfolio strength and [C] partnership activity.
- Company Profiles: In-depth profiles of companies engaged in this domain, focusing on [A] company overview, and [B] recent developments and an informed future outlook.
- Partnerships and Collaborations: An insightful analysis of the deals inked by stakeholders in the biopreservation market, based on several parameters, such as [A] year of partnership, [B] type of partnership, [C] type of partner, [D] most active players (in terms of the number of partnerships signed) and [E] geography.
- Bowman Clock Pricing Strategy: In-depth analysis of a framework to understand the pricing strategy of the biopreservation media provided by the company along with its competitive position.
KEY QUESTIONS ANSWERED IN THIS REPORT
- How many companies are currently engaged in this market?
- Which are the leading companies in this market?
- What factors are likely to influence the evolution of this market?
- What is the current and future market size?
- What is the CAGR of this market?
- How is the current and future market opportunity likely to be distributed across key market segments?
REASONS TO BUY THIS REPORT
- The report provides a comprehensive market analysis, offering detailed revenue projections of the overall market and its specific sub-segments. This information is valuable to both established market leaders and emerging entrants.
- Stakeholders can leverage the report to gain a deeper understanding of the competitive dynamics within the market. By analyzing the competitive landscape, businesses can make informed decisions to optimize their market positioning and develop effective go-to-market strategies.
- The report offers stakeholders a comprehensive overview of the market, including key drivers, barriers, opportunities, and challenges. This information empowers stakeholders to stay abreast of market trends and make data-driven decisions to capitalize on growth prospects.
ADDITIONAL BENEFITS
- Complimentary PPT Insights Packs
- Complimentary Excel Data Packs for all Analytical Modules in the Report
- 15% Free Content Customization
- Detailed Report Walkthrough Session with Research Team
- Free Updated report if the report is 6-12 months old or older
TABLE OF CONTENTS
1. PREFACE
- 1.1. Scope of the Report
- 1.2. Research Methodology
- 1.2.1. Research Assumptions
- 1.2.2. Project Methodology
- 1.2.3. Forecast Methodology
- 1.2.4. Robust Quality Control
- 1.2.5. Key Considerations
- 1.2.5.1. Demographics
- 1.2.5.2. Economic Factors
- 1.2.5.3. Government Regulations
- 1.2.5.4. Supply Chain
- 1.2.5.5. COVID Impact / Related Factors
- 1.2.5.6. Market Access
- 1.2.5.7. Healthcare Policies
- 1.2.5.8. Industry Consolidation
- 1.3 Key Questions Answered
- 1.4. Chapter Outlines
2. EXECUTIVE SUMMARY
- 2.1. Chapter Overview
3. INTRODUCTION
- 3.1. Chapter Overview
- 3.2. Introduction to Biopreservation
- 3.3. Type of Biopreservation
- 3.3.1. Hypothermic Preservation
- 3.3.2. Cryopreservation
- 3.4. Applications of Biopreservation Media
- 3.5. Benefits and Limitations of Biopreservation Media
- 3.6. Concluding Remarks
4. MARKET LANDSCAPE
- 4.1. Chapter Overview
- 4.2. Biopreservation Media Providers: Service Providers Landscape
- 4.2.1. Analysis by Year of Establishment
- 4.2.2. Analysis by Company Size
- 4.2.3. Analysis by Type of Company
- 4.2.4. Analysis by Location of Headquarters
- 4.3. Biopreservation Media: Market Landscape
- 4.3.1. Analysis by Preservation Condition
- 4.3.2. Analysis by Type of Serum
- 4.3.3. Analysis by Type of Biological Sample
- 4.3.4. Analysis by Area of Application
- 4.3.5. Analysis by Type of Packaging Format
- 4.3.6. Analysis by Packaging Volume
- 4.3.7. Analysis by Product Price
5. KEY INSIGHTS
- 5.1. Chapter Overview
- 5.2. Analysis by Location of Headquarters (World Map Representation)
- 5.3. Analysis by Year of Establishment, Company Size, Number of Biopreservation Media Offered and Region (4D Bubble Chart)
- 5.4. Analysis by Preservation Condition and Area of Application (Treemap Representation)
- 5.5. Analysis by Company Size, Region, Preservation Condition, Type of Serum and Type of Biological Sample (Grid Representation)
- 5.6. Analysis by Minimum Packaging Volume and Minimum Price (Heat Map Representation)
6. COMPANY COMPETITIVENESS
- 6.1. Chapter Overview
- 6.2. Assumptions and Key Parameters
- 6.3. Methodology
- 6.4. Benchmarking of Product Portfolio Strength
- 6.5. Benchmarking of Partnership Activity
- 6.6. Biopreservation Media Providers: Company Competitiveness Analysis
- 6.6.1. Company Competitiveness Analysis: Very Small Companies
- 6.6.2. Company Competitiveness Analysis: Small Companies
- 6.6.3. Company Competitiveness Analysis: Mid-Sized Companies
- 6.6.4. Company Competitiveness Analysis: Large Companies
7. COMPANY PROFILES
- 7.1. Chapter Overview
- 7.2. BioLife Solutions
- 7.2.1. Company Overview
- 7.2.2. Recent Developments and Future Outlook
- 7.3. Cell Applications
- 7.3.1. Company Overview
- 7.3.2. Recent Developments and Future Outlook
- 7.4. HiMedia Laboratories
- 7.4.1. Company Overview
- 7.4.2. Recent Developments and Future Outlook
- 7.5. Merck
- 7.5.1. Company Overview
- 7.5.2. Recent Developments and Future Outlook
- 7.6. Thermo Fischer Scientific
- 7.6.1. Company Overview
- 7.6.2. Recent Developments and Future Outlook
- 7.7. United States Biological
- 7.7.1. Company Overview
- 7.7.2. Recent Developments and Future Outlook
- 7.8. ZenBio
- 7.8.1. Company Overview
- 7.8.2. Recent Developments and Future Outlook
8. PARTNERSHIPS AND COLLABORATIONS
- 8.1. Chapter Overview
- 8.2. Partnership Models
- 8.3. Biopreservation Media Providers: Partnerships and Collaborations
- 8.3.1. Analysis by Year of Partnership
- 8.3.2. Analysis by Type of Partnership
- 8.3.2.1. Analysis by Year and Type of Partnership
- 8.3.2.2. Analysis by Type of Partnership and Company Size
- 8.3.3. Analysis by Type of Partner
- 8.3.3.1. Analysis by Year of Partnership and Type of Partner
- 8.3.3.2. Analysis by Type of Partner and Type of Partnership
- 8.3.3.3. Analysis by Type of Partner and Company Size
- 8.3.4. Most Active Players: Analysis by Number of Partnerships
- 8.3.5. Regional Analysis
- 8.3.5.1. Local and International Deals
- 8.3.5.2. Intercontinental and Intracontinental Deals
- 8.3.5.3. Analysis by Location of Headquarters of Partner
- 8.3.5.4. Analysis by Location of Headquarters of Partner and Type of Partnership
9. BOWMAN CLOCK PRICING STRATEGY
- 9.1. Chapter Overview
- 9.2. Bowman Strategy Clock
- 9.2.1. Two Dimensions of Bowman Strategy Clock
- 9.2.2. Eight Positions on Bowman Strategy Clock
- 9.3. Roots Analysis Framework
- 9.3.1. Methodology
- 9.3.2. Theoretical Framework and Price Evaluation Hypothesis
- 9.3.3. Results and Interpretation
- 9.3.3.1. Product Price Evaluation Matrix: Information on Preservation Condition
- 9.3.3.2. Product Price Evaluation Matrix: Information on Type of Serum
- 9.3.3.3. Product Price Evaluation Matrix: Information on Type of Biological Sample
- 9.3.3.4. Product Price Evaluation Matrix: Information on Minimum Packaging Volume
- 9.3.3.5. Product Price Evaluation Matrix: Information on Maximum Packaging Volume
- 9.3.3.6. Product Price Evaluation Matrix: Information on Packaging Format
- 9.3.3.7. Product Price Evaluation Matrix: Information on Area of Application
- 9.3.4. Concluding Remarks
10. MARKET SIZING AND OPPORTUNITY ANALYSIS
- 10.1. Chapter Overview
- 10.2. Forecast Methodology and Key Assumptions
- 10.3. Biopreservation Media Providers Market, Till 2035
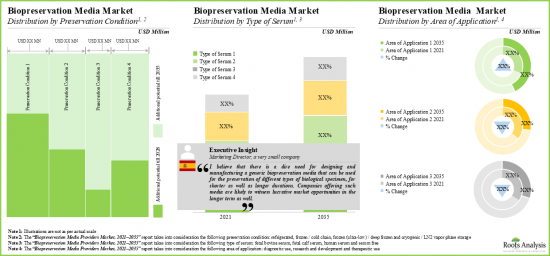
- 10.4. Biopreservation Media Providers Market: Distribution by Preservation Condition
- 10.4.1. Biopreservation Media Providers Market for Cryogenic / LN2 Vapor Phase, Till 2035
- 10.4.2. Biopreservation Media Providers Market for Frozen (Ultra-low) / Deep Frozen, Till 2035
- 10.4.3. Biopreservation Media Providers Market for Frozen / Cold Chain, Till 2035
- 10.4.4. Biopreservation Media Providers Market for Refrigerated, Till 2035
- 10.5. Biopreservation Media Providers Market: Distribution by Type of Serum
- 10.5.1. Biopreservation Media Providers Market for Fetal Bovine Serum Containing Media, Till 2035
- 10.5.2. Biopreservation Media Providers Market for Fetal Calf Serum Containing Media, Till 2035
- 10.5.3. Biopreservation Media Providers Market for Human Serum Containing Media, Till 2035
- 10.5.4. Biopreservation Media Providers Market for Serum Free Media, Till 2035
- 10.6. Biopreservation Media Providers Market: Distribution by Type of Biological Sample
- 10.6.1. Biopreservation Media Providers Market for Germline Cells / Stem Cells, Till 2035
- 10.6.2. Biopreservation Media Providers Market for Organs, Till 2035
- 10.6.3. Biopreservation Media Providers Market for Somatic Cells, Till 2035
- 10.6.4. Biopreservation Media Providers Market for Tissues, Till 2035
- 10.7. Biopreservation Media Providers Market: Distribution by Area of Application
- 10.7.1. Biopreservation Media Providers Market for Diagnostic Use, Till 2035
- 10.7.2. Biopreservation Media Providers Market for Research and Development, Till 2035
- 10.7.3. Biopreservation Media Providers Market for Therapeutic Use, Till 2035
- 10.8. Biopreservation Media Providers Market: Distribution by Type of Packaging Format
- 10.8.1. Biopreservation Media Providers Market for Bags, Till 2035
- 10.8.2. Biopreservation Media Providers Market for Bottles, Till 2035
- 10.8.3. Biopreservation Media Providers Market for Vials, Till 2035
- 10.8.4. Biopreservation Media Providers Market for Others, Till 2035
- 10.9. Biopreservation Media Providers Market: Distribution by End Users
- 10.9.1. Biopreservation Media Providers Market for Academic and Research Institutes, Till 2035
- 10.9.2. Biopreservation Media Providers Market for Biobanks / Genebanks, Till 2035
- 10.9.3. Biopreservation Media Providers Market for Hospitals, Till 2035
- 10.9.4. Biopreservation Media Providers Market for Pharmaceutical and Biotechnology Companies, Till 2035
- 10.9.5. Biopreservation Media Providers Market for Other End Users, Till 2035
- 10.10. Biopreservation Media Providers Market: Distribution by Region
- 10.10.1. Biopreservation Media Providers Market in North America, Till 2035
- 10.10.2. Biopreservation Media Providers Market in Europe, Till 2035
- 10.10.3. Biopreservation Media Providers Market in Asia, Till 2035
- 10.10.4. Biopreservation Media Providers Market in MENA, Till 2035
- 10.10.5. Biopreservation Media Providers Market in Latin America, Till 2035
- 10.10.6. Biopreservation Media Providers Market in Rest of the World, Till 2035
- 10.11. Concluding Remarks
11. CONCLUSION
- 11.1. Chapter Overview
12. EXECUTIVE INSIGHTS
- 12.1. Chapter Overview
- 12.2. Company A
- 12.2.1. Company Snapshot
- 12.2.2. Interview Transcript: Marketing Director
13. APPENDIX I: TABULATED DATA
14. APPENDIX II: LIST OF COMPANIES AND ORGANIZATION
List of Tables
- Table 4.1 Biopreservation Media Providers: Information on Year of Establishment, Company Size, Location of Headquarters (Country-wise and Region-wise) and Company Type
- Table 4.2 Biopreservation Media: Information on Preservation Condition
- Table 4.3 Biopreservation Media: Information on Type of Serum
- Table 4.4 Biopreservation Media: Information on Type of Biological Sample
- Table 4.5 Biopreservation Media: Information on Area of Application
- Table 4.6 Biopreservation Media: Information on Type of Packaging Format
- Table 4.7 Biopreservation Media: Information on Packaging Volume and Product Price
- Table 6.1 Company Competitiveness Analysis: Benchmarking of Product Portfolio Strength
- Table 6.2 Company Competitiveness Analysis: Benchmarking of Partnership Activity
- Table 6.3 Company Competitiveness Analysis: List of Very Small Players
- Table 6.4 Company Competitiveness Analysis: List of Small Players
- Table 6.5 Company Competitiveness Analysis: List of Mid-Sized Players
- Table 6.6 Company Competitiveness Analysis: List of Large Players
- Table 7.1 List of Companies Profiled
- Table 7.2 BioLife Solutions: Company Overview
- Table 7.3 BioLife Solutions: Recent Developments and Future Outlook
- Table 7.4 Cell Applications: Company Overview
- Table 7.5 HiMedia Laboratories: Company Overview
- Table 7.6 HiMedia Laboratories: Recent Developments and Future Outlook
- Table 7.7 Merck: Company Overview
- Table 7.8 Merck: Recent Developments and Future Outlook
- Table 7.9 Thermo Fischer Scientific: Company Overview
- Table 7.10 Thermo Fischer Scientific: Recent Developments and Future Outlook
- Table 7.11 United States Biological: Company Overview
- Table 7.12 ZenBio: Company Overview
- Table 7.13 ZenBio: Recent Developments and Future Outlook
- Table 8.1 Biopreservation Media: List of Collaborations, Since 2015
- Table 8.2 Biopreservation Media Providers: Partnerships and Collaborations, Information on Type of Agreement (Local and International Deals) and (Intercontinental and Intracontinental Deals), Since 2015
- Table 9.1 Product Price Evaluation Matrix: Information on Preservation Condition (USD)
- Table 9.2 Product Price Evaluation Matrix: Information on Type of Serum (USD)
- Table 9.3 Product Price Evaluation Matrix: Information on Type of Biological Sample (USD)
- Table 9.4 Product Price Evaluation Matrix: Information on Minimum Packaging Volume (USD)
- Table 9.5 Product Price Evaluation Matrix: Information on Maximum Packaging Volume (USD)
- Table 9.6 Product Price Evaluation Matrix: Information on Packaging Format (USD)
- Table 9.7 Product Price Evaluation Matrix: Information on Area of Application (USD)
- Table 12.1 Cytes Biotechnologies: Company Snapshot
- Table 13.1 Biopreservation Media Providers: Distribution by Year of Establishment
- Table 13.2 Biopreservation Media Providers: Distribution by Company Size
- Table 13.3 Biopreservation Media Providers: Distribution by Type of Company
- Table 13.4 Biopreservation Media Providers: Distribution by Location of Headquarters
- Table 13.5 Biopreservation Media: Distribution by Preservation Condition
- Table 13.6 Biopreservation Media: Distribution by Type of Serum
- Table 13.7 Biopreservation Media: Distribution by Type of Biological Sample
- Table 13.8 Biopreservation Media: Distribution by Area of Application
- Table 13.9 Biopreservation Media: Distribution by Type of Packaging Format
- Table 13.10 Biopreservation Media: Distribution by Minimum Packaging Volume (mL)
- Table 13.11 Biopreservation Media: Distribution by Maximum Packaging Volume (mL)
- Table 13.12 Biopreservation Media: Distribution by Minimum Price (USD)
- Table 13.13 Biopreservation Media: Distribution by Maximum Price (USD)
- Table 13.14 Partnerships and Collaborations: Cumulative Year-wise Trend, Since 2015
- Table 13.15 Partnerships and Collaborations: Distribution by Type of Partnership
- Table 13.16 Partnerships and Collaborations: Distribution by Year and Type of Partnership
- Table 13.17 Partnerships and Collaborations: Distribution by Type of Partnership and Company Size
- Table 13.18 Partnerships and Collaborations: Distribution by Type of Partner
- Table 13.19 Partnerships and Collaborations: Year-wise Distribution by Type of Partner
- Table 13.20 Partnerships and Collaborations: Distribution by Type of Partner and Type of Partnership
- Table 13.21 Partnerships and Collaborations: Distribution by Type of Partner and Company Size
- Table 13.22 Partnerships and Collaborations: Distribution by Number of Partnerships
- Table 13.23 Partnerships and Collaborations: Local and International Deals
- Table 13.24 Partnerships and Collaborations: Intercontinental and Intracontinental Deals
- Table 13.25 Partnerships and Collaborations: Distribution by Location of Headquarters of Partner
- Table 13.26 Partnerships and Collaborations: Distribution by Location of Headquarters of Partner and Type of Partnership
- Table 13.27 Biopreservation Media Providers Market, Till 2035, Conservative, Base and Optimistic Scenarios (USD Million)
- Table 13.28 Biopreservation Media Providers Market: Distribution by Preservation Condition
- Table 13.29 Biopreservation Media Providers Market for Cryogenic / LN2 Vapor Phase, Till 2035, Conservative, Base and Optimistic Scenarios (USD Million)
- Table 13.30 Biopreservation Media Providers Market for Frozen (Ultra-low) / Deep Frozen, Till 2035, Conservative, Base and Optimistic Scenarios (USD Million)
- Table 13.31 Biopreservation Media Providers Market for Frozen / Cold Chain, Till 2035, Conservative, Base and Optimistic Scenarios (USD Million)
- Table 13.32 Biopreservation Media Providers Market for Refrigerated, Till 2035, Conservative, Base and Optimistic Scenarios (USD Million)
- Table 13.33 Biopreservation Media Providers Market: Distribution by Type of Serum
- Table 13.34 Biopreservation Media Providers Market for Fetal Bovine Serum Containing Media, Till 2035, Conservative, Base and Optimistic Scenarios (USD Million)
- Table 13.35 Biopreservation Media Providers Market for Fetal Calf Serum Containing Media, Till 2035, Conservative, Base and Optimistic Scenarios (USD Million)
- Table 13.36 Biopreservation Media Providers Market for Human Serum Containing Media, Till 2035, Conservative, Base and Optimistic Scenarios (USD Million)
- Table 13.37 Biopreservation Media Providers Market for Serum Free Media, Till 2035, Conservative, Base and Optimistic Scenarios (USD Million)
- Table 13.38 Biopreservation Media Providers Market: Distribution by Type of Biological Sample
- Table 13.39 Biopreservation Media Providers Market for Germline Cells / Stem Cells, Till 2035, Conservative, Base and Optimistic Scenarios (USD Million)
- Table 13.40 Biopreservation Media Providers Market for Organs, Till 2035, Conservative, Base and Optimistic Scenarios (USD Million)
- Table 13.41 Biopreservation Media Providers Market for Somatic Cells, Till 2035, Conservative, Base and Optimistic Scenarios (USD Million)
- Table 13.42 Biopreservation Media Providers Market for Tissues, Till 2035, Conservative, Base and Optimistic Scenarios (USD Million)
- Table 13.43 Biopreservation Media Providers Market: Distribution by Area of Application
- Table 13.44 Biopreservation Media Providers Market for Diagnostic Use, Till 2035, Conservative, Base and Optimistic Scenarios (USD Million)
- Table 13.45 Biopreservation Media Providers Market for Research and Development, Till 2035, Conservative, Base and Optimistic Scenarios (USD Million)
- Table 13.46 Biopreservation Media Providers Market for Therapeutic Use, Till 2035, Conservative, Base and Optimistic Scenarios (USD Million)
- Table 13.47 Biopreservation Media Providers Market: Distribution by Type of Packaging Format
- Table 13.48 Biopreservation Media Providers Market for Bags, Till 2035, Conservative, Base and Optimistic Scenarios (USD Million)
- Table 13.49 Biopreservation Media Providers Market for Bottles, Till 2035, Conservative, Base and Optimistic Scenarios (USD Million)
- Table 13.50 Biopreservation Media Providers Market for Vials, Till 2035, Conservative, Base and Optimistic Scenarios (USD Million)
- Table 13.51 Biopreservation Media Providers Market for Others, Till 2035, Conservative, Base and Optimistic Scenarios (USD Million)
- Table 13.52 Biopreservation Media Providers Market: Distribution by End Users
- Table 13.53 Biopreservation Media Providers Market for Academic and Research Institutes, Till 2035, Conservative, Base and Optimistic Scenarios (USD Million)
- Table 13.54 Biopreservation Media Providers Market for Biobanks / Genebanks, Till 2035, Conservative, Base and Optimistic Scenarios (USD Million)
- Table 13.55 Biopreservation Media Providers Market for Hospitals, Till 2035, Conservative, Base and Optimistic Scenarios (USD Million)
- Table 13.56 Biopreservation Media Providers Market for Pharmaceutical and Biotechnology Companies, Till 2035, Conservative, Base and Optimistic Scenarios (USD Million)
- Table 13.57 Biopreservation Media Providers Market for Other End Users, Till 2035, Conservative, Base and Optimistic Scenarios (USD Million)
- Table 13.58 Biopreservation Media Providers Market: Distribution by Region
- Table 13.59 Biopreservation Media Providers Market in North America, Till 2035, Conservative, Base and Optimistic Scenarios (USD Million)
- Table 13.60 Biopreservation Media Providers Market in Europe, Till 2035, Conservative, Base and Optimistic Scenarios (USD Million)
- Table 13.61 Biopreservation Media Providers Market in Asia, Till 2035, Conservative, Base and Optimistic Scenarios (USD Million)
- Table 13.62 Biopreservation Media Providers Market in MENA, Till 2035, Conservative, Base and Optimistic Scenarios (USD Million)
- Table 13.63 Biopreservation Media Providers Market in Latin America, Till 2035, Conservative, Base and Optimistic Scenarios (USD Million)
- Table 13.64 Biopreservation Media Providers Market in Rest of the World, Till 2035, Conservative, Base and Optimistic Scenarios (USD Million)
List of Figures
- Figure 2.1 Executive Summary: Service Providers Landscape
- Figure 2.2 Executive Summary: Market Landscape
- Figure 2.3 Executive Summary: Partnerships and Collaborations
- Figure 2.4 Executive Summary: Current and Future Market Potential
- Figure 3.1 Applications of Biopreservation Media
- Figure 3.2 Key Benefits and Limitations of Hypothermic Biopreservation Media
- Figure 3.3 Key Benefits and Limitations of Cryopreservation Media
- Figure 4.1 Biopreservation Media Providers: Distribution by Year of Establishment
- Figure 4.2 Biopreservation Media Providers: Distribution by Company Size
- Figure 4.3 Biopreservation Media Providers: Distribution by Type of Company
- Figure 4.4 Biopreservation Media Providers: Distribution by Location of Headquarters
- Figure 4.5 Biopreservation Media: Distribution by Preservation Condition
- Figure 4.6 Biopreservation Media: Distribution by Type of Serum
- Figure 4.7 Biopreservation Media: Distribution by Type of Biological Sample
- Figure 4.8 Biopreservation Media: Distribution by Area of Application
- Figure 4.9 Biopreservation Media: Distribution by Type of Packaging Format
- Figure 4.10 Biopreservation Media: Distribution by Minimum Packaging Volume (mL)
- Figure 4.11 Biopreservation Media: Distribution by Maximum Packaging Volume (mL)
- Figure 4.12 Biopreservation Media: Distribution by Minimum Price (USD)
- Figure 4.13 Biopreservation Media: Distribution by Maximum Price (USD)
- Figure 5.1 Biopreservation Media Providers: Distribution by Location of Headquarters (World Map Representation)
- Figure 5.2 Biopreservation Media Providers: Distribution by Year of Establishment, Company Size, Number of Biopreservation Media Offered and Region (4D Bubble Chart)
- Figure 5.3 Biopreservation Media: Distribution by Preservation Condition and Area of Application (Treemap Representation)
- Figure 5.4 Biopreservation Media: Distribution by Company Size, Region, Preservation Condition, Type of Serum and Type of Biological Sample (Grid Representation)
- Figure 5.5 Biopreservation Media: Distribution by Minimum Packaging Volume and Minimum Price (Heat Map Representation)
- Figure 6.1 Company Competitiveness Analysis: Benchmarking of Product Portfolio Strength
- Figure 6.2 Company Competitiveness Analysis: Benchmarking of Partnership Activity
- Figure 6.3 Company Competitiveness Analysis: Very Small Companies
- Figure 6.4 Company Competitiveness Analysis: Small Companies
- Figure 6.5 Company Competitiveness Analysis: Mid-Sized Companies
- Figure 6.6 Company Competitiveness Analysis: Large Companies
- Figure 8.1 Partnerships and Collaborations: Cumulative Year-wise Trend, Since 2015
- Figure 8.2 Partnerships and Collaborations: Logo Landscape
- Figure 8.3 Partnerships and Collaborations: Distribution by Type of Partnership
- Figure 8.4 Partnerships and Collaborations: Distribution by Year and Type of Partnership
- Figure 8.5 Partnerships and Collaborations: Distribution by Type of Partnership and Company Size
- Figure 8.6 Partnerships and Collaborations: Distribution by Type of Partner
- Figure 8.7 Partnerships and Collaborations: Year-wise Distribution by Type of Partner
- Figure 8.8 Partnerships and Collaborations: Distribution by Type of Partner and Type of Partnership
- Figure 8.9 Partnerships and Collaborations: Distribution by Type of Partner and Company Size
- Figure 8.10 Partnerships and Collaborations: Distribution by Number of Partnerships
- Figure 8.11 Partnerships and Collaborations: Local and International Deals
- Figure 8.12 Partnerships and Collaborations: Intercontinental and Intracontinental Deals
- Figure 8.13 Partnerships and Collaborations: Distribution by Location of Headquarters of Partner
- Figure 8.14 Partnerships and Collaborations: Distribution by Location of Headquarters of Partner and Type of Partnership
- Figure 9.1 Biopreservation Media: Bowman Clock Pricing Strategy Matrix
- Figure 9.2 Biopreservation Media: Bowman Clock Pricing Strategy Graphical Interpretation
- Figure 10.1 Biopreservation Media Providers Market, Till 2035 (USD Million)
- Figure 10.2 Biopreservation Media Providers Market: Distribution by Preservation Condition
- Figure 10.3 Biopreservation Media Providers Market for Cryogenic / LN2 Vapor Phase, Till 2035 (USD Million)
- Figure 10.4 Biopreservation Media Providers Market for Frozen (Ultra-low) / Deep Frozen, Till 2035 (USD Million)
- Figure 10.5 Biopreservation Media Providers Market for Frozen / Cold Chain, Till 2035 (USD Million)
- Figure 10.6 Biopreservation Media Providers Market for Refrigerated, Till 2035 (USD Million)
- Figure 10.7 Biopreservation Media Providers Market: Distribution by Type of Serum
- Figure 10.8 Biopreservation Media Providers Market for Fetal Bovine Serum Containing Media, Till 2035 (USD Million)
- Figure 10.9 Biopreservation Media Providers Market for Fetal Calf Serum Containing Media, Till 2035 (USD Million)
- Figure 10.10 Biopreservation Media Providers Market for Human Serum Containing Media, Till 2035 (USD Million)
- Figure 10.11 Biopreservation Media Providers Market for Serum Free Media, Till 2035 (USD Million)
- Figure 10.12 Biopreservation Media Providers Market: Distribution by Type of Biological Sample
- Figure 10.13 Biopreservation Media Providers Market for Germline Cells / Stem Cells, Till 2035 (USD Million)
- Figure 10.14 Biopreservation Media Providers Market for Organs, Till 2035 (USD Million)
- Figure 10.15 Biopreservation Media Providers Market for Somatic Cells, Till 2035 (USD Million)
- Figure 10.16 Biopreservation Media Providers Market for Tissues, Till 2035 (USD Million)
- Figure 10.17 Biopreservation Media Providers Market: Distribution by Area of Application
- Figure 10.18 Biopreservation Media Providers Market for Diagnostic Use, Till 2035 (USD Million)
- Figure 10.19 Biopreservation Media Providers Market for Research and Development, Till 2035 (USD Million)
- Figure 10.20 Biopreservation Media Providers Market for Therapeutic Use, Till 2035 (USD Million)
- Figure 10.21 Biopreservation Media Providers Market: Distribution by Type of Packaging Format
- Figure 10.22 Biopreservation Media Providers Market for Bags, Till 2035 (USD Million)
- Figure 10.23 Biopreservation Media Providers Market for Bottles, Till 2035 (USD Million)
- Figure 10.24 Biopreservation Media Providers Market for Vials, Till 2035 (USD Million)
- Figure 10.25 Biopreservation Media Providers Market for Others, Till 2035 (USD Million)
- Figure 10.26 Biopreservation Media Providers Market: Distribution by End Users
- Figure 10.27 Biopreservation Media Providers Market for Academic and Research Institutes, Till 2035 (USD Million)
- Figure 10.28 Biopreservation Media Providers Market for Biobanks / Genebanks, Till 2035 (USD Million)
- Figure 10.29 Biopreservation Media Providers Market for Hospitals, Till 2035 (USD Million)
- Figure 10.30 Biopreservation Media Providers Market for Pharmaceutical and Biotechnology Companies, Till 2035 (USD Million)
- Figure 10.31 Biopreservation Media Providers Market for Other End Users, Till 2035 (USD Million)
- Figure 10.32 Biopreservation Media Providers Market: Distribution by Region
- Figure 10.33 Biopreservation Media Providers Market in North America, Till 2035 (USD Million)
- Figure 10.34 Biopreservation Media Providers Market in Europe, Till 2035 (USD Million)
- Figure 10.35 Biopreservation Media Providers Market in Asia, Till 2035 (USD Million)
- Figure 10.36 Biopreservation Media Providers Market in MENA, Till 2035 (USD Million)
- Figure 10.37 Biopreservation Media Providers Market in Latin America, Till 2035 (USD Million)
- Figure 10.38 Biopreservation Media Providers Market in Rest of the World, Till 2035 (USD Million)
- Figure 10.39 Biopreservation Media Providers Market, Conservative, Base and Optimistic Scenarios (USD Million)
- Figure 11.1 Concluding Remarks: Current Market Landscape
- Figure 11.2 Concluding Remarks: Company Competitiveness Analysis
- Figure 11.3 Concluding Remarks: Partnerships and Collaborations
- Figure 11.4 Concluding Remarks: Market Sizing and Opportunity Analysis

