
PUBLISHER: Roots Analysis | PRODUCT CODE: 1771290

PUBLISHER: Roots Analysis | PRODUCT CODE: 1771290
DNA Damage Response Market: Industry Trends and Global Forecasts - Distribution by Target Disease Indication, Therapeutic Area, Target Molecule, Type of Molecule, Route of Administration, and Key Geographical Regions
GLOBAL DNA DAMAGE RESPONSE MARKET: OVERVIEW
As per Roots Analysis, the global DNA damage response market valued at USD 13 million in the current year is anticipated to grow at a lucrative CAGR during the forecast period.
The market sizing and opportunity analysis has been segmented across the following parameters:
Target Disease Indication
- Acute Myeloid Leukemias
- COVID-19
- Diabetic Macular Edemas
- Mesotheliomas
- Myelodysplastic Syndromes
- Non-Squamous Non-Small Cell Lung Cancers
- Prostate Cancers
- Uterine Serous Carcinomas
Therapeutic Area
- Hematological Malignancies
- Solid Tumors
- Other Disorders
Target Molecule
- APE1/Ref-1
- Casein Kinase 2
- CHK-1
- C-Tak
- DHODH
- MAPKAPK2
- p53
- WEE 1
Type of Molecule
- Biologics
- Small Molecule
Route of Administration
- Oral Drugs
- Intravenous Drugs
Key Geographical Regions
- North America (US and Canada)
- Europe (Denmark, France, Germany, Italy, Spain and UK)
- Asia-Pacific (Australia, Singapore and South Korea)
GLOBAL DNA DAMAGE RESPONSE MARKET: GROWTH AND TRENDS
The DNA damage response (DDR) consists of a coordinated network of pathways that not only facilitate the repair of DNA lesions but also activate cell cycle checkpoints. This leads to cell cycle arrest at critical stages in order to maintain the overall genomic integrity. Notably, if the damage is irreparable, this intricate system ensures that cells either repair their genetic material before undergoing division or facilitate programmed cell death to prevent the propagation of mutations. Further, its high specificity and sensitivity to conventional therapies, and low off-target toxicity have made DDR a promising therapeutic target for a broad range of clinical conditions, including both oncological and non-oncological diseases. Consequently, researchers worldwide are developing DDR inhibitors to counter DDR-mediated resistance to DNA-damaging anticancer therapies and to exploit DDR dysfunction in cancer by targeting alternative pathways.
It is worth mentioning that four poly-ADP ribose polymerase (PARP) inhibitor drugs, which target the DNA damage repair process, are currently approved for advanced-stage cancer treatment. Additionally, drug developers worldwide are investigating other molecular targets within the DNA damage response pathway, including ATM, ATR, CHK1, and WEE1.
GLOBAL DNA DAMAGE RESPONSE MARKET: KEY INSIGHTS
The report delves into the current state of global DNA damage response market and identifies potential growth opportunities within industry. Some key findings from the report include:
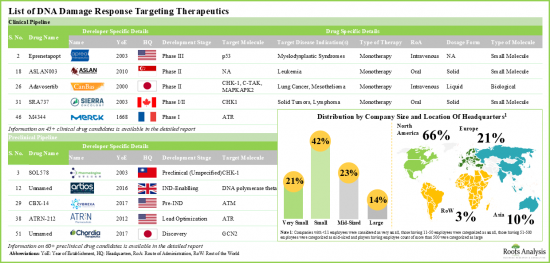
- Presently, close to 45 companies are engaged in the development of DNA damage response (DDR) targeting therapeutics in order to treat a range of clinical conditions.
- Majority of pipeline drug candidates are in the early phases of development; these are predominantly designed to target epitopes on biological molecules that are a characteristic of various oncological disorders.
- The preclinical pipeline of DDR targeting therapeutics is substantial and growing; majority of these drug candidates (over 75%) are small molecules.
- Over 70% of drug candidates targeting ATR are in clinical trials and around 55% of such interventions are designed for oral administration.
- About 65% of DDR targeting drugs intended to treat solid tumors have already demonstrated preclinical proof of concept.
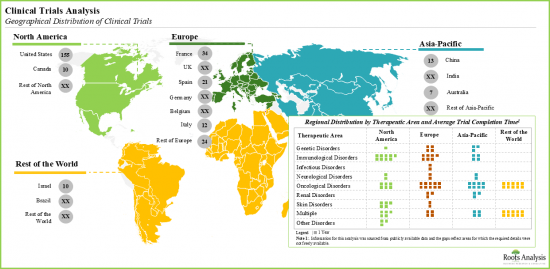
- Since 2010, over 220 clinical trials have been registered to evaluate the efficacy of DDR targeting therapies; average completion time for such studies was relatively less in Asia-Pacific.
- Innovation in this field is evident across the plethora of scientific articles published in prestigious journals; the current focus appears to be on identification of novel targets, specifically against different types of cancers.
- The number of publications in this domain has increased significantly in the past one year; around 30% of the articles have been published since 2021.
- Published articles / papers indicate that the focus of current research activity is on target molecules, such as ATR, ADP, ATR and HSP.
- There has been an evident increase in research focused on DDR targeting therapies against cancers, such as leukemia, lung and ovarian cancers.
- Several parameters, ranging from initial stages of development to launch of the drug, influence the pricing and adoption rates; developers must consider the combination of all these factors to survive the competition.
- In pursuit of a competitive edge and the successful establishment of a large consumer base, it is imperative for innovators to understand both direct and indirect influences on the adoption and pricing of their respective products.
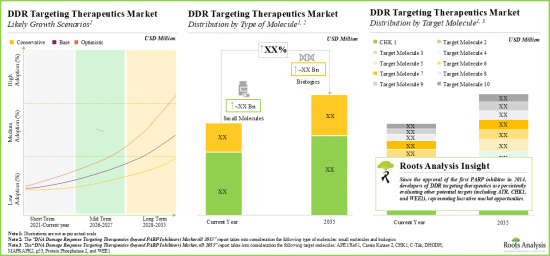
- Considering the promising development pipeline of therapies and encouraging clinical research outcomes, the DDR targeting therapeutics market is anticipated to grow at a significant annualized till 2035.
- The projected market opportunity is likely to be well-distributed across different target disease indications, routes of administration and key geographical regions.
Example Players in the DNA Damage Response Market
- Aprea Therapeutics
- AstraZeneca
- Chordia Therapeutics
- Mission Therapeutics
- Repare Therapeutics
- Senhwa Biosciences
GLOBAL DNA DAMAGE RESPONSE MARKET
- Market Sizing and Opportunity Analysis: The report features an in-depth analysis of the global DNA damage response market, focusing on key market segments, including [A] target disease indication, [B] therapeutic area, [C] target molecule, [D] type of molecule, [E] route of administration and [F] key geographical regions.
- Market Landscape: A comprehensive evaluation of DNA damage response targeting therapeutics, considering various parameters, such as [A] phase of development, [B] target disease indication(s), [C] therapeutic area, [D] target molecule, [E] type of molecule, [F] type of therapy, [G] dosage form, [H] route of administration and [I] special drug designation awarded (if any). Additionally, a comprehensive evaluation of the companies engaged in development of DNA damage response targeting therapeutics, based on [A] year of establishment, [B] company size (in terms of employee count) and [C] location of respective headquarters.
- Key Insights: An insightful analysis of contemporary market trends that have been depicted using four schematic representations, including [A] a bubble analysis comparing the leading players engaged in DNA damage response market, [B] an analysis of DNA damage response targeting therapeutics developers, based on their target therapeutic area and company size, [C] a detailed analysis highlighting the regional distribution of developers engaged in DNA damage response market, and [D] a comprehensive analysis illustrating the distribution of DNA damage response targeting therapeutics.
- Company Profiles: In-depth profiles of companies engaged in the development of DNA damage response targeting therapeutics, focusing on [A] company overview, [B] details related to its respective drug candidates and [C] recent developments and an informed future outlook.
- Clinical Trial Analysis: An in-depth analysis of more than 250 completed, ongoing and planned clinical studies of various DNA damage response targeting therapeutics, based on various relevant parameters, such as [A] trial registration year, [B] number of patients enrolled, [C] gender of patients enrolled, [D] trial phase, [E] recruitment status and study design, leading [F] sponsors / collaborators and leading players (in terms of number of trials conducted), [G] type of organization, [H] popular therapeutic areas and [I] regional distribution of trials.
- Publication Analysis: An insightful analysis of more than 150 peer-reviewed scientific articles related to DNA damage response targeting therapeutics, based on [A] year of publication, [B] type of publication, [C] key research hubs, [D] most popular authors, [E] provision of grant awarded, [F] target molecule, and [G] most popular journals.
KEY QUESTIONS ANSWERED IN THIS REPORT
- How many companies are currently engaged in this market?
- Which are the leading companies in this market?
- What factors are likely to influence the evolution of this market?
- What is the current and future market size?
- What is the CAGR of this market?
- How is the current and future market opportunity likely to be distributed across key market segments?
REASONS TO BUY THIS REPORT
- The report provides a comprehensive market analysis, offering detailed revenue projections of the overall market and its specific sub-segments. This information is valuable to both established market leaders and emerging entrants.
- Stakeholders can leverage the report to gain a deeper understanding of the competitive dynamics within the market. By analyzing the competitive landscape, businesses can make informed decisions to optimize their market positioning and develop effective go-to-market strategies.
- The report offers stakeholders a comprehensive overview of the market, including key drivers, barriers, opportunities, and challenges. This information empowers stakeholders to stay abreast of market trends and make data-driven decisions to capitalize on growth prospects.
ADDITIONAL BENEFITS
- Complimentary PPT Insights Packs
- Complimentary Excel Data Packs for all Analytical Modules in the Report
- 15% Free Content Customization
- Detailed Report Walkthrough Session with Research Team
- Free Updated report if the report is 6-12 months old or older
TABLE OF CONTENTS
1. PREFACE
- 1.1. Scope of the Report
- 1.2. Research Methodology
- 1.2.1. Research Assumptions
- 1.2.2. Project Methodology
- 1.2.3. Forecast Methodology
- 1.2.4. Robust Quality Control
- 1.2.5. Key Considerations
- 1.2.5.1. Demographics
- 1.2.5.2. Economic Factors
- 1.2.5.3. Government Regulations
- 1.2.5.4. Supply Chain
- 1.2.5.5. COVID Impact / Related Factors
- 1.2.5.6. Market Access
- 1.2.5.7. Healthcare Policies
- 1.2.5.8. Industry Consolidation
- 1.3 Key Questions Answered
- 1.4. Chapter Outlines
2. EXECUTIVE SUMMARY
3. INTRODUCTION
- 3.1. Chapter Overview
- 3.2. Overview of DNA Damage
- 3.3. DNA Damaging Agents
- 3.4. DNA Damage Response Systems
- 3.4.1. Key Components of DNA Repair Pathways
- 3.5. Types of DNA Repair Pathways
- 3.5.1. Direct Pathways
- 3.5.2. Excision Repair Pathway
- 3.5.2.1. Base Excision Repair Pathway
- 3.5.2.2. Nucleotide Excision Repair Pathway
- 3.5.2.3. Mismatch Repair Pathway
- 3.5.3. Indirect Pathways
- 3.5.3.1. Homologous Recombination (HR) Repair Pathway
- 3.5.3.2. Non-homologous End Joining (NHEJ) Repair Pathway
- 3.6. Concluding Remarks
4. MARKET LANDSCAPE
- 4.1. Chapter Overview
- 4.2. DNA Damage Response Targeting Therapeutics: Clinical Pipeline
- 4.2.1. Analysis by Phase of Development
- 4.2.2. Analysis by Target Disease Indication(s)
- 4.2.3. Analysis by Therapeutic Area
- 4.2.4. Analysis by Target Molecule
- 4.2.5. Analysis by Type of Molecule
- 4.2.6. Analysis by Type of Therapy
- 4.2.7. Analysis by Dosage Form
- 4.2.8. Analysis by Route of Administration
- 4.2.9. Analysis by Special Drug Designation Awarded
- 4.3. DNA Damage Response Targeting Therapeutics: Preclinical Pipeline
- 4.3.1. Analysis by Phase of Development
- 4.3.2. Analysis by Target Disease Indication(s)
- 4.3.3. Analysis by Therapeutic Area
- 4.3.4. Analysis by Type of Molecule
- 4.3.5. Analysis by Type of Therapy
- 4.4 DNA Damage Response Targeting Therapeutics: List of Developers
- 4.4.1. Analysis by Year of Establishment
- 4.4.2. Analysis by Company Size
- 4.4.3. Analysis by Location of Headquarters
- 4.4.4. Leading Developers: Analysis by Number of Proprietary Product Candidates
5. KEY INSIGHTS
- 5.1. Chapter Overview
- 5.2. Analysis by Portfolio Strength, Phase of Development and Company Size (4D Bubble Chart)
- 5.3. Analysis by Therapeutic Area and Company Size (Treemap Representation)
- 5.4. Analysis by Location of Headquarters (World Map Representation)
- 5.5. Analysis by Phase of Development, Therapeutic Area, Type of Molecule, Type of Therapy and Route of Administration (Grid Representation)
6. COMPANY PROFILES
- 6.1. Chapter Overview
- 6.2. Aprea Therapeutics
- 6.2.1. Company Overview
- 6.2.2. DNA Damage Response Targeting Therapeutics Portfolio
- 6.2.3. Recent Developments and Future Outlook
- 6.3. AstraZeneca
- 6.3.1. Company Overview
- 6.3.2. DNA Damage Response Targeting Therapeutics Portfolio
- 6.3.3. Recent Developments and Future Outlook
- 6.4. Chordia Therapeutics
- 6.4.1. Company Overview
- 6.4.2. DNA Damage Response Targeting Therapeutics Portfolio
- 6.4.3. Recent Developments and Future Outlook
- 6.5. Mission Therapeutics
- 6.5.1. Company Overview
- 6.5.2. DNA Damage Response Targeting Therapeutics Portfolio
- 6.5.3. Recent Developments and Future Outlook
- 6.6. Repare Therapeutics
- 6.6.1. Company Overview
- 6.6.2. DNA Damage Response Targeting Therapeutics Portfolio
- 6.6.3. Recent Developments and Future Outlook
- 6.7. Senhwa Biosciences
- 6.7.1. Company Overview
- 6.7.2. DNA Damage Response Targeting Therapeutics Portfolio
- 6.7.3. Recent Developments and Future Outlook
7. CLINICAL TRIALS ANALYSIS
- 7.1. Chapter Overview
- 7.2. Scope and Methodology
- 7.3. DNA Damage Response Targeting Therapeutics: Clinical Trial Analysis
- 7.3.1. Analysis by Trial Registration Year
- 7.3.2. Analysis by Number of Patients Enrolled
- 7.3.3. Analysis by Gender of Patients Enrolled
- 7.3.4. Analysis by Trial Phase
- 7.3.5. Analysis by Recruitment Status
- 7.3.6. Analysis by Study Design
- 7.3.7. Analysis by Type of Sponsor / Collaborator
- 7.3.8. Analysis by Therapeutic Area
- 7.3.9. Reginal Analysis
- 7.3.10. Case Study
- 7.3.11. Most Active Industry Players: Analysis by Number of Clinical Trails
- 7.3.12. Concluding Remarks
8. PUBLICATION ANALYSIS
- 8.1. Chapter Overview
- 8.2. Scope and Methodology
- 8.3. DNA Damage Response Targeting Therapeutics: List of Recent Publications
- 8.3.1. Analysis by Year of Publication
- 8.3.2. Analysis by Type of Publication
- 8.3.3. Emerging Focus Areas
- 8.3.4. Analysis by Key Research Journals
- 8.3.4.1. Most Prominent Journals: Analysis by Number of Publications
- 8.3.4.2. Analysis by Journal Impact Factor
- 8.3.4.3. Most Prominent Journals: Analysis by Journal Impact Factor
- 8.3.5. Analysis by Key Research Hubs
- 8.3.6. Analysis by Target Molecule
- 8.3.6.1. Most Popular Target Molecule: Analysis by Number of Publications
- 8.3.6.2. Analysis by Year and Target Molecule
- 8.3.7. Analysis by Grants Awarded
- 8.3.7.1. Locations of Grant Awarding Organizations: Analysis by Number of Publications
- 8.3.8. Publication Benchmarking Analysis
9. ANALYSIS OF KEY PARAMETERS IMPACTING DRUG PRICING AND ADOPTION
- 9.1. Chapter Overview
- 9.2. Key Market Drivers
- 9.3. Roots Analysis Framework
- 9.3.1. Benchmarking Parameters
- 9.3.2. Methodology
- 9.3.3. Impact on Price and Adoption
- 9.3.4. Impact on Pricing and Adoption of Individual Drugs / Drug Candidates
- 9.3.4.1. Adavosertib
- 9.3.4.2. APX3330
- 9.3.4.3. ASLAN003
- 9.3.4.4. CBP-501
- 9.3.4.5. Eprenetapopt
- 9.3.4.6. Irofulven
- 9.3.4.7. LB-100
- 9.3.4.8. Silmitasertib
- 9.3.4.9. TRC-102
- 9.3.5. Concluding Remarks
10. MARKET FORECAST
- 10.1. Chapter Overview
- 10.2. Scope and Limitations
- 10.3. Forecast Methodology and Key Assumptions
- 10.4. Global DNA Damage Response Targeting Therapeutics Market, Till 2035
- 10.4.1. DNA Damage Response Targeting Therapeutics Market: Distribution by Target Disease Indication
- 10.4.1.1. DNA Damage Response Targeting Therapeutics Market for Acute Myeloid Leukemias, Till 2035
- 10.4.1.2. DNA Damage Response Targeting Therapeutics Market for COVID-19, Till 2035
- 10.4.1.3. DNA Damage Response Targeting Therapeutics Market for Diabetic Macular Edemas, Till 2035
- 10.4.1.4. DNA Damage Response Targeting Therapeutics Market for Mesotheliomas, Till 2035
- 10.4.1.5. DNA Damage Response Targeting Therapeutics Market for Myelodysplastic Syndromes, Till 2035
- 10.4.1.6. DNA Damage Response Targeting Therapeutics Market for Non-Squamous Non-Small Cell Lung Cancers, Till 2035
- 10.4.1.7. DNA Damage Response Targeting Therapeutics Market for Prostate Cancers, Till 2035
- 10.4.1.8. DNA Damage Response Targeting Therapeutics Market for Uterine Serous Carcinomas, Till 2035
- 10.4.2. DNA Damage Response Targeting Therapeutics Market: Distribution by Therapeutic Area
- 10.4.2.1. DNA Damage Response Targeting Therapeutics Market for Hematological Malignancies, Till 2035
- 10.4.2.2. DNA Damage Response Targeting Therapeutics Market for Solid Tumors, Till 2035
- 10.4.2.3. DNA Damage Response Targeting Therapeutics Market for Other Disorders, Till 2035
- 10.4.3. DNA Damage Response Targeting Therapeutics Market: Distribution by Target Molecule
- 10.4.3.1. DNA Damage Response Targeting Therapeutics Market for APE1/Ref-1, Till 2035
- 10.4.3.2. DNA Damage Response Targeting Therapeutics Market for Casein Kinase 2, Till 2035
- 10.4.3.3. DNA Damage Response Targeting Therapeutics Market for CHK-1, Till 2035
- 10.4.3.4. DNA Damage Response Targeting Therapeutics Market for C-Tak, Till 2035
- 10.4.3.5. DNA Damage Response Targeting Therapeutics Market for DHODH, Till 2035
- 10.4.3.6. DNA Damage Response Targeting Therapeutics Market for MAPKAPK2, Till 2035
- 10.4.3.7. DNA Damage Response Targeting Therapeutics Market for p53, Till 2035
- 10.4.3.8. DNA Damage Response Targeting Therapeutics Market for Protein Phosphatase 2A, Till 2035
- 10.4.3.9. DNA Damage Response Targeting Therapeutics Market for WEE1, Till 2035
- 10.4.4. DNA Damage Response Targeting Therapeutics Market: Distribution by Type of Molecule
- 10.4.4.1. DNA Damage Response Targeting Therapeutics Market for Biologics, Till 2035
- 10.4.4.2. DNA Damage Response Targeting Therapeutics Market for Small Molecules, Till 2035
- 10.4.5. DNA Damage Response Targeting Therapeutics Market: Distribution by Route of Administration
- 10.4.5.1. DNA Damage Response Targeting Therapeutics Market for Oral Drugs, Till 2035
- 10.4.5.2. DNA Damage Response Targeting Therapeutics Market for Intravenous Drugs, Till 2035
- 10.4.6. DNA Damage Response Targeting Therapeutics Market: Distribution by Geography
- 10.4.6.1. DNA Damage Response Targeting Therapeutics Market in the US, Till 2035
- 10.4.6.2. DNA Damage Response Targeting Therapeutics Market in Canada, Till 2035
- 10.4.6.3. DNA Damage Response Targeting Therapeutics Market in Denmark, Till 2035
- 10.4.6.4. DNA Damage Response Targeting Therapeutics Market in France, Till 2035
- 10.4.6.5. DNA Damage Response Targeting Therapeutics Market in Germany, Till 2035
- 10.4.6.6. DNA Damage Response Targeting Therapeutics Market in Italy, Till 2035
- 10.4.6.7. DNA Damage Response Targeting Therapeutics Market in Spain, Till 2035
- 10.4.6.8. DNA Damage Response Targeting Therapeutics Market in the UK, Till 2035
- 10.4.6.9. DNA Damage Response Targeting Therapeutics Market in Australia, Till 2035
- 10.4.6.10. DNA Damage Response Targeting Therapeutics Market in Singapore, Till 2035
- 10.4.6.11. DNA Damage Response Targeting Therapeutics Market in South Korea, Till 2035
- 10.4.7. Drug-wise Sales Forecast
- 10.4.7.1 Adavosertib (AZD1775, MK-1775), AstraZeneca
- 10.4.7.1.1. Target Patient Population
- 10.4.7.1.2. Sales Forecast
- 10.4.7.1.3. Net Present Value
- 10.4.7.1.4. Value Creation Analysis
- 10.4.7.2. APX3330, Apexian Pharmaceuticals
- 10.4.7.2.1. Target Patient Population
- 10.4.7.2.2. Sales Forecast
- 10.4.7.2.3. Net Present Value
- 10.4.7.2.4. Value Creation Analysis
- 10.4.7.3. ASLAN003 (LAS 186323), Aslan Pharmaceuticals
- 10.4.7.3.1. Target Patient Population
- 10.4.7.3.2. Sales Forecast
- 10.4.7.3.3. Net Present Value
- 10.4.7.3.4. Value Creation Analysis
- 10.4.7.4. CBP-501, CanBas
- 10.4.7.4.1. Target Patient Population
- 10.4.7.4.2. Sales Forecast
- 10.4.7.4.3. Net Present Value
- 10.4.7.4.4. Value Creation Analysis
- 10.4.7.5. Eprenetapopt, Aprea Therapeutics
- 10.4.7.5.1. Target Patient Population
- 10.4.7.5.2. Sales Forecast
- 10.4.7.5.3. Net Present Value
- 10.4.7.5.4. Value Creation Analysis
- 10.4.7.6. Irofulven, Allarity Therapeutics
- 10.4.7.6.1. Target Patient Population
- 10.4.7.6.2. Sales Forecast
- 10.4.7.6.3. Net Present Value
- 10.4.7.6.4. Value Creation Analysis
- 10.4.7.7. LB-100 (Lixte Biotechnology)
- 10.4.7.7.1. Target Patient Population
- 10.4.7.7.2. Sales Forecast
- 10.4.7.7.3. Net Present Value
- 10.4.7.7.4. Value Creation Analysis
- 10.4.7.8. Silmitasertib, Senhwa Biosciences
- 10.4.7.8.1. Target Patient Population
- 10.4.7.8.2. Sales Forecast
- 10.4.7.8.3. Net Present Value
- 10.4.7.8.4. Value Creation Analysis
- 10.4.7.1 Adavosertib (AZD1775, MK-1775), AstraZeneca
- 10.4.9 Concluding Remarks
- 10.4.1. DNA Damage Response Targeting Therapeutics Market: Distribution by Target Disease Indication
11. CONCLUDING REMARKS
12. APPENDIX I: TABULATED DATA
13. APPENDIX II: LIST OF COMPANIES AND ORGANIZATION
List of Tables
- Table 3.1 Key Components of DNA Repair System
- Table 3.2 Comparison of HRR and NHEJ DNA Damage Repair Pathways
- Table 3.3 DNA Damage Repair Related Inherited Mutations
- Table 4.1 DNA Damage Response Targeting Therapeutics (Clinical Pipeline): Information on Phase of Development, Target Disease Indication(s), and Therapeutic Area
- Table 4.2 DNA Damage Response Targeting Therapeutics (Clinical Pipeline): Information on Target Molecule, Type of Molecule, and Type of Therapy
- Table 4.3 DNA Damage Response Targeting Therapeutics (Clinical Pipeline): Information on Dosage Form, Route of Administration, and Special Drug Designation Awarded
- Table 4.4 DNA Damage Response Targeting Therapeutics (Preclinical Pipeline): Information on Phase of Development, Target Disease Indication(s), and Therapeutic Area
- Table 4.5 DNA Damage Response Targeting Therapeutics (Preclinical Pipeline): Information on Target Molecule, Type of Molecule, Type of Therapy and Dosage Form
- Table 4.6 DNA Damage Response Targeting Therapeutics: List of Drug Developers
- Table 6.1 DNA Damage Response Targeting Therapeutics: List of Companies Profiled
- Table 6.2 Aprea Therapeutics: Company Overview
- Table 6.3 Aprea Therapeutics: DNA Damage Response Targeting Therapeutics Portfolio
- Table 6.4 Aprea Therapeutics: Recent Developments and Future Outlook
- Table 6.5 AstraZeneca: Company Overview
- Table 6.6 AstraZeneca: DNA Damage Response Targeting Therapeutics Portfolio
- Table 6.7 AstraZeneca: Recent Developments and Future Outlook
- Table 6.8 Chordia Therapeutics: Company Overview
- Table 6.9 Chordia Therapeutics: DNA Damage Response Targeting Therapeutics Portfolio
- Table 6.10 Chordia Therapeutics: Recent Developments and Future Outlook
- Table 6.11 Mission Therapeutics: Company Overview
- Table 6.12 Mission Therapeutics: DNA Damage Response Targeting Therapeutics Portfolio
- Table 6.13 Mission Therapeutics: Recent Developments and Future Outlook
- Table 6.14 Repare Therapeutics: Company Overview
- Table 6.15 Repare Therapeutics: DNA Damage Response Targeting Therapeutics Portfolio
- Table 6.16 Repare Therapeutics: Recent Developments and Future Outlook
- Table 6.17 Senhwa Biosciences: Company Overview
- Table 6.18 Senhwa Biosciences: DNA Damage Response Targeting Therapeutics Portfolio
- Table 6.19 Senhwa Biosciences: Recent Developments and Future Outlook
- Table 8.1 List of Recent Publications, Since 2020
- Table 8.2 Publication Analysis: List of Most Valued Publications
- Table 10.1 DNA Damage Response Targeting Therapeutics: Promising Drug Candidates
- Table 10.2 DNA Damage Response Targeting Therapeutics Forecast Assumptions: Price Estimations in Key Geographies
- Table 10.3 Adavosertib (AZD1775, MK-1775), AstraZeneca: Target Patient Population
- Table 10.4 Adavosertib (AZD1775, MK-1775), AstraZeneca: Net Present Value (USDMillion)
- Table 10.5 Adavosertib (AZD1775, MK-1775), AstraZeneca: Value Creation Analysis (USDMillion)
- Table 10.6 ASLAN003 (LAS 186323, Aslan Pharmaceuticals: Target Patient Population
- Table 10.7 ASLAN003 (LAS 186323, Aslan Pharmaceuticals: Net Present Value (USDMillion)
- Table 10.8 ASLAN003 (LAS 186323, Aslan Pharmaceuticals: Value Creation Analysis (USD Million)
- Table 10.9 CBP-501, CanBas: Target Patient Population
- Table 10.10 CBP-501, CanBas: Net Present Value (USD Million)
- Table 10.11 CBP-501, CanBas: Value Creation Analysis (USD Million)
- Table 10.12 Eprenetapopt (APR-246), Aprea Therapeutics: Target Patient Population
- Table 10.13 Eprenetapopt (APR-246), Aprea Therapeutics: Net Present Value (USD Million)
- Table 10.14 Eprenetapopt, (APR-246) Aprea Therapeutics: Value Creation Analysis (USD Million)
- Table 10.15 Irofulven, Allarity Therapeutics: Target Patient Population
- Table 10.16 Irofulven, Allarity Therapeutics: Net Present Value (USD Million)
- Table 10.17 Irofulven, Allarity Therapeutics: Value Creation Analysis (USD Million)
- Table 10.18 LB-100, Lixte Biotechnology: Target Patient Population
- Table 10.19 LB-100, Lixte Biotechnology: Net Present Value (USD Million)
- Table 10.20 LB-100, Lixte Biotechnology: Value Creation Analysis (USD Million)
- Table 10.21 Sapacitabine, Cyclacel Pharmaceuticals: Target Patient Population
- Table 10.22 Sapacitabine, Cyclacel Pharmaceuticals: Net Present Value (USD Million)
- Table 10.23 Sapacitabine, Cyclacel Pharmaceuticals: Value Creation Analysis (USD Million)
- Table 10.24 Silmitasertib, Senhwa Biosciences: Target Patient Population
- Table 10.25 Silmitasertib, Senhwa Biosciences: Net Present Value (USD Million)
- Table 10.26 Silmitasertib, Senhwa Biosciences: Value Creation Analysis (USD Million)
- Table 10.27 TRC-102, TRACON Pharmaceuticals: Target Patient Population
- Table 10.28 TRC-102, TRACON Pharmaceuticals: Net Present Value (USD Million)
- Table 10.29 TRC-102, TRACON Pharmaceuticals: Value Creation Analysis (USD Million)
- Table 12.1 DNA Damage Response Targeting Therapeutics (Clinical-stage Drug Candidates): Distribution by Phase of Development
- Table 12.2 DNA Damage Response Targeting Therapeutics (Clinical-stage Drug Candidates): Distribution by Target Disease Indication(s)
- Table 12.3 DNA Damage Response Targeting Therapeutics (Clinical-stage Drug Candidates): Distribution by Phase of Development and Target Disease Indication(s)
- Table 12.4 DNA Damage Response Targeting Therapeutics (Clinical-stage Drug Candidates): Distribution by Therapeutic Area
- Table 12.5 DNA Damage Response Targeting Therapeutics (Clinical-stage Drug Candidates): Distribution by Phase of Development and Therapeutic Area
- Table 12.6 DNA Damage Response Targeting Therapeutics (Clinical-stage Drug Candidates): Distribution by Target Molecule
- Table 12.7 DNA Damage Response Targeting Therapeutics (Clinical-stage Drug Candidates): Distribution by Phase of Development and Target Molecule
- Table 12.8 DNA Damage Response Targeting Therapeutics (Clinical-stage Drug Candidates): Distribution by Type of Molecule
- Table 12.9 DNA Damage Response Targeting Therapeutics (Clinical-stage Drug Candidates): Distribution by Target Molecule and Type of Molecule
- Table 12.10 DNA Damage Response Targeting Therapeutics (Clinical-stage Drug Candidates): Distribution by Type of Therapy
- Table 12.11 DNA Damage Response Targeting Therapeutics (Clinical-stage Drug Candidates): Distribution by Dosage Form
- Table 12.12 DNA Damage Response Targeting Therapeutics (Clinical-stage Drug Candidates): Distribution by Route of Administration
- Table 12.13 DNA Damage Response Targeting Therapeutics (Preclinical-stage Drug Candidates): Distribution by Phase of Development
- Table 12.14 DNA Damage Response Targeting Therapeutics (Preclinical-stage Drug Candidates): Distribution by Target Disease Indication(s)
- Table 12.15 DNA Damage Response Targeting Therapeutics: (Preclinical-stage Drug Candidates) Distribution by Phase of Development and Target Disease Indication(s)
- Table 12.16 DNA Damage Response Targeting Therapeutics (Preclinical-stage Drug Candidates): Distribution by Therapeutic Area
- Table 12.17 DNA Damage Response Targeting Therapeutics (Preclinical-stage Drug Candidates): Distribution by Phase of Development and Therapeutic Area
- Table 12.18 DNA Damage Response Targeting Therapeutics (Preclinical-stage Drug Candidates): Distribution by Type of Therapy
- Table 12.19 DNA Damage Response Targeting Therapeutics (Preclinical-stage Drug Candidates): Distribution by Dosage Form
- Table 12.20 DNA Damage Response Targeting Therapeutics Developers: Distribution by Year of Establishment
- Table 12.21 DNA Damage Response Targeting Therapeutics Developers: Distribution by Company Size
- Table 12.22 DNA Damage Response Targeting Therapeutics Developers: Distribution by Location of Headquarters
- Table 12.23 Leading Developers: Distribution by Number of DNA Damage Response Targeting Therapeutics
- Table 12.24 4D Bubble Analysis: Distribution by Portfolio Strength, Target Molecule, Phase of Development and Company Size
- Table 12.25 Treemap Representation: Distribution by Therapeutic Area and Company Size
- Table 12.26 World Map Representation: Distribution by Location of Headquarters
- Table 12.27 Grid Representation: Distribution by Phase of Development, Therapeutic Area, Type of Molecule, Type of Therapy and Route of Administration
- Table 12.28 Clinical Trial Analysis: Cumulative Distribution of Trials by Registration Year, Since 2011
- Table 12.29 Clinical Trial Analysis: Distribution of Number of Patients Enrolled by Registration Year, Since 2011
- Table 12.30 Clinical Trial Analysis: Distribution of Patients Enrolled by Gender
- Table 12.31 Clinical Trial Analysis: Distribution by Trial Phase
- Table 12.32 Clinical Trial Analysis: Distribution by Year wise Distribution by Trial Phase
- Table 12.33 Clinical Trial Analysis: Distribution of Patients Enrolled by Trial Phase
- Table 12.34 Clinical Trial Analysis: Year wise Distribution of Patients Enrolled by Trial Phase
- Table 12.35 Clinical Trial Analysis: Year wise Distribution by Trial Phase and Average Completion Time
- Table 12.36 Clinical Trial Analysis: Distribution by Recruitment Status
- Table 12.37 Clinical Trial Analysis: Cumulative Year-wise Trend by Recruitment Status
- Table 12.38 Clinical Trial Analysis: Distribution by Study Design
- Table 12.39 Clinical Trial Analysis: Distribution by Type of Sponsor / Collaborator
- Table 12.40 Clinical Trial Analysis: Distribution by Therapeutic Area
- Table 12.41 Clinical Trial Analysis: Year wise Distribution by Most Popular Therapeutic Areas
- Table 12.42 Clinical Trial Analysis: Cumulative Year wise Trend of Patients Enrolled by Most Popular Therapeutic Areas
- Table 12.43 Clinical Trial Analysis: Distribution by Therapeutic Area and Average Completion Time
- Table 12.44 Clinical Trial Analysis: Regional Distribution of Patients Enrolled by Gender
- Table 12.45 Clinical Trial Analysis: Regional Distribution by Trial Phase and Average Completion Time
- Table 12.46 Clinical Trial Analysis: Regional Distribution by Therapeutic Area and Average Completion Time
- Table 12.47 Clinical Trial Analysis: Regional Distribution by Patients Enrolled
- Table 12.48 Clinical Trial Analysis: Regional Distribution by Average Completion Time
- Table 12.49 Clinical Trial Analysis: Year wise Distribution by Trial Phase and Average Completion Time
- Table 12.50 Leading Industry Players: Distribution by Number of Clinical Trials
- Table 12.51 Clinical Trial Analysis: Concluding Remarks
- Table 12.52 Publications Analysis: Distribution by Year of Publication
- Table 12.53 Publications Analysis: Distribution by Type of Publication
- Table 12.54 Key Journals: Distribution by Number of Publications
- Table 12.55 Publications Analysis: Distribution by Journal Impact Factor
- Table 12.56 Key Journals: Distribution by Journal Impact Factor
- Table 12.57 Key Research Hubs: Distribution by Number of Publications
- Table 12.58 Publications Analysis: Distribution by Target Molecule
- Table 12.59 Publications Analysis: Distribution by Year wise Distribution by Most Popular Target Molecules
- Table 12.60 Locations of Grant Awarding Organizations: Distribution by Number of Publications
- Table 12.61 Global DNA Damage Response Targeting Therapeutics Market, Conservative, Base and Optimistic Scenarios, Till 2035 (USD Million)
- Table 12.62 DNA Damage Response Targeting Therapeutics Market: Distribution by Target Disease Indication
- Table 12.63 DNA Damage Response Targeting Therapeutics Market for Acute Myeloid Leukemias, Conservative, Base and Optimistic Scenarios, Till 2035 (USD Million)
- Table 12.64 DNA Damage Response Targeting Therapeutics Market for COVID-19, Conservative, Base and Optimistic Scenarios, Till 2035 (USD Million)
- Table 12.65 DNA Damage Response Targeting Therapeutics Market for Diabetic Macular Edemas, Conservative, Base and Optimistic Scenarios, Till 2035 (USD Million)
- Table 12.66 DNA Damage Response Targeting Therapeutics Market for Mesotheliomas, Conservative, Base and Optimistic Scenarios, Till 2035 (USD Million)
- Table 12.67 DNA Damage Response Targeting Therapeutics Market for Myelodysplastic Syndromes, Conservative, Base and Optimistic Scenarios, Till 2035 (USD Million)
- Table 12.68 DNA Damage Response Targeting Therapeutics Market for Non-Squamous Non-Small Cell Lung Cancers, Conservative, Base and Optimistic Scenarios, Till 2035 (USD Million)
- Table 12.69 DNA Damage Response Targeting Therapeutics Market for Prostate Cancers, Conservative, Base and Optimistic Scenarios, Till 2035 (USD Million)
- Table 12.70 DNA Damage Response Targeting Therapeutics Market for Uterine Serous Carcinomas, Conservative, Base and Optimistic Scenarios, Till 2035 (USD Million)
- Table 12.71 Global DNA Damage Response Targeting Therapeutics Market: Distribution by Therapeutic Area
- Table 12.72 DNA Damage Response Targeting Therapeutics Market for Hematological Malignancies, Conservative, Base and Optimistic Scenarios, Till 2035 (USD Million)
- Table 12.73 DNA Damage Response Targeting Therapeutics Market for Solid Tumors, Conservative, Base and Optimistic Scenarios, Till 2035 (USD Million)
- Table 12.74 DNA Damage Response Targeting Therapeutics Market for Other Disorders, Conservative, Base and Optimistic Scenarios, Till 2035 (USD Million)
- Table 12.75 Global DNA Damage Response Targeting Therapeutics Market: Distribution by Target Molecule
- Table 12.76 Damage Response Targeting Therapeutics Market for APE1/Ref-1, Conservative, Base and Optimistic Scenarios, Till 2035 (USD Million)
- Table 12.77 Damage Response Targeting Therapeutics Market for Casein Kinase 2, Conservative, Base and Optimistic Scenarios, Till 2035 (USD Million)
- Table 12.78 Damage Response Targeting Therapeutics Market for CHK-1, Conservative, Base and Optimistic Scenarios, Till 2035 (USD Million)
- Table 12.79 Damage Response Targeting Therapeutics Market for C-Tak, Conservative, Base and Optimistic Scenarios, Till 2035 (USD Million)
- Table 12.80 Damage Response Targeting Therapeutics Market for DHODH, Conservative, Base and Optimistic Scenarios, Till 2035 (USD Million)
- Table 12.81 Damage Response Targeting Therapeutics Market for MAPKAPK2, Conservative, Base and Optimistic Scenarios, Till 2035 (USD Million)
- Table 12.82 Damage Response Targeting Therapeutics Market for p53, Conservative, Base and Optimistic Scenarios, Till 2035 (USD Million)
- Table 12.83 Damage Response Targeting Therapeutics Market for Protein Phosphatase 2A Market, Conservative, Base and Optimistic Scenarios, Till 2035 (USD Million)
- Table 12.84 Damage Response Targeting Therapeutics Market for WEE 1, Conservative, Base and Optimistic Scenarios, Till 2035 (USD Million)
- Table 12.85 Global DNA Damage Response Targeting Therapeutics Market: Distribution by Type of Molecule
- Table 12.86 DNA Damage Response Targeting Therapeutics Market for Biologics, Conservative, Base and Optimistic Scenarios, Till 2035 (USD Million)
- Table 12.87 DNA Damage Response Targeting Therapeutics Market for Small Molecules, Conservative, Base and Optimistic Scenarios, Till 2035 (USD Million)
- Table 12.88 Global DNA Damage Response Targeting Therapeutics Market: Distribution by Route of Administration
- Table 12.89 DNA Damage Response Targeting Therapeutics Market for Oral Drugs, Conservative, Base and Optimistic Scenarios, Till 2035 (USD Million)
- Table 12.90 DNA Damage Response Targeting Therapeutics Market for Intravenous Drugs, Conservative, Base and Optimistic Scenarios, Till 2035 (USD Million)
- Table 12.91 Global DNA Damage Response Targeting Therapeutics Market: Distribution by Geography
- Table 12.92 DNA Damage Response Targeting Therapeutics Market in the US, Conservative, Base and Optimistic Scenarios, Till 2035 (USD Million)
- Table 12.93 DNA Damage Response Targeting Therapeutics Market in the Canada, Conservative, Base and Optimistic Scenarios, Till 2035 (USD Million)
- Table 12.94 DNA Damage Response Targeting Therapeutics Market in the Denmark, Conservative, Base and Optimistic Scenarios, Till 2035 (USD Million)
- Table 12.95 DNA Damage Response Targeting Therapeutics Market in France, Conservative, Base and Optimistic Scenarios, Till 2035 (USD Million)
- Table 12.96 DNA Damage Response Targeting Therapeutics Market in Germany, Conservative, Base and Optimistic Scenarios, Till 2035 (USD Million)
- Table 12.97 DNA Damage Response Targeting Therapeutics Market in Italy, Conservative, Base and Optimistic Scenarios, Till 2035 (USD Million)
- Table 12.98 DNA Damage Response Targeting Therapeutics Market in Spain, Conservative, Base and Optimistic Scenarios, Till 2035 (USD Million)
- Table 12.99 DNA Damage Response Targeting Therapeutics Market in the UK, Conservative, Base and Optimistic Scenarios, Till 2035 (USD Million)
- Table 12.100 DNA Damage Response Targeting Therapeutics Market in Australia, Conservative, Base and Optimistic Scenarios, Till 2035 (USD Million)
- Table 12.101 DNA Damage Response Targeting Therapeutics Market in Singapore, Conservative, Base and Optimistic Scenarios, Till 2035 (USD Million)
- Table 12.102 DNA Damage Response Targeting Therapeutics Market in South Korea, Conservative, Base and Optimistic Scenarios, Till 2035 (USD Million)
- Table 12.103 Adavosertib (AZD1775, MK-1775), AstraZeneca: Sales Forecast, till 2030, Conservative, Base and Optimistic Scenarios (USD Million)
- Table 12.104 APX3330, Apexian Pharmaceuticals: Sales Forecast, till 2030, Conservative, Base and Optimistic Scenarios, Till 2035 (USD Million)
- Table 12.105 ASLAN003 (LAS 186323), Aslan Pharmaceuticals: Sales Forecast, till 2030, Conservative, Base and Optimistic Scenarios, Till 2035 (USD Million)
- Table 12.106 CBP-501, CanBas: Sales Forecast, till 2030, Conservative, Base and Optimistic Scenarios, Till 2035 (USD Million)
- Table 12.107 Eprenetapopt, Aprea Therapeutics: Sales Forecast, till 2030, Conservative, Base and Optimistic Scenarios, Till 2035 (USD Million)
- Table 12.108 Irofulven, Allarity Therapeutics: Sales Forecast, till 2030, Conservative, Base and Optimistic Scenarios, Till 2035 (USD Million)
- Table 12.109 LB-100, Lixte Biotechnology: Sales Forecast, till 2030, Conservative, Base and Optimistic Scenarios, Till 2035 (USD Million)
- Table 12.110 Silmitasertib, Senhwa Biosciences: Sales Forecast, till 2030, Conservative, Base and Optimistic Scenarios, Till 2035 (USD Million)
- Table 12.111 Global DNA Damage Response Targeting Therapeutics Market, Conservative, Base and Optimistic Scenarios, Till 2035: Conservative, Base and Optimistic Scenarios (USD Million)
List of Figures
- Figure 3.1 Type of DNA Damage
- Figure 3.2 Types of Causative Agents for DNA Damage
- Figure 3.3 DNA Damage Causative Agents and Associated Repair System
- Figure 3.4 DNA Damage Response System
- Figure 3.5 Direct DNA Damage Repair Systems
- Figure 3.6 Key Steps Involved in Base Excision Repair Pathway
- Figure 3.7 Key Steps Involved in Nucleotide Excision Repair Pathway
- Figure 3.8 Key Steps Involved in Mismatch Repair Pathway
- Figure 3.9 Key Steps Involved in Homologous Recombination Repair Pathway
- Figure 3.10 Key Steps Involved in Non-Homologous Repair Pathway
- Figure 4.1 DNA Damage Response Targeting Therapeutics (Clinical-stage Drug Candidates): Distribution by Phase of Development
- Figure 4.2 DNA Damage Response Targeting Therapeutics (Clinical-stage Drug Candidates): Distribution by Target Disease Indication(s)
- Figure 4.3 DNA Damage Response Targeting Therapeutics (Clinical-stage Drug Candidates): Distribution by Phase of Development and Target Disease Indication(s)
- Figure 4.4 DNA Damage Response Targeting Therapeutics (Clinical-stage Drug Candidates): Distribution by Therapeutic Area
- Figure 4.5 DNA Damage Response Targeting Therapeutics (Clinical-stage Drug Candidates): Distribution Phase of Development and Therapeutic Area
- Figure 4.6 DNA Damage Response Targeting Therapeutics (Clinical-stage Drug Candidates): Distribution by Target Molecule
- Figure 4.7 DNA Damage Response Targeting Therapeutics (Clinical-stage Drug Candidates): Distribution by Phase of Development and Target Molecule
- Figure 4.8 DNA Damage Response Targeting Therapeutics (Clinical-stage Drug Candidates): Distribution by Type of Molecule
- Figure 4.9 DNA Damage Response Targeting Therapeutics (Clinical-stage Drug Candidates): Distribution by Target Molecule and Type of Molecule
- Figure 4.10 DNA Damage Response Targeting Therapeutics (Clinical-stage Drug Candidates): Distribution by Type of Therapy
- Figure 4.11 DNA Damage Response Targeting Therapeutics (Clinical-stage Drug Candidates): Distribution by Dosage Form
- Figure 4.12 DNA Damage Response Targeting Therapeutics (Clinical-stage Drug Candidates): Distribution by Route of Administration
- Figure 4.13 DNA Damage Response Targeting Therapeutics (Clinical-stage Drug Candidates): Distribution by Special Drug Designation Awarded
- Figure 4.14 DNA Damage Response Targeting Therapeutics (Preclinical-stage Drug Candidates): Distribution by Phase of Development
- Figure 4.15 DNA Damage Response Targeting Therapeutics (Preclinical-stage Drug Candidates): Distribution by Target Disease Indication(s)
- Figure 4.16 DNA Damage Response Targeting Therapeutics (Preclinical-stage Drug Candidates): Distribution by Phase of Development and Target Disease Indication(s)
- Figure 4.17 DNA Damage Response Targeting Therapeutics (Preclinical-stage Drug Candidates): Distribution by Therapeutic Area
- Figure 4.18 DNA Damage Response Targeting Therapeutics (Preclinical-stage Drug Candidates): Distribution by Phase of Development and Therapeutic Area
- Figure 4.19 DNA Damage Response Targeting Therapeutics (Preclinical-stage Drug Candidates): Distribution by Type of Therapy
- Figure 4.20 DNA Damage Response Targeting Therapeutics (Preclinical-stage Drug Candidates): Distribution by Dosage Form
- Figure 4.21 DNA Damage Response Targeting Therapeutics Developers: Distribution by Year of Establishment
- Figure 4.22 DNA Damage Response Targeting Therapeutics Developers: Distribution by Company Size
- Figure 4.23 DNA Damage Response Targeting Therapeutics Developers: Distribution by Location of Headquarters
- Figure 4.24 Leading Developers: Distribution by Number of DNA Damage Response Targeting Therapeutics
- Figure 5.1 4D Bubble Representation: Distribution by Portfolio Strength, Target Molecule, Phase of Development and Company Size
- Figure 5.2 Treemap Representation: Distribution by Therapeutic Area and Company Size
- Figure 5.3 World Map Representation: Distribution by Location of Headquarters
- Figure 5.4 Grid Representation: Distribution by Phase of Development, Therapeutic Area, Type of Molecule, Type of Therapy and Route of Administration
- Figure 7.1 Clinical Trial Analysis: Scope and Methodology
- Figure 7.2 Clinical Trial Analysis: Cumulative Distribution of Trials by Registration Year, Since 2011
- Figure 7.3 Clinical Trial Analysis: Distribution of Number of Patients Enrolled by Registration Year, Since 2011
- Figure 7.4 Clinical Trial Analysis: Distribution of Patients Enrolled by Gender
- Figure 7.5 Clinical Trial Analysis: Distribution by Trial Phase
- Figure 7.6 Clinical Trial Analysis: Year wise Distribution by Trial Phase
- Figure 7.7 Clinical Trial Analysis: Distribution of Patients Enrolled by Trial Phase
- Figure 7.8 Clinical Trial Analysis: Year wise Distribution of Patients Enrolled by Trial Phase
- Figure 7.9 Clinical Trial Analysis: Year wise Distribution by Trial Phase and Average Completion Time
- Figure 7.10 Clinical Trial Analysis: Distribution by Recruitment Status
- Figure 7.11 Clinical Trial Analysis: Cumulative Year wise Distribution by Recruitment Status
- Figure 7.12 Clinical Trial Analysis: Distribution by Study Design
- Figure 7.13 Clinical Trial Analysis: Distribution by Type of Sponsor / Collaborator
- Figure 7.14 Clinical Trial Analysis: Distribution by Therapeutic Area
- Figure 7.15 Clinical Trial Analysis: Year wise Distribution by Most Popular Therapeutic Areas
- Figure 7.16 Clinical Trial Analysis: Cumulative Year wise Trend of Patients Enrolled by Most Popular Therapeutic Areas
- Figure 7.17 Clinical Trial Analysis: Distribution by Therapeutic Area and Average Completion Time
- Figure 7.18 Clinical Trial Analysis: Regional Distribution
- Figure 7.19 Clinical Trial Analysis: Regional Distribution by Trial Phase and Average Completion Time
- Figure 7.20 Clinical Trial Analysis: Regional Distribution by Therapeutic Area and Average Completion Time
- Figure 7.21 Clinical Trial Analysis: Regional Distribution by Patients Enrolled
- Figure 7.22 Clinical Trial Analysis: Regional Distribution by Average Completion Time
- Figure 7.23 Clinical Trial Analysis: Year wise Distribution by Trial Phase and Average Completion Time
- Figure 7.24 Leading Industry Players: Distribution by Number of Clinical Trials
- Figure 7.25 Clinical Trial Analysis: Concluding Remarks
- Figure 8.1 Publications Analysis: Methodology
- Figure 8.2 Publications Analysis: Distribution by Year of Publication
- Figure 8.3 Publications Analysis: Distribution by Type of Publication
- Figure 8.4 Publications Analysis: Emerging Focus Areas
- Figure 8.5 Key Journals: Distribution by Number of Publications
- Figure 8.6 Publications Analysis: Distribution by Journal Impact Factor
- Figure 8.7 Key Journals: Distribution by Journal Impact Factor
- Figure 8.8 Key Research Hubs: Distribution by Number of Publications
- Figure 8.9 Publications Analysis: Distribution by Target Molecule
- Figure 8.10 Publications Analysis: Year wise Distribution by Most Popular Target Molecules
- Figure 8.11 Locations of Grant Awarding Organizations: Distribution by Number of Publications
- Figure 8.12 Publications Analysis: Multivariate Benchmark Analysis
- Figure 9.1 Key Parameters Impacting Drug Pricing and Adoption
- Figure 9.2 Adavosertib (AZD1775) (MK-1775)
- Figure 9.3 APX3330
- Figure 9.4 ASLAN003
- Figure 9.5 CBP-501
- Figure 9.5 Eprenetapopt
- Figure 9.6 Irofulven
- Figure 9.7 LB-100
- Figure 9.8 Silmitasertib
- Figure 9.9 TRC-102
- Figure 10.1 Global DNA Damage Response Targeting Therapeutics Market, Conservative, Base and Optimistic Scenarios, Till 2035 (USD Million)
- Figure 10.2 DNA Damage Response Targeting Therapeutics Market: Distribution by Target Disease Indication
- Figure 10.3 DNA Damage Response Targeting Therapeutics Market for Acute Myeloid Leukemias, Till 2035 (USD Million)
- Figure 10.4 DNA Damage Response Targeting Therapeutics Market for COVID-19, Till 2035 (USD Million)
- Figure 10.5 DNA Damage Response Targeting Therapeutics Market for Diabetic Macular Edemas, Till 2035 (USD Million)
- Figure 10.6 DNA Damage Response Targeting Therapeutics Market for Mesotheliomas, Till 2035 (USD Million)
- Figure 10.7 DNA Damage Response Targeting Therapeutics Market for Myelodysplastic Syndromes, Till 2035 (USD Million)
- Figure 10.8 DNA Damage Response Targeting Therapeutics Market for Non-Squamous Non-Small Cell Lung Cancers, Till 2035 (USD Million)
- Figure 10.9 DNA Damage Response Targeting Therapeutics Market for Prostate Cancer, Till 2035 (USD Million)
- Figure 10.10 DNA Damage Response Targeting Therapeutics Market for Uterine Serous Carcinomas, Till 2035 (USD Million)
- Figure 10.11 Global DNA Damage Response Targeting Therapeutics Market: Distribution by Therapeutic Area
- Figure 10.12 DNA Damage Response Targeting Therapeutics Market for Hematological Malignancies, Till 2035 (USD Million)
- Figure 10.13 DNA Damage Response Targeting Therapeutics Market for Solid Tumors, Till 2035 (USD Million)
- Figure 10.14 DNA Damage Response Targeting Therapeutics Market for Other Disorders, Till 2035 (USD Million)
- Figure 10.15 Global DNA Damage Response Targeting Therapeutics Market: Distribution by Target Molecule
- Figure 10.16 DNA Damage Response Targeting Therapeutics Market for APE1/Ref-1, Till 2035 (USD Million)
- Figure 10.17 DNA Damage Response Targeting Therapeutics Market for Casein Kinase 2, Till 2035 (USD Million)
- Figure 10.18 DNA Damage Response Targeting Therapeutics Market for CHK-1, Till 2035 (USD Million)
- Figure 10.19 DNA Damage Response Targeting Therapeutics Market for C-Tak, Till 2035 (USD Million)
- Figure 10.20 DNA Damage Response Targeting Therapeutics Market for DHODH, Till 2035 (USD Million)
- Figure 10.21 DNA Damage Response Targeting Therapeutics Market for MAPKAPK2, Till 2035 (USD Million)
- Figure 10.22 DNA Damage Response Targeting Therapeutics Market for p53, Till 2035 (USD Million)
- Figure 10.23 DNA Damage Response Targeting Therapeutics Market for Protein Phosphatase 2A, Till 2035 (USD Million)
- Figure 10.24 DNA Damage Response Targeting Therapeutics Market for WEE 1, Till 2035 (USD Million)
- Figure 10.25 Global DNA Damage Response Targeting Therapeutics Market: Distribution by Type of Molecule
- Figure 10.26 DNA Damage Response Targeting Therapeutics Market for Biologics, Till 2035 (USD Million)
- Figure 10.27 DNA Damage Response Targeting Therapeutics Market for Small Molecules, Till 2035 (USD Million)
- Figure 10.28 Global DNA Damage Response Targeting Therapeutics Market: Distribution by Route of Administration
- Figure 10.29 DNA Damage Response Targeting Therapeutics Market for Oral Drugs, Till 2035 (USD Million)
- Figure 10.30 DNA Damage Response Targeting Therapeutics Market for Intravenous Drugs, Till 2035 (USD Million)
- Figure 10.31 Global DNA Damage Response Targeting Therapeutics Market: Distribution by Geography
- Figure 10.32 DNA Damage Response Targeting Therapeutics Market in the US, Till 2035 (USD Million)
- Figure 10.33 DNA Damage Response Targeting Therapeutics Market in Canada, Till 2035 (USD Million)
- Figure 10.34 DNA Damage Response Targeting Therapeutics Market in Denmark, Till 2035 (USD Million)
- Figure 10.35 DNA Damage Response Targeting Therapeutics Market in France, Till 2035 (USD Million)
- Figure 10.36 DNA Damage Response Targeting Therapeutics Market in Germany, Till 2035 (USD Million)
- Figure 10.37 DNA Damage Response Targeting Therapeutics Market in Italy, Till 2035 (USD Million)
- Figure 10.38 DNA Damage Response Targeting Therapeutics Market in Spain, Till 2035 (USD Million)
- Figure 10.39 DNA Damage Response Targeting Therapeutics Market in the UK, Till 2035 (USD Million)
- Figure 10.40 DNA Damage Response Targeting Therapeutics Market in Australia, Till 2035 (USD Million)
- Figure 10.41 DNA Damage Response Targeting Therapeutics Market in Singapore, Till 2035 (USD Million)
- Figure 10.42 DNA Damage Response Targeting Therapeutics Market in South Korea, Till 2035 (USD Million)
- Figure 10.43 Adavosertib (AZD1775, MK-1775), AstraZeneca: Sales Forecast, till 2030 (USD Million)
- Figure 10.44 APX3330, Apexian Pharmaceuticals: Sales Forecast, till 2030 (USD Million)
- Figure 10.45 ASLAN003 (LAS 186323), Aslan Pharmaceuticals: Sales Forecast, till 2030 (USD Million)
- Figure 10.46 CBP-501, CanBas: Sales Forecast, till 2030 (USD Million)
- Figure 10.47 Eprenetapopt (APR-246), Aprea Therapeutics: Sales Forecast, till 2030 (USD Million)
- Figure 10.48 Irofulven, Allarity Therapeutics: Sales Forecast, till 2030 (USD Million)
- Figure 10.49 LB-100, Lixte Biotechnology: Sales Forecast, till 2030 (USD Million)
- Figure 10.50 Silmitasertib, Senhwa Biosciences: Sales Forecast, till 2030 (USD Million)
- Figure 10.51 Global DNA Damage Response Targeting Therapeutics Market, Till 2035: Conservative, Base and Optimistic Scenarios, 2021, 2025 and 2030 (USD Million)
- Figure 11.1 Concluding Remarks: Market Landscape
- Figure 11.2 Concluding Remarks: Clinical Trial Analysis
- Figure 11.3 Concluding Remarks: Publications
- Figure 11.4 Concluding Remarks: Key Parameters Impacting Drug Pricing and Adoption
- Figure 11.5 Concluding Remarks: Market Forecast

