
PUBLISHER: Roots Analysis | PRODUCT CODE: 1771297

PUBLISHER: Roots Analysis | PRODUCT CODE: 1771297
Bioprocess Automation Market: Industry Trends and Global Forecasts - Distribution by Type of Controller, Scale of Operation, Mode of Operation, Compatibility with Bioprocessing Systems, and Key Geographical Regions
GLOBAL BIOPROCESS AUTOMATION MARKET: OVERVIEW
As per Roots Analysis, the bioprocess automation market valued at USD 3.8 billion in the current year is anticipated to grow at a CAGR of 12% during the forecast period.
The market sizing and opportunity analysis has been segmented across the following parameters:
Type of Controller
- Upstream / Downstream Controller System
- Bioprocess Control Software
Scale of Operation
- Preclinical / Clinical Operation
- Commercial Operation
Mode of Operation
- Batch / Fed-Batch Manufacturing
- Perfusion Manufacturing
Compatibility with Bioprocessing Systems
- Single-Use Systems
- Stainless Steel / Other Systems
Key Geographical Regions
- North America
- Europe
- Asia-Pacific and Rest of the World
GLOBAL BIOPROCESS AUTOMATION MARKET: GROWTH AND TRENDS
In recent decades, biopharmaceuticals have become increasingly popular due to their therapeutic effectiveness, favorable safety profiles, and capacity to address a wide range of complex diseases. The success of treatments with the use of biopharmaceuticals has encouraged several stakeholders to modernize traditional equipment used for biological manufacturing. Notably, the bioprocess controllers and automation systems have turned out to be a process optimization solution for the biopharmaceutical industries, overcoming the inadequacy of the traditional bioreactor systems. Moreover, these controllers and automated systems utilize process analytical technology tools that can be seamlessly integrated into bioprocessing units to enhance scalability.
Further, amidst the COVID-19 pandemic, the increasing demand for biologics has led to the surge in the adoption rate of the aforementioned systems. As a result, several bioprocess equipment developers increased their controlled and automated systems offerings in order to increase productivity, shorten production timelines, reduce cost of goods, and increase flexibility of the bioprocess.
GLOBAL BIOPROCESS AUTOMATION MARKET: KEY INSIGHTS
The report delves into the current state of global bioprocess automation market and identifies potential growth opportunities within industry. Some key findings from the report include:
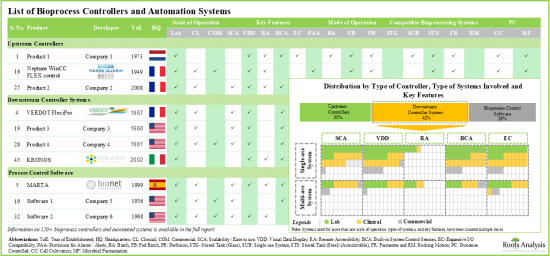
- Over 120 bioprocess controllers and automation systems are available / being developed by various companies based in different regions across the globe; majority of the controllers are designed for upstream processes.
- Over 40% of the bioprocess controllers and automation systems are being offered to optimize the downstream processes, followed by nearly 30% controllers, which are used to optimize upstream processes.
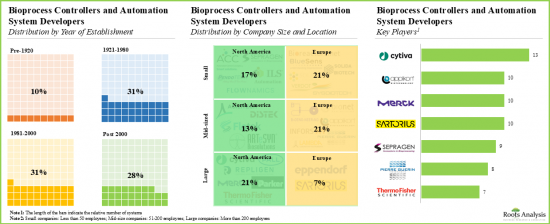
- The domain is featured by the presence of nearly 40% small players; of which, over 30% of players are developing upstream controllers. Further, more than 50% of these players offering bioprocess controllers and automation systems are based in Europe.
- The current market landscape is fragmented, featuring the presence of both established players and new entrants; most of the companies are headquartered in developed nations.
- Prominent examples of bioprocess controllers and automated system providers established before 1970 (in alphabetical order) include Cytiva, Eppendorf, Merck, Parker Hannifin, Sartorius Stedim Biotech and Thermo Fisher Scientific.
- More than 40% developers headquartered in Europe are small and mid-sized players; of these, close to 75% companies are located in Germany, France, and Switzerland.
- Over 65% of bioprocess controllers and automation systems are offered by known / established players; of these, 57% of the stakeholders claim to offer systems for both cell cultivation and microbial fermentation.
- In pursuit of gaining a competitive edge, bioprocess controller developers are presently focusing on the integration of advanced features into their respective products.
- Close to 3,500 patents related to bioprocess controller and automation technologies have been filed / granted to industry and non-industry players, indicating the enhanced pace of innovation in this field.
- A significant proportion of patents have been filed / granted in North America (~65%); key patent assignees include GE Healthcare / Cytiva, Cytori Therapeutics, Xyleco, Inscripta, Lonza, and Terumo BCT.
- Over time, several stakeholders have established strong brand positions; in order to cater to increasing demand for bioprocess automation, a number of players have stepped up to introduce technologically advanced systems.
- Given the potential to reduce human errors and process costs, the adoption of bioprocess controllers and automation systems is likely to increase; the affiliated market is expected to grow at a CAGR of 12% during the forecast period.
GLOBAL BIOPROCESS AUTOMATION MARKET: KEY SEGMENTS
Preclinical / Clinical Segment Occupies the Largest Share of the Bioprocess Automation Market
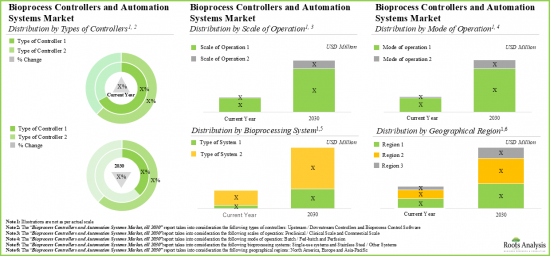
Based on the scale of operation, the market is segmented into preclinical / clinical operations and commercial operations. At present, preclinical / clinical operations segment holds the maximum (~75%) share of the global bioprocess automation market. This trend is likely to remain same in the coming future.
By Type of Controller, Upstream / Downstream Controller System Segment Accounts for the Largest Share in the Bioprocess Automation Market
Based on the type of controller, the market is segmented into upstream / downstream controller system and bioprocess control software. Currently, upstream / downstream controller system segment captures the highest proportion (~60%) of the bioprocess automation market.
Europe Accounts for the Largest Share of the Market
Based on key geographical regions, the market is segmented into North America, Europe, and Asia-Pacific and Rest of the World. Currently, Europe (>40%) dominates the bioprocess automation market and accounts for the largest revenue share.
Example Players in the Bioprocess Automation Market
- Applikon Biotechnology
- Cytiva
- Repligen
- Sartorius
- Sepragen
- Solaris Biotech
- Sysbiotech
- Thermo Fisher Scientific
GLOBAL BIOPROCESS AUTOMATION MARKET: RESEARCH COVERAGE
- Market Sizing and Opportunity Analysis: The report features an in-depth analysis of the global bioprocess automation market, focusing on key market segments, including [A] type of controller, [B] scale of operation, [C] mode of operation, [D] compatibility with bioprocessing systems and [E] key geographical regions.
- Market Landscape: A comprehensive evaluation of bioprocess controllers and automation systems, considering various parameters, such as [A] scale of operation, [B] mode of operation, [C] key features, [D] compatibility with the bioprocessing systems, [E] type of system(s) and [F] type of processes controlled. Additionally, a comprehensive analysis of the companies developing bioprocess controllers and automation systems, based on [A] year of establishment, [B] company size, and [C] geographical presence.
- Product Competitiveness Analysis: A comprehensive competitive analysis of upstream controllers, downstream controller systems and process control software, examining factors, such as [A] product applicability and [B] product strength.
- Company Profiles: In-depth profiles companies providing upstream controllers, downstream controller systems and process control software, focusing on [A] company overview, [B] financial information (if available), [C] product portfolio and [D] recent developments and an informed future outlook.
- Key Insights: In-depth analysis of market trends, focusing on [A] regional distribution of players and [B] type of products offered. Additionally, a [C] distribution of upstream controllers, based on compatibility with bioreactor systems, scale of operation and mode of operation, [D] an analysis of upstream controllers, based on scale of operation, compatibility with bioreactor systems and processes controlled [E] an analysis of downstream controller systems, based on scale of operation, type of systems and key features, [F] an analysis of downstream controller systems, based on mode of operation and application area [G] an analysis of bioprocess control software, based on scale of operation, key features and processes controlled and [H] an analysis of bioprocess control software, based on scale of operation and compatibility with bioprocessing systems.
- Patent Analysis: An insightful analysis of various patents that have been filed / granted for bioprocess controllers and automation systems, based on several parameters, such as [A] type of patents, [B] publication year, [C] application year, [D] issuing authorities involved, [E] type of organizations, [F] emerging focus area, [G] patent age, [H] CPC symbols, [I] leading patent assignees (in terms of number of patents granted / filed), [J] patent characteristics, [K] geography, [L] patent benchmarking and [M] an insightful valuation analysis.
- Brand Positioning Analysis: In-depth analysis of brand positioning of the key industry players, highlighting the current perceptions regarding their proprietary products based on several relevant factors, such as [A] experience of the manufacturer, [B] number of products offered, [C] product diversity and [D] number of patents published.
KEY QUESTIONS ANSWERED IN THIS REPORT
- How many companies are currently engaged in this market?
- Which are the leading companies in this market?
- What factors are likely to influence the evolution of this market?
- What is the current and future market size?
- What is the CAGR of this market?
- How is the current and future market opportunity likely to be distributed across key market segments?
REASONS TO BUY THIS REPORT
- The report provides a comprehensive market analysis, offering detailed revenue projections of the overall market and its specific sub-segments. This information is valuable to both established market leaders and emerging entrants.
- Stakeholders can leverage the report to gain a deeper understanding of the competitive dynamics within the market. By analyzing the competitive landscape, businesses can make informed decisions to optimize their market positioning and develop effective go-to-market strategies.
- The report offers stakeholders a comprehensive overview of the market, including key drivers, barriers, opportunities, and challenges. This information empowers stakeholders to stay abreast of market trends and make data-driven decisions to capitalize on growth prospects.
ADDITIONAL BENEFITS
- Complimentary PPT Insights Packs
- Complimentary Excel Data Packs for all Analytical Modules in the Report
- 15% Free Content Customization
- Detailed Report Walkthrough Session with Research Team
- Free Updated report if the report is 6-12 months old or older
TABLE OF CONTENTS
1. PREFACE
- 1.1. Scope of the Report
- 1.2. Research Methodology
- 1.2.1. Research Assumptions
- 1.2.2. Project Methodology
- 1.2.3. Forecast Methodology
- 1.2.4. Robust Quality Control
- 1.2.5. Key Considerations
- 1.2.5.1. Demographics
- 1.2.5.2. Economic Factors
- 1.2.5.3. Government Regulations
- 1.2.5.4. Supply Chain
- 1.2.5.5. COVID Impact / Related Factors
- 1.2.5.6. Market Access
- 1.2.5.7. Healthcare Policies
- 1.2.5.8. Industry Consolidation
- 1.3 Key Questions Answered
- 1.4. Chapter Outlines
2. EXECUTIVE SUMMARY
3. INTRODUCTION
- 3.1. Chapter Overview
- 3.2. Bioprocess Control
- 3.3. Building Block of Process Control
- 3.3.1. Components of Process Control Systems
- 3.3.1.1. Sensors
- 3.3.1.2. Actuators
- 3.3.1.3. Controllers
- 3.3.1. Components of Process Control Systems
- 3.4. Purpose of Process Control
- 3.5. Bioprocess Automation
- 3.6. Advantages of Bioprocess Automation
- 3.7. Challenges Faced in Automated Control
- 3.7.1. Process Related Challenges to Automate
- 3.7.2. Compatibility and Infrastructure Challenges
- 3.7.3. Regulatory Challenges
- 3.7.4. IT Concerns and Data Integrity
- 3.8. Breakthrough in Bioprocess Control
- 3.8.1. Flexible and Automated Skids
- 3.8.2. Spectroscopy
- 3.8.3. Multivariate data Analytics
- 3.9. Future Perspective
4. MARKET LANDSCAPE: UPSTREAM CONTROLLERS
- 4.1. Chapter Overview
- 4.2. Upstream Controllers: Product Pipeline
- 4.2.1. Analysis by Scale of Operation
- 4.2.2. Analysis by Key Features
- 4.2.3. Analysis by Compatibility with Bioreactor System
- 4.2.4. Analysis by Mode of Operation
- 4.2.5. Analysis by Types of Processes Controlled
- 4.3. Upstream Controllers: Developer Landscape
- 4.3.1. Analysis by Year of Establishment
- 4.3.2. Analysis by Company Size
- 4.3.3. Analysis by Location of Headquarters
- 4.3.4. Leading Developers: Analysis by Number of Upstream Controllers
5. MARKET LANDSCAPE: DOWNSTREAM CONTROLLER SYSTEMS
- 5.1. Chapter Overview
- 5.2. Downstream Controller Systems: Product Pipeline
- 5.2.1. Analysis by Scale of Operation
- 5.2.2. Analysis by Key Features
- 5.2.3. Analysis by Types of Systems Involved
- 5.2.4. Analysis by Mode of Operation
- 5.2.5. Analysis by Application Area
- 5.3. Downstream Controller Systems: Developer Landscape
- 5.3.1. Analysis by Year of Establishment
- 5.3.2. Analysis by Company Size
- 5.3.3. Analysis by Location of Headquarters
- 5.3.4. Leading Developers: Analysis by Number of Products
6. MARKET LANDSCAPE: BIOPROCESS CONTROL SOFTWARE
- 6.1. Chapter Overview
- 6.2. Bioprocess Control Software: Product Pipeline
- 6.2.1. Analysis by Stage of Bioprocess
- 6.2.2. Analysis by Scale of Operation
- 6.2.3. Analysis by Key Features
- 6.2.4. Analysis by Compatibility with Systems
- 6.2.5. Analysis by Types of Processes Controlled
- 6.3. Bioprocess Control Software: Developer Landscape
- 6.3.1. Analysis by Year of Establishment
- 6.3.2. Analysis of Company Size
- 6.3.3. Analysis by Location of Headquarters
- 6.3.4. Leading Developers: Analysis by Number of Bioprocess Control Software
7. PRODUCT COMPETITIVENESS ANALYSIS
- 7.1. Chapter Overview
- 7.2. Methodology
- 7.3. Assumptions / Key Parameters
- 7.4. Product Competitiveness Analysis: Upstream Controllers
- 7.5. Product Competitiveness Analysis: Downstream Controller Systems
- 7.6. Product Competitiveness Analysis: Bioprocess Controller Software
8. BIOPROCESS CONTROLLER AND AUTOMATION SYSTEM DEVELOPERS IN NORTH AMERICA: COMPANY PROFILES
- 8.1. Chapter Overview
- 8.2. Cytiva Lifesciences
- 8.2.1. Company Overview
- 8.2.2. Bioprocess Controller and Automation System Portfolio
- 8.2.3. Recent Developments and Future Outlook
- 8.3. Thermo Fisher Scientific
- 8.3.1. Company Overview
- 8.3.2. Bioprocess Controller and Automation System Portfolio
- 8.3.3. Recent Developments and Future Outlook
- 8.4. Sepragen
- 8.4.1. Company Overview
- 8.4.2. Bioprocess Controller and Automation System Portfolio
- 8.4.3. Recent Developments and Future Outlook
- 8.5. Repligen
- 8.5.1. Company Overview
- 8.5.2. Bioprocess Controller and Automation System Portfolio
- 8.5.3. Recent Developments and Future Outlook
9. BIOPROCESS CONTROLLER AND AUTOMATION SYSTEM DEVELOPERS IN EUROPE: COMPANY PROFILES
- 9.1. Chapter Overview
- 9.2. Applikon Biotechnology
- 9.2.1. Company Overview
- 9.2.2. Bioprocess Controller and Automation System Portfolio
- 9.2.3. Recent Developments and Future Outlook
- 9.3. Sartorius
- 9.3.1. Company Overview
- 9.3.2. Bioprocess Controller and Automation System Portfolio
- 9.3.3. Recent Developments and Future Outlook
- 9.4. Solaris Biotech
- 9.4.1. Company Overview
- 9.4.2. Bioprocess Controller and Automation System Portfolio
- 9.4.3. Recent Developments and Future Outlook
- 9.5. Sysbiotech
- 9.5.1. Company Overview
- 9.5.2. Bioprocess Controller and Automation System Portfolio
- 9.5.3. Recent Developments and Future Outlook
10. MARKET TREND ANALYSIS
- 10.1. Chapter Overview
- 10.2. World Map Representation: Analysis of Players by Location of Headquarters and Type of Product(s) Offered
- 10.3. Market Trend Analysis: Upstream Controllers
- 10.3.1. Heat Map Representation: Analysis by Scale of Operation, Compatibility with Bioreactor Systems and Operating Mode
- 10.3.2. Grid Analysis: Analysis by Scale of Operation, Compatibility with Bioreactor Systems and Types of Processes Controlled
- 10.4. Market Trend Analysis: Downstream Controller Systems
- 10.4.1. Grid Analysis: Analysis by Scale of Operation, Type of System(s) and Key Features
- 10.4.2. Analysis by Operation Mode and Application Area
- 10.5. Market Trend Analysis: Bioprocess Control Software
- 10.5.1. Grid Analysis: Analysis by Scale of Operation, Key Features and Types of Processes Controlled
- 10.5.2. Analysis by Scale of operation and Compatibility with Systems
11. PATENT ANALYSIS
- 11.1. Chapter Overview
- 11.2. Scope and Methodology
- 11.3. Bioprocess Controller and Automations Systems: Patent Analysis
- 11.3.1. Analysis by Publication Year
- 11.3.2. Analysis by Application Year
- 11.3.3. Analysis by Patent Office
- 11.3.4. Analysis by Geographical Location
- 11.3.5. Analysis by CPC Symbols
- 11.3.6. Emerging Focus Area
- 11.3.7. Analysis by Type of Organization
- 11.3.8. Leading Players: Analysis by Number of Patents
- 11.4. Patent Benchmarking Analysis
- 11.4.1. Analysis by Patent Characteristics
- 11.5. Bioprocess Controller and Automations Systems: Patent Valuation Analysis
- 11.6. Leading Patents by Number of Citations
12. BRAND POSITIONING ANALYSIS
- 12.1. Chapter Overview
- 12.2. Methodology
- 12.3. Key Parameters
- 12.4. Brand Positioning Matrix of Upstream Controller Developers
- 12.4.1. Brand Positioning Matrix: Applikon Biotechnology
- 12.4.2. Brand Positioning Matrix: Eppendorf
- 12.4.3. Brand Positioning Matrix: Thermo Fisher Scientific
- 12.4.4. Brand Positioning Matrix: ILS Automation
- 12.4.5. Brand Positioning Matrix: Pierre Guerin
- 12.5. Brand Positioning Matrix of Downstream Controller System Developers
- 12.5.1. Brand Positioning Matrix: Cytiva Lifesciences
- 12.5.2. Brand Positioning Matrix: Sepragen
- 12.5.3. Brand Positioning Matrix: Merck Millipore
- 12.5.4. Brand Positioning Matrix: Sartorius Stedim Biotech
- 12.5.5. Brand Positioning Matrix: Repligen
- 12.5.6. Brand Positioning Matrix: Agilitech
- 12.6. Brand Positioning Matrix of Bioprocess Controller Software Developers
- 12.6.1. Brand Positioning Matrix: Applikon Biotechnology
- 12.6.2. Brand Positioning Matrix: Pierre Guerin
- 12.6.3. Brand Positioning Matrix: Thermo Fisher Scientific
- 12.6.4. Brand Positioning Matrix: Merck Millipore
- 12.6.5. Brand Positioning Matrix: Sartorius Stedim Biotech
- 12.6.6. Brand Positioning Matrix: Cytiva Lifesciences
- 12.6.7. Brand Positioning Matrix: Bionet Engineering
13. MARKET FORECAST AND OPPORTUNITY ANALYSIS
- 13.1. Chapter Overview
- 13.2. Forecast Methodology and Key Assumptions
- 13.3. Overall Bioprocess Controller and Automation Market, Till 2035
- 13.4. Bioprocess Controller and Automation Market, Till 2035: Distribution by Type of Controller
- 13.4.1. Bioprocess Controller and Automation Market for Upstream / Downstream Controller Systems, Till 2035
- 13.4.2. Bioprocess Controller and Automation Market for Bioprocess Control Software, Till 2035
- 13.5. Bioprocess Controller and Automation Market, Till 2035: Distribution by Scale of Operation
- 13.5.1. Bioprocess Controller and Automation Market for Preclinical / Clinical Operations, Till 2035
- 13.5.2. Bioprocess Controller and Automation Market for Commercial Operations, Till 2035
- 13.6. Bioprocess Controller and Automation Market, Till 2035: Distribution by Mode of Operation
- 13.6.1. Bioprocess Controller and Automation Market for Batch / Fed-batch Manufacturing, Till 2035
- 13.6.2. Bioprocess Controller and Automation Market for Perfusion Manufacturing, Till 2035
- 13.7. Bioprocess Controller and Automation Market, Till 2035: Distribution by Type of Systems
- 13.7.1. Bioprocess Controller and Automation Market for Single-use Systems, Till 2035
- 13.7.2. Bioprocess Controller and Automation Market for Stainless Steel / Other Systems, Till 2035
- 13.8. Bioprocess Controller and Automation Market, Till 2035: Distribution by Key Geographical Regions
- 13.8.1. Bioprocess Controller and Automation Market in North America, Till 2035
- 13.8.2. Bioprocess Controller and Automation Market in Europe, Till 2035
- 13.8.3. Bioprocess Controller and Automation Market in Asia-Pacific and Rest of the World, Till 2035
14. CONCLUSION
- 14.1. Chapter Overview
15. EXECUTIVE INSIGHTS
16. APPENDIX 1: TABULATED DATA
17. APPENDIX 2: LIST OF COMPANIES AND ORGANIZATIONS
List of Tables
- Table 4.1 Upstream Controllers: Information on Dimensions and Scale of Operation
- Table 4.2 Upstream Controllers: Information on Key Features, Mode of Operation, Compatibility with Bioreactor Systems and Types of Processes Controlled
- Table 4.3 Upstream Controller Developers: Information of Year of Establishment, Company Size and Location of Headquarters
- Table 5.1 Downstream Controller Systems: Information on Dimensions, Type of Controllers and Scale of Operation
- Table 5.2 Downstream Controller Systems: Information on Key Features, Type of Bioprocessing System(s) Involved, Mode of Operation and Application Area
- Table 5.3 Downstream Controller System Developers: Information of Year of Establishment, Company Size and Location of Headquarters
- Table 6.1 Bioprocess Control Software: Information on Stage of Bioprocess and Scale of Operation
- Table 6.2 Bioprocess Control Software: Information on Key Features, Compatibility with Bioprocessing Systems and Types of Processes Controlled
- Table 6.3 Bioprocess Control Software Developers: Information of Year of Establishment, Company Size and Location of Headquarters
- Table 8.1 Bioprocess Controllers and Automation: List of Companies Profiled
- Table 8.2 Cytiva Lifesciences: Company Snapshot
- Table 8.3 Cytiva Lifesciences: Product Portfolio (Downstream Controller Systems)
- Table 8.4 Cytiva Lifesciences: Product Portfolio (Bioprocess Control Software)
- Table 8.5 Cytiva Lifesciences: Recent Developments and Future Outlook
- Table 8.6 Thermo Fisher Scientific: Company Snapshot
- Table 8.7 Thermo Fisher Scientific: Product Portfolio (Upstream Controllers)
- Table 8.8 Thermo Fisher Scientific: Product Portfolio (Bioprocess Control Software)
- Table 8.9 Thermo Fisher Scientific: Recent Developments and Future Outlook
- Table 8.10 Sepragen: Company Snapshot
- Table 8.11 Sepragen: Product Portfolio (Downstream Controller Systems)
- Table 8.12 Repligen Corporation: Company Snapshot
- Table 8.13 Repligen: Product Portfolio (Downstream Controller Systems)
- Table 8.14 Repligen Corporation: Recent Developments and Future Outlook
- Table 9.1 Bioprocess Controllers and Automation: List of Companies Profiled
- Table 9.2 Applikon Biotechnology: Company Snapshot
- Table 9.3 Applikon Biotechnology: Product Portfolio (Upstream Controllers)
- Table 9.4 Applikon Biotechnology: Product Portfolio (Bioprocess Control Software)
- Table 9.5 Applikon biotechnology: Recent Developments and Future Outlook
- Table 9.6 Sartorius: Company Snapshot
- Table 9.7 Sartorius: Product Portfolio (Upstream Controllers)
- Table 9.8 Sartorius: Product Portfolio (Downstream Controller Systems)
- Table 9.9 Sartorius: Product Portfolio (Bioprocess Control Software)
- Table 9.10 Sartorius: Recent Developments and Future Outlook
- Table 9.11 Solaris Biotech: Company Snapshot
- Table 9.12 Solaris Biotech: Product Portfolio (Upstream Controllers)
- Table 9.13 Solaris Biotech: Product Portfolio (Downstream Controller Systems)
- Table 9.14 Solaris Biotech: Product Portfolio (Bioprocess Control Software)
- Table 9.15 Solaris Biotech: Recent Developments and Future Outlook
- Table 9.16 Sysbiotech: Company Snapshot
- Table 9.17 Sysbiotech: Product Portfolio (Upstream Controllers)
- Table 9.18 Sysbiotech: Recent Developments and Future Outlook
- Table 11.1 Patent Analysis: Prominent CPC Symbols
- Table 11.2 Patent Analysis: List of Top CPC Symbols
- Table 11.3 Patent Analysis: Leading CPC Symbol Definitions
- Table 11.4 Patent Analysis: Summary of Benchmarking Analysis
- Table 11.5 Patent Analysis: Categorization based on Weighted Valuation Scores
- Table 11.6 Patent Portfolio: List of Leading Patents (by Highest Relative Valuation)
- Table 11.7 Patent Portfolio: List of Leading Patents (by Number of Citations)
- Table 16.1 Upstream Controllers: Distribution by Scale of Operation
- Table 16.2 Upstream Controllers: Distribution by Key Features
- Table 16.3 Upstream Controllers: Distribution by Compatibility with Bioreactor systems
- Table 16.4 Upstream Controllers: Distribution by Mode of Operation
- Table 16.5 Upstream Controllers: Distribution by Types of Processes Controlled
- Table 16.6 Upstream Controller Developers: Distribution by Year of Establishment
- Table 16.7 Upstream Controller Developers: Distribution by Company Size
- Table 16.8 Upstream Controller Developers: Distribution by Location of Headquarters
- Table 16.9 Leading Developers: Distribution by Number of Products
- Table 16.10 Downstream Controller Systems: Distribution by Scale of Operation
- Table 16.11 Downstream Controller Systems: Distribution by Key Features
- Table 16.12 Downstream Controller Systems: Distribution by Type of Bioprocessing System(s)
- Table 16.13 Downstream Controller Systems: Distribution by Mode of Operation
- Table 16.14 Downstream Controller Systems: Distribution by Application Area
- Table 16.15 Downstream Controller System Developers: Distribution by Year of Establishment
- Table 16.16 Downstream Controller System Developers: Distribution by Company Size
- Table 16.17 Downstream Controller System Developers: Distribution by Location of Headquarters
- Table 16.18 Leading Developers: Distribution by Number of Products
- Table 16.19 Bioprocess Control Software: Distribution by Stage of Bioprocess
- Table 16.20 Bioprocess Control Software: Distribution by Scale of Operation
- Table 16.21 Bioprocess Control Software: Distribution by Key Features
- Table 16.22 Bioprocess Control Software: Distribution by Compatibility with Bioprocessing Systems
- Table 16.23 Bioprocess Control Software: Distribution by Types of Processes Controlled
- Table 16.24 Bioprocess Control Software Developers: Distribution by Year of Establishment
- Table 16.25 Bioprocess Control Software Developers: Distribution by Company Size
- Table 16.26 Bioprocess Control Software Developers: Distribution by Location of Headquarters
- Table 16.27 Leading Developers: Distribution by Number of Products
- Table 16.28 Downstream Controller System: Distribution by Operating Mode and Application Area
- Table 16.29 Bioprocess Control Software: Distribution by Scale of Operation and Compatibility with Systems
- Table 16.30 Patent Analysis: Distribution by Type of Patent
- Table 16.31 Patent Analysis: Cumulative Distribution by Publication Year, Since Pre-2015
- Table 16.32 Patent Analysis: Distribution by Application Year, Since Pre-2015
- Table 16.33 Patent Analysis: Distribution by Patent Office
- Table 16.34 Patent Analysis: Distribution by Geographical Location
- Table 16.35 Patent Analysis: Cumulative Year-wise Distribution by Type of Organization
- Table 16.36 Patent Analysis: Leading Industry Players
- Table 16.37 Patent Analysis: Leading Non-Industry Players
- Table 16.38 Patent Analysis: Leading Individual Assignees
- Table 16.39 Patent Analysis: Distribution of Patents by Age Since 2001
- Table 16.40 Bioprocess Controllers and Automation Systems: Patent Valuation
- Table 16.41 Overall Bioprocess Controllers and Automation Systems Market, Till 2035 (USD Million)
- Table 16.42 Bioprocess Controller and Automation Market, Till 2035: Distribution by Type of Controller (USD Million)
- Table 16.43 Bioprocess Controller and Automation Market for Upstream / Downstream Controller Systems, Till 2035 (USD Million)
- Table 16.44 Bioprocess Controller and Automation Market for Bioprocess Control Software, Till 2035 (USD Million)
- Table 16.45 Bioprocess Controller and Automation Market, Till 2035: Distribution by Scale of Operation (USD Million)
- Table 16.46 Bioprocess Controller and Automation Market for Preclinical / Clinical Operations, Till 2035 (USD Million)
- Table 16.47 Bioprocess Controller and Automation Market for Commercial Operations, Till 2035 (USD Million)
- Table 16.48 Bioprocess Controller and Automation Market, Till 2035: Distribution by Mode of Operation (USD Million)
- Table 16.49 Bioprocess Controller and Automation Market for Batch / Fed-batch Manufacturing, Till 2035 (USD Million)
- Table 16.50 Bioprocess Controller and Automation Market for Perfusion Manufacturing, Till 2035 (USD Million)
- Table 16.51 Bioprocess Controller and Automation Market, Till 2035: Distribution by Type of Bioprocessing Systems (USD Million)
- Table 16.52 Bioprocess Controller and Automation Market for Single-use Systems, Till 2035 (USD Million)
- Table 16.53 Bioprocess Controller and Automation Market for Stainless Steel / Other Systems, Till 2035 (USD Million)
- Table 16.54 Bioprocess Controller and Automation Market, Till 2035: Distribution by Key Geographical Regions (USD Million)
- Table 16.55 Bioprocess Controller and Automation Market in North America, Till 2035 (USD Million)
- Table 16.56 Bioprocess Controller and Automation Market in Europe, Till 2035 (USD Million)
- Table 16.57 Bioprocess Controller and Automation Market in Asia-Pacific and Rest of the World, Till 2035 (USD Million)
List of Figures
- Figure 2.1 Executive Summary: Current Market Landscape of Upstream Controllers
- Figure 2.2 Executive Summary: Current Market Landscape of Downstream Controller Systems
- Figure 2.3 Executive Summary: Current Market Landscape of Bioprocess Control Software
- Figure 2.4 Executive Summary: Patent Analysis
- Figure 2.5 Executive Summary: Market Forecast and Opportunity Analysis
- Figure 3.1 Factors Affecting Manufacturing Process of Biologics
- Figure 3.2 Overview of Controlled Parameters in Bioreactors
- Figure 3.3 Basic Bioprocess Control Model
- Figure 3.4 Advantages of Bioprocess Automation
- Figure 4.1 Upstream Controllers: Distribution by Scale of Operation
- Figure 4.2 Upstream Controllers: Distribution by Key Features
- Figure 4.3 Upstream Controllers: Distribution by Compatibility with Bioreactor systems
- Figure 4.4 Upstream Controllers: Distribution by Mode of Operation
- Figure 4.5 Upstream Controllers: Distribution by Types of Processes Controlled
- Figure 4.6 Upstream Controller Developers: Distribution by Year of Establishment
- Figure 4.7 Upstream Controller Developers: Distribution by Company Size
- Figure 4.8 Upstream Controller Developers: Distribution by Location of Headquarters
- Figure 4.9 Leading Developers: Distribution by Number of Products
- Figure 5.1 Downstream Controller Systems: Distribution by Scale of Operation
- Figure 5.2 Downstream controller systems: Distribution by Key Features
- Figure 5.3 Downstream Controller Systems: Distribution by Type of Bioprocessing System(s)
- Figure 5.4 Downstream Controller Systems: Distribution by Mode of Operation
- Figure 5.5 Downstream Controller Systems: Distribution by Application Area
- Figure 5.6 Downstream Controller System Developers: Distribution by Year of Establishment
- Figure 5.7 Downstream Controller System Developers: Distribution by Company Size
- Figure 5.8 Downstream Controller System Developers: Distribution by Location of Headquarters
- Figure 5.9 Leading Developers: Distribution by Number of Products
- Figure 6.1 Bioprocess Control Software: Distribution by Stage of Bioprocess
- Figure 6.2 Bioprocess Control Software: Distribution by Scale of Operation
- Figure 6.3 Bioprocess Control Software: Distribution by Key Features
- Figure 6.4 Bioprocess Control Software: Distribution by Compatibility with Bioprocessing Systems
- Figure 6.5 Bioprocess Control Software: Distribution by Types of Processes Controlled
- Figure 6.6 Bioprocess Control Software Developers: Distribution by Year of Establishment
- Figure 6.7 Bioprocess Control Software Developers: Distribution by Company Size
- Figure 6.8 Bioprocess Control Software Developers: Distribution by Location of Headquarters
- Figure 6.9 Leading Developers: Distribution by Number of Products
- Figure 7.1 Product Competitiveness Analysis: Upstream Controllers
- Figure 7.2 Product Competitiveness Analysis: Downstream Controller Systems (Chromatography Systems)
- Figure 7.3 Product Competitiveness Analysis: Downstream Controller Systems (Tangential Flow Filtration Systems Systems)
- Figure 7.4 Product Competitiveness Analysis: Bioprocess Control Software
- Figure 10.1 World Map Representation: Distribution by Location of Headquarters and Type of Product(s) Offered
- Figure 10.2 Heat Map Representation: Distribution by Scale of Operation, Compatibility with Bioreactor Systems and Mode of Operation
- Figure 10.3 Grid Analysis: Distribution by Upstream Controllers by Scale of Operation, Compatibility with Bioreactor Systems and Types of Processes Controlled
- Figure 10.4 Grid Analysis: Distribution by Scale of Operation, Type of Bioprocessing System(s) and Key Features
- Figure 10.5 Downstream Controller System: Distribution by Mode of Operation and Application Area
- Figure 10.6 Grid Analysis: Distribution by Scale of Operation, Key Features and Types of Processes Controlled
- Figure 10.7 Bioprocess Control Software: Distribution by Scale of Operation and Compatibility with Bioprocessing Systems
- Figure 11.1 Patent Analysis: Distribution by Type of Patent
- Figure 11.2 Patent Analysis: Cumulative Distribution by Publication Year, Since Pre-2015
- Figure 11.3 Patent Analysis: Distribution by Application Year, Since Pre-2015
- Figure 11.4 Patent Analysis: Distribution by Patent Office
- Figure 11.5 Patent Analysis: Distribution by Geographical Location
- Figure 11.6 Patent Analysis: Distribution by CPC Symbols
- Figure 11.7 Patent Analysis: Emerging Focus Areas
- Figure 11.8 Patent Analysis: Cumulative Year-wise Distribution by Type of Organization
- Figure 11.9 Patent Analysis: Leading Industry Players
- Figure 11.10 Patent Analysis: Leading Non-Industry Players
- Figure 11.11 Patent Analysis: Leading Individual Assignees
- Figure 11.12 Patent Analysis (Leading Industry Players): Benchmarking by Patent Characteristics (CPC Symbols)
- Figure 11.13 Patent Analysis: Distribution of Patents by Age Since 2001
- Figure 11.14 Bioprocess Controllers and Automation Systems: Patent Valuation
- Figure 12.1 Brand Positioning Analysis of Upstream Controller Developers: Competitive Advantage
- Figure 12.2 Brand Positioning Analysis of Upstream Controller Developers: Reasons to Believe
- Figure 12.3 Brand Positioning Matrix: Applikon Biotechnology
- Figure 12.4 Brand Positioning Matrix: Eppendorf
- Figure 12.5 Brand Positioning Matrix: Thermo Fisher Scientific
- Figure 12.6 Brand Positioning Matrix: ILS Automation
- Figure 12.7 Brand Positioning Matrix: Pierre Guerin
- Figure 12.8 Brand Positioning Analysis of Downstream Controller System Developers: Competitive Advantage
- Figure 12.9 Brand Positioning Analysis of Downstream Controller System Developers: Reasons to Believe
- Figure 12.10 Brand Positioning Matrix: Cytiva
- Figure 12.11 Brand Positioning Matrix: Sepragen
- Figure 12.12 Brand Positioning Matrix: Merck Millipore
- Figure 12.13 Brand Positioning Matrix: Sartorius Stedim Biotech
- Figure 12.14 Brand Positioning Matrix: Repligen
- Figure 12.15 Brand Positioning Matrix: Agilitech
- Figure 12.16 Brand Positioning Analysis of Bioprocess Control Software Developers: Competitive Advantage
- Figure 12.17 Brand Positioning Analysis of Bioprocess Control Software Developers: Reasons to Believe
- Figure 12.18 Brand Positioning Matrix: Applikon Biotechnology
- Figure 12.19 Brand Positioning Matrix: Pierre Guerin
- Figure 12.20 Brand Positioning Matrix: Thermo Fisher Scientific
- Figure 12.21 Brand Positioning Matrix: Merck Millipore
- Figure 12.22 Brand Positioning Matrix: Sartorius Stedim Biotech
- Figure 12.23 Brand Positioning Matrix: Cytiva
- Figure 12.24 Brand Positioning Matrix: Bionet Engineering
- Figure 13.1 Overall Bioprocess Controllers and Automation Systems Market, Till 2035 (USD Million)
- Figure 13.2 Bioprocess Controller and Automation Market, Till 2035: Distribution by Type of Controller (USD Million)
- Figure 13.3 Bioprocess Controller and Automation Market for Upstream / Downstream Controller Systems, Till 2035 (USD Million)
- Figure 13.4 Bioprocess Controller and Automation Market for Bioprocess Control Software, Till 2035 (USD Million)
- Figure 13.5 Bioprocess Controller and Automation Market, Till 2035: Distribution by Scale of Operation (USD Million)
- Figure 13.6 Bioprocess Controller and Automation Market for Preclinical / Clinical Operations, Till 2035 (USD Million)
- Figure 13.7 Bioprocess Controller and Automation Market for Commercial Operations, Till 2035 (USD Million)
- Figure 13.8 Bioprocess Controller and Automation Market, Till 2035: Distribution by Mode of Operation (USD Million)
- Figure 13.9 Bioprocess Controller and Automation Market for Batch / Fed-batch Manufacturing, Till 2035 (USD Million)
- Figure 13.10 Bioprocess Controller and Automation Market for Perfusion Manufacturing, Till 2035 (USD Million)
- Figure 13.11 Bioprocess Controller and Automation Market, Till 2035: Distribution by Type of Bioprocessing Systems (USD Million)
- Figure 13.12 Bioprocess Controller and Automation Market for Single-use Systems, Till 2035 (USD Million)
- Figure 13.13 Bioprocess Controller and Automation Market for Stainless Steel / Other Systems, Till 2035 (USD Million)
- Figure 13.14 Bioprocess Controller and Automation Market, Till 2035: Distribution by Key Geographical Regions (USD Million)
- Figure 13.15 Bioprocess Controller and Automation Market in North America, Till 2035 (USD Million)
- Figure 13.16 d (USD Million)
- Figure 13.17 Bioprocess Controller and Automation Market in Asia-Pacific and Rest of the World, Till 2035 (USD Million)
- Figure 14.1 Concluding Remarks: Current Market Landscape of Upstream Controllers
- Figure 14.2 Concluding Remarks: Current Market Landscape of Downstream Controller Systems
- Figure 14.3 Concluding Remarks: Current Market Landscape of Bioprocess Control Software
- Figure 14.4 Concluding Remarks: Patent Analysis
- Figure 14.5 Concluding Remarks: Market Forecast and Opportunity Analysis

