
PUBLISHER: Roots Analysis | PRODUCT CODE: 1771301

PUBLISHER: Roots Analysis | PRODUCT CODE: 1771301
DNA and Gene Cloning Services Market: Industry Trends and Global Forecasts - Distribution by Type of Service Offered, Type of Gene, Company Size, End-User Industry, Key Geographical Regions
GLOBAL DNA AND GENE CLONING SERVICES MARKET: OVERVIEW
As per Roots Analysis, the global DNA and gene cloning services market is estimated to grow from USD 3.12 billion in the current year to USD 14.55 billion by 2035, at a CAGR of 16.7% during the forecast period, till 2035.
The market sizing and opportunity analysis has been segmented across the following parameters:
Type of Service Offered
- Gene Synthesis
- Custom Cloning
- Sub-cloning
- Others
Type of Gene
- Standard Gene
- Complex Gene
- Others
Company Size
- Small
- Mid-sized
- Large
End-User
- Academic and R&D
- Pharmaceutical and Biotechnology Companies
- Others
Key Geographical Regions
- North America
- Europe
- Asia-Pacific
- Latin America
- Middle East and North Africa
GLOBAL DNA AND GENE CLONING SERVICES MARKET: GROWTH AND TRENDS
Cloning refers to a process of creating identical copies of DNA and genes that are used in various research and therapeutic applications. Advancements in cloning and genetic engineering techniques enable researchers to modify the genome of microorganisms and use them to produce gene therapies. These target-specific gene therapies have shown significant potential in the treatment of serious disease indications such as AIDS, cystic fibrosis, and others. Moreover, it is worth noting that DNA and gene cloning often play a significant role in the production of antibiotics, hormones, and vitamins. As a result, due to the several applications of DNA and gene cloning, many researchers have taken the initiative to construct gene libraries that comprise cloned DNA. However, the DNA and gene cloning processes may pose complications such as gene toxicity, unstable DNA elements, and the requirement of particular gene insert sizes and vectors. To address the concerns, several industrial stakeholders have begun to outsource DNA and gene cloning to obtain high-quality and stable final products.
Currently, there are several service providers available in the field with the required expertise and technological support to meet the demand for DNA clones. It is worth highlighting here that comprehensive research has been conducted on DNA cloning technologies; this is evident from over 6,900 research articles that have been published on various research websites for DNA cloning technologies in the past few decades. The ongoing demand for gene therapies and the growing adoption of advanced DNA cloning technologies are anticipated to grow the market at a steady rate during the forecast period.
GLOBAL DNA AND GENE CLONING SERVICES MARKET: KEY INSIGHTS
The report delves into the current state of global DNA and gene cloning services market and identifies potential growth opportunities within industry. Some key findings from the report include:
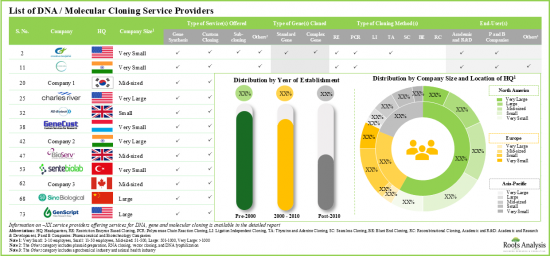
- Presently, around 80 well-established players across the globe claim to offer DNA / molecular cloning associated services; a relatively larger proportion of these players are small companies based in North America.
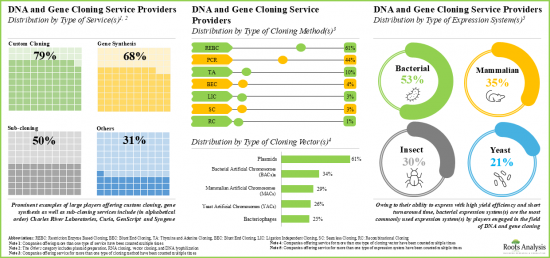
- Leveraging their expertise, service providers offer different DNA and molecular cloning services for a variety of genes; further, majority (~80%) of the players offer custom cloning services.
- In pursuit of building a competitive edge, stakeholders in this domain are striving to enhance their service portfolio and upgrade their DNA and gene cloning related services.
- Over the past few years, several articles focused on DNA and gene cloning have been published by eminent authors in various high-impact journals; Methods in Molecular Biology emerged as the popular journal with maximum (~310) articles published in the given time period.
- More than 1,350 patents related to DNA and gene cloning have been filed / granted by various stakeholders in order to protect the intellectual property generated within this field.
- Around 60% of the patents related to cloning have been filed / granted by various industries as well as academic players, post 2018.
- Only 5.5% of the patents have a significantly higher relative valuation; this is primarily because of the low number of citations of the patents filed recently.
- The growing interest in the field of DNA and gene cloning is also reflected by the events organized to provide an opportunity for several stakeholders to share their ideas and develop a better understanding of such processes.
- With the rising demand for DNA and gene cloning services, the market is expected to grow at an annualized rate of 16.7%, till 2035.
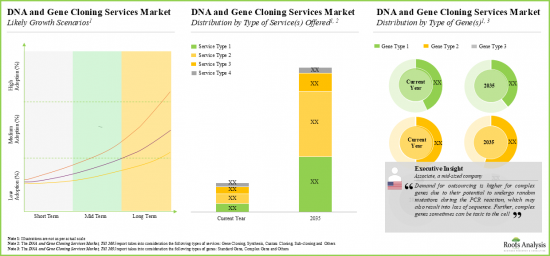
- The current and projected future market opportunity is likely to be well distributed across various growth scenarios, type of services offered and type of genes.
GLOBAL DNA AND GENE CLONING SERVICES MARKET: KEY SEGMENTS
Custom Cloning Segment Occupies the Largest Share of the DNA and Gene Cloning Services Market
Based on the type of service offered, the market is segmented into gene synthesis, custom cloning, sub-cloning and others. At present, custom cloning segment holds the maximum (~50%) share of the global DNA and gene cloning services market. Additionally, due to the rising advantages of custom cloning in tailored solutions, the custom cloning segment is likely to grow at a faster pace compared to the other segments.
By Type of Gene, Complex Gene Segment is the Fastest Growing Segment of the Global DNA and Gene Cloning Services Market
Based on the type of gene, the market is segmented into standard genes, complex genes and others. Currently, complex genes segment captures the highest proportion (~55%) of the DNA and gene cloning services market. Further, this segment is likely to grow at a relatively higher CAGR.
Large Companies Segment Occupy the Largest Share of the DNA and Gene Cloning Services Market
Based on the company size, the market is segmented into small, mid-sized and large companies. At present, the large companies segment holds the maximum share (~60%) of the DNA and gene cloning services market. In addition, in the long run, large companies have shown significant growth potential and are poised to grow at a CAGR of 19.69% during the forecast period.
By End-User, the Academic and R&D Segment is the Fastest Growing Segment of the DNA and Gene Cloning Services Market During the Forecast Period
Based on the end-user, the market is segmented into academic and R&D, pharmaceutical and biotechnology companies, and others. Currently, the pharmaceutical and biotechnology companies segment captures the highest proportion (~60%) of the DNA and gene cloning services market. Further, it is worth highlighting that the DNA and gene cloning services market for academic and R&D segment is likely to grow at a relatively higher CAGR.
North America Accounts for the Largest Share of the Market
Based on key geographical regions, the market is segmented into North America, Europe, Asia-Pacific, Latin America, and Middle East and North Africa. Currently, North America (~60%) dominates the DNA and gene cloning services market and accounts for the largest revenue share. However, the market in the Middle East and North Africa is expected to grow at a higher CAGR.
Example Players in the DNA and Gene Cloning Services Market
- Aragen Life Sciences
- Bio-Techne
- Charles River Laboratories
- Curia, Eurofins
- GenScript
- Integrated DNA Technologies
- MedGenome, Sino Biological
- Syngene and Twist Bioscience
GLOBAL DNA AND GENE CLONING SERVICES MARKET
- Market Sizing and Opportunity Analysis: The report features an in-depth analysis of the global DNA and gene cloning services market, focusing on key market segments, including [A] type of service offered, [B] type of gene, [C] company size, [D] end-user and [E] key geographical regions.
- Market Landscape: A comprehensive evaluation of DNA cloning and gene cloning service providers, considering various parameters, such as [A] year of establishment, [B] company size, [C] region of headquarters, [D] type of service(s) offered, [E] cloning method(s) used, [F] type of gene(s) cloned, [G] expression system(s) used, [H] cloning vector(s) used and [I] end-user industry.
- Benchmark Analysis: A comprehensive benchmark analysis of the DNA and gene cloning service providers, examining factors, such as [A] number of cloning method(s) used, [B] number of expression system(s) used, [C] number of cloning vector(s) used and [D] number of end-user(s).
- Company Profiles: In-depth profiles of companies engaged in providing services for DNA and gene cloning, focusing on [A] company overview, [B] financial information (if available), [C] service portfolio and [D] recent developments and an informed future outlook.
- Patent Analysis: An in-depth analysis of patents filed / granted till date in the DNA and gene cloning domain, based on various relevant parameters, such as [A] type of patent, [B] publication year, [C] application year, [D] geographical location, [E] CPC symbols, [F] emerging focus area, [G] type of applicant, [H] leading players (in terms of number of patents filed / granted), [I] leading assignees, [J] benchmarking analysis and [K] patent valuation analysis.
- Publication Analysis: An insightful analysis of more than 6,900 peer-reviewed, scientific articles related to research on DNA and gene cloning, based on [A] year of publication, [B] type of cloning, [C] key focus area, [D] popular journals, [E] leading authors and [F] leading first authors.
- Global Event Analysis: A comprehensive analysis of recent events related to DNA and gene cloning that were organized / planned, based on relevant parameters, such as [A] year of occurrence of the event, [B] event platform, [C] type of event, [D] geographical distribution, [E] emerging agendas / key focus areas, [F] most active event speakers (in terms of number of events), [G] seniority level of event speakers and [H] geographical mapping of the upcoming events.
- Case Study: A detailed discussion on the DNA cloning kits developers, based on various parameters, such as [A] kit components, [B] number of reactions, [C] type of cloning method used, [D] type of fragment(s) cloned, [E] cloning time, [F] efficacy and [G] kit shelf life. Additionally, it also includes a detailed study on the DNA cloning reagents developers, based on [A] reagents' unit size, [B] concentration, [C] components of reagents, [D] exonuclease activity, [E] product overhangs, [F] heat inactivation temperature and [G] storage temperature.
KEY QUESTIONS ANSWERED IN THIS REPORT
- How many companies are currently engaged in this market?
- Which are the leading companies in this market?
- What factors are likely to influence the evolution of this market?
- What is the current and future market size?
- What is the CAGR of this market?
- How is the current and future market opportunity likely to be distributed across key market segments?
REASONS TO BUY THIS REPORT
- The report provides a comprehensive market analysis, offering detailed revenue projections of the overall market and its specific sub-segments. This information is valuable to both established market leaders and emerging entrants.
- Stakeholders can leverage the report to gain a deeper understanding of the competitive dynamics within the market. By analyzing the competitive landscape, businesses can make informed decisions to optimize their market positioning and develop effective go-to-market strategies.
- The report offers stakeholders a comprehensive overview of the market, including key drivers, barriers, opportunities, and challenges. This information empowers stakeholders to stay abreast of market trends and make data-driven decisions to capitalize on growth prospects.
ADDITIONAL BENEFITS
- Complimentary PPT Insights Packs
- Complimentary Excel Data Packs for all Analytical Modules in the Report
- 15% Free Content Customization
- Detailed Report Walkthrough Session with Research Team
- Free Updated report if the report is 6-12 months old or older
TABLE OF CONTENTS
1. PREFACE
- 1.1. Scope of the Report
- 1.2. Research Methodology
- 1.2.1. Research Assumptions
- 1.2.2. Project Methodology
- 1.2.3. Forecast Methodology
- 1.2.4. Robust Quality Control
- 1.2.5. Key Considerations
- 1.2.5.1. Demographics
- 1.2.5.2. Economic Factors
- 1.2.5.3. Government Regulations
- 1.2.5.4. Supply Chain
- 1.2.5.5. COVID Impact / Related Factors
- 1.2.5.6. Market Access
- 1.2.5.7. Healthcare Policies
- 1.2.5.8. Industry Consolidation
- 1.3 Key Questions Answered
- 1.4. Chapter Outlines
2. EXECUTIVE SUMMARY
3. INTRODUCTION
- 3.1. Chapter Overview
- 3.2. Introduction to DNA Cloning
- 3.3. Methods of DNA Cloning
- 3.3.1. Restriction Enzyme Based Cloning
- 3.3.2. PCR Cloning
- 3.3.3. Ligation Independent Cloning
- 3.3.4. TA Cloning
- 3.3.5. Blunt End Cloning
- 3.3.6. Seamless Cloning
- 3.3.7. Recombinational Cloning
- 3.4. Techniques Used in DNA and Gene Cloning
- 3.4.1. Molecular Cloning
- 3.4.2. Genetic Synthesis
- 3.4.3. Custom Cloning
- 3.5. Types of Genes Cloned
- 3.5.2. Standard Genes
- 3.5.3. Complex Genes
- 3.6. Type of Expression Systems Used in DNA and Gene Cloning
- 3.6.1. Mammalian Expression System
- 3.6.2. Insect Expression System
- 3.6.3. Bacterial Expression System
- 3.6.4. Plant Expression System
- 3.6.5. Yeast Expression System
- 3.7. Cloning Vectors
- 3.7.1. Plasmids
- 3.7.2. Bacteriophages
- 3.7.3. Bacterial Artificial Chromosomes (BACs)
- 3.7.4. Yeast Artificial Chromosomes (YACs)
- 3.7.5. Mammalian Artificial Chromosomes (MACs)
- 3.8. Applications of DNA and Gene Cloning
- 3.8.1. Gene Synthesis
- 3.8.2. Gene Expression
- 3.8.3. Vaccine Research
- 3.8.4. Gene Therapy
- 3.8.5. Genomic Library
- 3.9. Challenges associated with DNA and Gene Cloning
- 3.10. Outsourcing of DNA and Gene Cloning Services
- 3.11. Future Perspectives
4. MARKET LANDSCAPE: DNA and Gene Cloning Service Providers
- 4.1. Chapter Overview
- 4.2. DNA and Gene Cloning Service Providers Landscape
- 4.2.1. Analysis by Year of Establishment
- 4.2.2. Analysis by Company Size
- 4.2.3. Analysis by Region of Headquarters
- 4.2.4. Analysis by Company Size and Region of Headquarters
- 4.3. DNA and Gene Cloning Services: Overall Market Landscape
- 4.3.1. Analysis by Type of Service(s) Offered
- 4.3.2. Analysis by Cloning Method(s) Used
- 4.3.3. Analysis by Type of Gene(s) Cloned
- 4.3.4. Analysis by Expression System(s) Used
- 4.3.5. Analysis by Cloning Vector(s) Used
- 4.3.6. Analysis by End User
5. BENCHMARK ANALYSIS
- 5.1. Chapter Overview
- 5.2. Assumptions and Key Parameters
- 5.3. Methodology
- 5.4. Benchmark Analysis: Peer Groups
- 5.4.1. Benchmark Analysis: North America (Peer Group I)
- 5.4.2. Benchmark Analysis: North America (Peer Group II)
- 5.4.3. Benchmark Analysis: North America (Peer Group III)
- 5.4.4. Benchmark Analysis: Europe (Peer Group IV)
- 5.4.5. Benchmark Analysis: Europe (Peer Group V)
- 5.4.6. Benchmark Analysis: Asia-Pacific and Rest of the World (Peer Group VI)
- 5.4.7. Benchmark Analysis: Asia-Pacific and Rest of the World (Peer Group VII)
6. COMPANY PROFILES
- 6.1. Chapter Overview
- 6.2. Aragen Life Sciences
- 6.2.1. Company Overview
- 6.2.2. Service Portfolio
- 6.2.3. Recent Developments and Future Outlook
- 6.3. Bio-Techne
- 6.3.1. Company Overview
- 6.3.2. Financial Information
- 6.3.3. Service Portfolio
- 6.3.4. Recent Developments and Future Outlook
- 6.4. Charles River Laboratories
- 6.4.1. Company Overview
- 6.4.2. Financial Information
- 6.4.3. Service Portfolio
- 6.4.4. Recent Developments and Future Outlook
- 6.5. Curia
- 6.5.1. Company Overview
- 6.5.2. Service Portfolio
- 6.5.3. Recent Developments and Future Outlook
- 6.6. Eurofins
- 6.6.1. Company Overview
- 6.6.2. Financial Information
- 6.6.3. Service Portfolio
- 6.6.4. Recent Developments and Future Outlook
- 6.7. GenScript
- 6.7.1. Company Overview
- 6.7.2. Financial Information
- 6.7.3. Service Portfolio
- 6.7.4. Recent Developments and Future Outlook
- 6.8. Integrated DNA Technologies
- 6.8.1. Company Overview
- 6.8.2. Service Portfolio
- 6.8.3. Recent Developments and Future outlook
- 6.9. MedGenome
- 6.9.1. Company Overview
- 6.9.2. Service Portfolio
- 6.9.3. Recent Developments and Future Outlook
- 6.10. Sino Biological
- 6.10.1. Company Overview
- 6.10.2. Service Portfolio
- 6.10.3. Recent Developments and Future Outlook
- 6.11. Syngene
- 6.11.1. Company Overview
- 6.11.2. Financial Information
- 6.11.3. Service Portfolio
- 6.11.4. Recent Developments and Future Outlook
- 6.12. Twist Bioscience
- 6.12.1. Company Overview
- 6.12.2. Financial Information
- 6.12.3. Service Portfolio
- 6.12.4. Recent Developments and Future Outlook
7. PATENT ANALYSIS
- 7.1. Chapter Overview
- 7.2. Scope and Methodology
- 7.3. DNA and Gene Cloning: Patent Analysis
- 7.3.1. Analysis by Publication Year
- 7.3.2. Analysis by Application Year
- 7.3.3. Analysis by Annual Number of Granted Patents and Patent Applications
- 7.3.4. Analysis by Geographical Location
- 7.3.5. Analysis by CPC Symbols
- 7.3.6. Analysis by Focus Area
- 7.3.7. Analysis by Type of Applicant
- 7.3.8. Leading Players: Analysis by Number of Patents
- 7.3.9. Leading Individual Assignees: Analysis by Number of Patents
- 7.4. DNA and Gene Cloning: Patent Benchmarking Analysis
- 7.4.1. Analysis by Patent Characteristics
- 7.5. DNA and Gene Cloning: Patent Valuation Analysis
- 7.6. Leading Patents by Number of Citations
8. PUBLICATION ANALYSIS
- 8.1. Chapter Overview
- 8.2. Scope and Methodology
- 8.2.1. Analysis by Year of Publication
- 8.2.2. Analysis by Type of Cloning
- 8.2.3. Word Cloud: Emerging Focus Areas
- 8.2.4. Popular Journals: Analysis by Number of Publications
- 8.2.5. Leading Authors: Analysis by Number of Publications
- 8.2.6. Leading First Authors: Analysis by Number of Publications
9. GLOBAL EVENT ANALYSIS
- 9.1. Chapter Overview
- 9.2. Scope and Methodology
- 9.3. List of Global Events related to DNA and Gene Cloning
- 9.3.1. Analysis by Year of Event
- 9.3.2. Analysis by Event Platform
- 9.3.3. Analysis by Type of Event
- 9.3.4. Analysis by Geography
- 9.3.5. Word Cloud: Evolutionary Trends in Event Agenda / Key Focus Area
- 9.3.6. Most Active Participants: Analysis by Number of Events
- 9.3.7. Analysis by Seniority Level of Event Speakers
- 9.3.8. Geographical Mapping of Upcoming Events
10. MARKET FORECAST
- 10.1. Chapter Overview
- 10.2. Forecast Methodology and Key Assumptions
- 10.3. Global DNA and Gene Cloning Services Market, Till 2035
- 10.3.1. DNA and Gene Cloning Services Market: Distribution by Services Offered
- 10.3.1.1. DNA and Gene Cloning Services Market for Gene Synthesis, Till 2035
- 10.3.1.2. DNA and Gene Cloning Services Market for Custom Cloning, Till 2035
- 10.3.1.3. DNA and Gene Cloning Services Market for Sub-cloning, Till 2035
- 10.3.1.4. DNA and Gene Cloning Services Market for Other Services, Till 2035
- 10.3.2. DNA and Gene Cloning Services Market: Distribution by Type of Genes Cloned
- 10.3.2.1. DNA and Gene Cloning Services Market for Standard Gene, Till 2035
- 10.3.2.2. DNA and Gene Cloning Services Market for Complex Gene, Till 2035
- 10.3.2.3. DNA and Gene Cloning Services Market for Other Genes, Till 2035
- 10.3.3. DNA and Gene Cloning Services Market: Distribution by Company Size
- 10.3.3.1. DNA and Gene Cloning Services Market for Small Companies, Till 2035
- 10.3.3.2. DNA and Gene Cloning Services Market for Mid-sized Companies, Till 2035
- 10.3.3.3. DNA and Gene Cloning Services Market for Large Companies, Till 2035
- 10.3.4. DNA and Gene Cloning Services Market: Distribution by End User Industry
- 10.3.4.1. DNA and Gene Cloning Services Market for Academic and R&D, Till 2035
- 10.3.4.2. DNA and Gene Cloning Services Market for Pharmaceutical and Biotechnology Companies, Till 2035
- 10.3.4.3. DNA and Gene Cloning Services Market for Other End Users, Till 2035
- 10.3.5. DNA and Gene Cloning Services Market: Distribution by Key Geographical Regions
- 10.3.5.1. DNA and Gene Cloning Services Market in North America, Till 2035
- 10.3.5.2. DNA and Gene Cloning Services Market in Europe, Till 2035
- 10.3.5.3. DNA and Gene Cloning Services Market in Asia-Pacific, Till 2035
- 10.3.5.4. DNA and Gene Cloning Services Market in Latin America, Till 2035
- 10.3.5.5. DNA and Gene Cloning Services Market in MENA, Till 2035
- 10.3.1. DNA and Gene Cloning Services Market: Distribution by Services Offered
11. CASE STUDY: DNA AND GENE CLONING KITS AND REAGENTS
- 11.1. Chapter Overview
- 11.2. DNA Cloning Kits
- 11.2.1. Analysis by Kit Components
- 11.2.2. Analysis by Number of Reactions
- 11.2.3. Analysis by Type of Cloning Method Used
- 11.2.4. Analysis by Type of Fragment(s) Cloned
- 11.2.5. Analysis by Cloning Time
- 11.2.6. Analysis by Efficacy
- 11.2.7. Analysis by Kit Shelf Life
- 11.3. DNA Cloning Reagents
- 11.3.1. Analysis by Unit Size
- 11.3.2. Analysis by Reagent Concentration
- 11.3.3. Analysis by Reagent Components
- 11.3.4. Analysis by Exonuclease Activity
- 11.3.5. Analysis by Product Overhangs
- 11.3.6. Analysis by Heat Inactivation Temperature
- 11.3.7. Analysis by Storage Temperature
- 11.4. Players in North America
- 11.4.1. DNA Cloning Kit Developers
- 11.4.2. DNA Cloning Reagent Developers
- 11.4.3. DNA Cloning Service Providers
- 11.5. Players in Europe
- 11.5.1. DNA Cloning Kit Developers
- 11.5.2. DNA Cloning Reagent Developers
- 11.5.3. DNA Cloning Service Providers
- 11.6. Players in Asia-Pacific and Rest of the World
- 11.6.1. DNA Cloning Kit Developers
- 11.6.2. DNA Cloning Reagent Developers
- 11.6.3. DNA Cloning Service Providers
12. CONCLUDING REMARKS
13. EXECUTIVE INSIGHTS
14. APPENDIX I: TABULATED DATA
15. APPENDIX II: LIST OF COMPANIES AND ORGANIZATIONS
List of Tables
- Table 4.1 DNA and Gene Cloning Service Providers: List of Players
- Table 4.2 DNA and Gene Cloning Services: Information on Type of Service(s) Offered, Cloning Method(s) Used and Type of Gene(s) Cloned
- Table 4.3 DNA and Gene Cloning Services: Information on Type of Expression System(s) Used, Cloning Vector(s) Used and End User
- Table 5.1 Benchmark Analysis: Information on Peer Groups
- Table 6.1 DNA, Gene and Molecular Cloning Service Providers: List of Companies Profiled
- Table 6.2 Aragen Life Sciences: Company Snapshot
- Table 6.3 Aragen Life Sciences: Service Portfolio
- Table 6.4 Aragen Life Sciences: Recent Developments and Future Outlook
- Table 6.5 Bio-Techne: Company Snapshot
- Table 6.6 Bio-Techne: Service Portfolio
- Table 6.7 Bio-Techne: Recent Developments and Future Outlook
- Table 6.8 Charles River Laboratories: Company Snapshot
- Table 6.9 Charles River Laboratories: Service Portfolio
- Table 6.10 Charles River Laboratories: Recent Developments and Future Outlook
- Table 6.11 Curia: Company Snapshot
- Table 6.12 Curia: Service Portfolio
- Table 6.13 Curia: Recent Developments and Future Outlook
- Table 6.14 Eurofins: Company Snapshot
- Table 6.15 Eurofins: Service Portfolio
- Table 6.16 GenScript: Company Snapshot
- Table 6.17 GenScript: Service Portfolio
- Table 6.18 GenScript: Recent Developments and Future Outlook
- Table 6.19 Integrated DNA Technologies: Company Snapshot
- Table 6.20 Integrated DNA Technologies: Service Portfolio
- Table 6.21 Integrated DNA Technologies: Recent Developments and Future Outlook
- Table 6.22 MedGenome: Company Snapshot
- Table 6.23 MedGenome: Service Portfolio
- Table 6.24 MedGenome: Recent Developments and Future Outlook
- Table 6.25 Sino Biological: Company Snapshot
- Table 6.26 Sino Biological: Service Portfolio
- Table 6.27 Sino Biological: Recent Developments and Future Outlook
- Table 6.28 Syngene: Company Snapshot
- Table 6.29 Syngene: Service Portfolio
- Table 6.30 Syngene: Recent Developments and Future Outlook
- Table 6.31 Twist Bioscience: Company Snapshot
- Table 6.32 Twist Bioscience: Service Portfolio
- Table 6.33 Twist Bioscience: Recent Developments and Future Outlook
- Table 7.1 Patent Analysis: Prominent CPC Symbols
- Table 7.2 Patent Analysis: Most Popular CPC Symbols
- Table 7.3 Patent Analysis: List of Top CPC Symbols
- Table 7.4 Patent Analysis: Summary of Benchmarking Analysis
- Table 7.5 Patent Analysis: Categorization based on Weighted Valuation Scores
- Table 7.6 Patent Portfolio: List of Leading Patents (by Highest Relative Valuation)
- Table 7.7 Patent Portfolio: List of Leading Patents (by Number of Citations)
- Table 9.1 List of Global Events Related to DNA, Gene and Molecular Cloning
- Table 13.1 Cheeky Scientist: Company Snapshot
- Table 13.2 RD Biotech: Company Snapshot
- Table 14.1 DNA and Gene Cloning Service Providers: Distribution by Year of Establishment
- Table 14.2 DNA and Gene Cloning Service Providers: Distribution by Company Size
- Table 14.3 DNA and Gene Cloning Service Providers: Distribution by Region of Headquarters
- Table 14.4 DNA and Gene Cloning Service Providers: Distribution by Location of Headquarters
- Table 14.5 DNA and Gene Cloning Service Providers: Distribution by Company Size and Region of Headquarters
- Table 14.6 DNA and Gene Cloning Services: Distribution by Type of Service(s) Offered
- Table 14.7 DNA and Gene Cloning Services: Distribution by Type of Cloning Method(s) Used
- Table 14.8 DNA and Gene Cloning Services: Distribution by Type of Gene(s) Cloned
- Table 14.9 DNA and Gene Cloning Services: Distribution by Type of Expression System(s) Used
- Table 14.10 DNA and Gene Cloning Services: Distribution by Type of Cloning Vector(s) Used
- Table 14.11 DNA and Gene Cloning Services: Distribution by End User Industry
- Table 14.12 Bio-Techne: Annual Revenues, Since 2017 (USD Million)
- Table 14.13 Charles River Laboratories: Annual Revenues, Since 2017 (USD Billion)
- Table 14.14 Eurofins: Annual Revenues, Since 2017 (EUR Billion)
- Table 14.15 GenScript: Annual Revenues, Since 2017 (USD Billion)
- Table 14.16 Syngene: Annual Revenues, Since 2017 (INR Billion)
- Table 14.17 Twist Bioscience: Annual Revenues, Since 2017 (USD Million)
- Table 14.18 Patent Analysis: Distribution by Type of Patent
- Table 14.19 Patent Analysis: Cumulative Distribution by Publication Year, Since 2017
- Table 14.20 Patent Analysis: Cumulative Distribution by Application Year, Since 2017
- Table 14.21 Patent Analysis: Year-wise Distribution by Annual Number of Granted Patents and Patent Applications, Since 2017
- Table 14.22 Patent Analysis: Distribution by Geographical Location
- Table 14.23 Patent Analysis: Cumulative Year-wise Distribution by Type of Applicant, Since 2017
- Table 14.24 Leading Industry Players: Distribution by Number of Patents
- Table 14.25 Leading Non-Industry Players: Distribution by Number of Patents
- Table 14.26 Patent Analysis: Leading Individual Assignees
- Table 14.27 Patent Analysis (Leading Industry Players): Benchmarking by Patent Characteristics (CPC Symbols)
- Table 14.28 Patent Analysis: Distribution by Patent Age
- Table 14.29 Patent Valuation Analysis
- Table 14.30 Publication Analysis: Cumulative Year-wise Trend, Since 2018
- Table 14.31 Publication Analysis: Distribution by Type of Cloning
- Table 14.32 Popular Journals: Distribution by Number of Publications
- Table 14.33 Leading Authors: Distribution by Number of Publications
- Table 14.34 Leading First Authors: Distribution by Number of Publications
- Table 14.35 Global Events: Cumulative Half Yearly Trend, Since 2017
- Table 14.36 Global Events: Distribution by Event Platform
- Table 14.37 Global Events: Distribution by Type of Event
- Table 14.38 Global Events: Regional Distribution of Events
- Table 14.39 Most Active Participants: Distribution by Number of Events
- Table 14.40 Global Events: Distribution by Seniority Level of Event Speakers
- Table 14.41 Global Events: Distribution by Affiliated Department of Event Speakers
- Table 14.42 Global DNA and Gene Cloning Services Market, Till 2035 (USD Million)
- Table 14.43 DNA and Gene Cloning Services Market: Distribution by Services Offered
- Table 14.44 DNA and Gene Cloning Services Market for Gene Synthesis, Till 2035 (USD Million)
- Table 14.45 DNA and Gene Cloning Services Market for Custom Cloning, Till 2035 (USD Million)
- Table 14.46 DNA and Gene Cloning Services Market for Sub-cloning, Till 2035 (USD Million)
- Table 14.47 DNA and Gene Cloning Services Market for Other Services, Till 2035 (USD Million)
- Table 14.48 DNA and Gene Cloning Services Market: Distribution by Type of Genes Cloned
- Table 14.49 DNA and Gene Cloning Services Market for Standard Gene, Till 2035 (USD Million)
- Table 14.50 DNA and Gene Cloning Services Market for Complex Gene, Till 2035 (USD Million)
- Table 14.51 DNA and Gene Cloning Services Market for Other Genes, Till 2035 (USD Million)
- Table 14.52 DNA and Gene Cloning Services Market: Distribution by Company Size
- Table 14.53 DNA and Gene Cloning Services Market for Small Companies, Till 2035 (USD Million)
- Table 14.54 DNA and Gene Cloning Services Market for Mid-sized Companies, Till 2035 (USD Million)
- Table 14.55 DNA and Gene Cloning Services Market for Large Companies, Till 2035 (USD Million)
- Table 14.56 DNA and Gene Cloning Services Market: Distribution by End User Industry
- Table 14.57 DNA and Gene Cloning Services Market for Academic and R&D, Till 2035 (USD Million)
- Table 14.58 DNA and Gene Cloning Services Market for Pharmaceutical and Biotechnology Companies, Till 2035 (USD Million)
- Table 14.59 DNA and Gene Cloning Services Market for Other End Users, Till 2035 (USD Million)
- Table 14.60 DNA and Gene Cloning Services Market: Distribution by Key Geographical Regions
- Table 14.61 DNA and Gene Cloning Services Market in North America, Till 2035 (USD Million)
- Table 14.62 DNA and Gene Cloning Services Market in Europe, Till 2035 (USD Million)
- Table 14.63 DNA and Gene Cloning Services Market in Asia-Pacific, Till 2035 (USD Million)
- Table 14.64 DNA and Gene Cloning Services Market in Latin America, Till 2035 (USD Million)
- Table 14.65 DNA and Gene Cloning Services Market in MENA, Till 2035 (USD Million)
- Table 14.66 DNA Cloning Kits: Distribution by Kit Components
- Table 14.67 DNA Cloning Kits: Distribution by Number of Reactions
- Table 14.68 DNA Cloning Kits: Distribution by Type of Cloning Method Used
- Table 14.69 DNA Cloning Kits: Distribution by Type of Fragment(s) Cloned
- Table 14.70 DNA Cloning Kits: Distribution by Cloning Time
- Table 14.71 DNA Cloning Kits: Distribution by Kit Shelf Life
- Table 14.72 DNA Cloning Reagents: Distribution by Unit Size
- Table 14.73 DNA Cloning Reagents: Distribution by Reagent Concentration (units/μl)
- Table 14.74 DNA Cloning Reagents: Distribution by Reagent Components
- Table 14.75 DNA Cloning Reagents: Distribution by Exonuclease Activity
- Table 14.76 DNA Cloning Reagents: Distribution by Product Overhangs
- Table 14.77 DNA Cloning Reagents: Distribution by Heat Inactivation Temperature
- Table 14.78 DNA Cloning Reagents: Distribution by Storage Temperature
List of Figures
- Figure 2.1 Executive Summary: DNA and Gene Cloning Services Market Landscape
- Figure 2.2 Executive Summary: Patent Analysis
- Figure 2.3 Executive Summary: Publication Analysis
- Figure 2.4 Executive Summary: Global Event Analysis
- Figure 2.5 Executive Summary: Market Forecast
- Figure 3.1 Mechanism of Restriction Enzyme Based Cloning
- Figure 3.2 Mechanism of PCR Cloning
- Figure 3.3 Mechanism of Ligation-independent cloning
- Figure 3.4 Mechanism of TA cloning
- Figure 3.5 Mechanism of Blunt End Cloning
- Figure 3.5 Mechanism of Seamless Cloning
- Figure 3.6 Mechanism of Recombinational Cloning
- Figure 3.7 Mechanism of Molecular Cloning
- Figure 3.8 Types of Expression Systems
- Figure 3.9 Applications of DNA and Gene Cloning
- Figure 4.1 DNA and Gene Cloning Service Providers: Distribution by Year of Establishment
- Figure 4.2 DNA and Gene Cloning Service Providers: Distribution by Company Size
- Figure 4.3 DNA and Gene Cloning Service Providers: Distribution by Region of Headquarters
- Figure 4.4 DNA and Gene Cloning Service Providers: Distribution by Location of Headquarters
- Figure 4.5 DNA and Gene Cloning Service Providers: Distribution by Company Size and Region of Headquarters
- Figure 4.6 DNA and Gene Cloning Services: Distribution by Type of Service(s) Offered
- Figure 4.7 DNA and Gene Cloning Services: Distribution by Type of Cloning Method(s) Used
- Figure 4.8 DNA and Gene Cloning Services: Distribution by Type of Gene(s) Cloned
- Figure 4.9 DNA and Gene Cloning Services: Distribution by Type of Expression System(s) Used
- Figure 4.10 DNA and Gene Cloning Services: Distribution by Type of Cloning Vector(s) Used
- Figure 4.11 DNA and Gene Cloning Services: Distribution by End User Industry
- Figure 5.1 Benchmark Analysis: Distribution by Company Size
- Figure 5.2 Company Competitiveness: Players based in North America (Peer Group I)
- Figure 5.3 Benchmark Analysis: Players based in North America (Peer Group I)
- Figure 5.4 Company Competitiveness: Players based in North America (Peer Group II)
- Figure 5.5 Benchmark Analysis: Players based in North America (Peer Group II)
- Figure 5.6 Company Competitiveness: Players based in North America (Peer Group III)
- Figure 5.7 Benchmark Analysis: Players based in North America (Peer Group III)
- Figure 5.8 Company Competitiveness: Players based in Europe (Peer Group IV)
- Figure 5.9 Benchmark Analysis: Players based in Europe (Peer Group IV)
- Figure 5.10 Company Competitiveness: Players based in Europe (Peer Group V)
- Figure 5.11 Benchmark Analysis: Players based in Europe (Peer Group V)
- Figure 5.12 Company Competitiveness: Players based in Asia Pacific and Rest of the World (Peer Group VI)
- Figure 5.13 Benchmark Analysis: Players based in Asia Pacific and Rest of the World (Peer Group VI)
- Figure 5.14 Company Competitiveness: Players based in Asia Pacific and Rest of the World (Peer Group VII)
- Figure 5.15 Benchmark Analysis: Players based in Asia Pacific and Rest of the World (Peer Group VII)
- Figure 6.1 Bio-Techne: Annual Revenues, Since 2017 (USD Million)
- Figure 6.2 Charles River Laboratories: Annual Revenues, Since 2017 (USD Billion)
- Figure 6.3 Eurofins: Annual Revenues, Since 2017 (EUR Billion)
- Figure 6.4 GenScript: Annual Revenues, Since 2017 (USD Billion)
- Figure 6.5 Syngene: Annual Revenues, Since 2017 (INR Billion)
- Figure 6.6 Twist Bioscience: Annual Revenues, Since 2017 (USD Million)
- Figure 7.1 Patent Analysis: Distribution by Type of Patent
- Figure 7.2 Patent Analysis: Cumulative Distribution by Publication Year, Since 2017
- Figure 7.3 Patent Analysis: Cumulative Distribution by Application Year, Since 2017
- Figure 7.4 Patent Analysis: Year-wise Distribution by Annual Number of Granted Patents and Patent Applications, Since 2017
- Figure 7.5 Patent Analysis: Distribution by Geographical Location
- Figure 7.6 Patent Analysis: Distribution by CPC Symbols
- Figure 7.7 Word Cloud: Emerging Focus Areas
- Figure 7.8 Patent Analysis: Cumulative Year-wise Distribution by Type of Applicant Since 2017
- Figure 7.9 Leading Industry Players: Distribution by Number of Patents
- Figure 7.10 Leading Non-Industry Players: Distribution by Number of Patents
- Figure 7.11 Patent Analysis: Leading Individual Assignees
- Figure 7.12 Patent Analysis (Leading Industry Players): Benchmarking by Patent Characteristics (CPC Symbols)
- Figure 7.13 Patent Analysis: Distribution by Patent Age
- Figure 7.14 Patent Valuation Analysis
- Figure 8.1 Publication Analysis: Cumulative Year-wise Trend, Since 2018
- Figure 8.2 Publication Analysis: Distribution by Type of Cloning
- Figure 8.3 Word Cloud: Emerging Focus Areas
- Figure 8.4 Popular Journals: Distribution by Number of Publications
- Figure 8.5 Leading Authors: Distribution by Number of Publications
- Figure 8.6 Leading First Authors: Distribution by Number of Publications
- Figure 9.1 Global Events: Cumulative Half Yearly Trend, Since 2017
- Figure 9.2 Global Events: Distribution by Event Platform
- Figure 9.3 Global Events: Distribution by Type of Event
- Figure 9.4 Global Events: Regional Distribution of Events
- Figure 9.5 Word Cloud: Evolutionary Trends in Event Agenda / Key Focus Area
- Figure 9.6 Global Events: Historical Trend of Event Agendas, Since 2017
- Figure 9.7 Most Active Participants: Distribution by Number of Events
- Figure 9.8 Global Events: Distribution by Seniority Level of Event Speakers
- Figure 9.9 Global Events: Distribution by Affiliated Department of Event Speakers
- Figure 9.10 Global Events: Geographical Mapping of Upcoming Events
- Figure 10.1 Global DNA and Gene Cloning Services Market, Till 2035 (USD Million)
- Figure 10.2 DNA and Gene Cloning Services Market: Distribution by Services Offered
- Figure 10.3 DNA and Gene Cloning Services Market for Gene Synthesis, Till 2035 (USD Million)
- Figure 10.4 DNA and Gene Cloning Services Market for Custom Cloning, Till 2035 (USD Million)
- Figure 10.5 DNA and Gene Cloning Services Market for Sub-cloning, Till 2035 (USD Million)
- Figure 10.6 DNA and Gene Cloning Services Market for Other Services, Till 2035 (USD Million)
- Figure 10.7 DNA and Gene Cloning Services Market: Distribution by Type of Genes Cloned
- Figure 10.8 DNA and Gene Cloning Services Market for Standard Gene, Till 2035 (USD Million)
- Figure 10.9 DNA and Gene Cloning Services Market for Complex Gene, Till 2035 (USD Million)
- Figure 10.10 DNA and Gene Cloning Services Market for Other Genes, Till 2035 (USD Million)
- Figure 10.11 DNA and Gene Cloning Services Market: Distribution by Company Size
- Figure 10.12 DNA and Gene Cloning Services Market for Small Companies, Till 2035 (USD Million)
- Figure 10.13 DNA and Gene Cloning Services Market for Mid-sized Companies, Till 2035 (USD Million)
- Figure 10.14 DNA and Gene Cloning Services Market for Large Companies, Till 2035 (USD Million)
- Figure 10.15 DNA and Gene Cloning Services Market: Distribution by End User Industry
- Figure 10.16 DNA and Gene Cloning Services Market for Academic and R&D, Till 2035 (USD Million)
- Figure 10.17 DNA and Gene Cloning Services Market for Pharmaceutical and Biotechnology Companies, Till 2035 (USD Million)
- Figure 10.18 DNA and Gene Cloning Services Market for Other End Users, Till 2035 (USD Million)
- Figure 10.19 DNA and Gene Cloning Services Market: Distribution by Key Geographical Regions
- Figure 10.20 DNA and Gene Cloning Services Market in North America, Till 2035 (USD Million)
- Figure 10.21 DNA and Gene Cloning Services Market in Europe, Till 2035 (USD Million)
- Figure 10.22 DNA and Gene Cloning Services Market in Asia-Pacific, Till 2035 (USD Million)
- Figure 10.23 DNA and Gene Cloning Services Market in Latin America, Till 2035 (USD Million)
- Figure 10.24 DNA and Gene Cloning Services Market in MENA, Till 2035 (USD Million)
- Figure 11.1 DNA Cloning Kits: Distribution by Kit Components
- Figure 11.2 DNA Cloning Kits: Distribution by Number of Reactions
- Figure 11.3 DNA Cloning Kits: Distribution by Type of Cloning Method Used
- Figure 11.4 DNA Cloning Kits: Distribution by Type of Fragment(s) Cloned
- Figure 11.5 DNA Cloning Kits: Distribution by Cloning Time
- Figure 11.7 DNA Cloning Kits: Distribution by Kit Shelf Life
- Figure 11.8 DNA Cloning Reagents: Distribution by Unit Size
- Figure 11.9 DNA Cloning Reagents: Distribution by Reagent Concentration (units/μl)
- Figure 11.10 DNA Cloning Reagents: Distribution by Reagent Components
- Figure 11.11 DNA Cloning Reagents: Distribution by Exonuclease Activity
- Figure 11.12 DNA Cloning Reagents: Distribution by Product Overhangs
- Figure 11.13 DNA Cloning Reagents: Distribution by Heat Inactivation Temperature
- Figure 11.14 DNA Cloning Reagents: Distribution by Storage Temperature (?C)
- Figure 11.15 DNA Cloning Kit Developers in North America
- Figure 11.16 DNA Cloning Reagent Developers in North America
- Figure 11.17 DNA Cloning Service Providers in North America
- Figure 11.18 DNA Cloning Kit Developers in Europe
- Figure 11.19 DNA Cloning Reagent Developers in Europe
- Figure 11.20 DNA Cloning Service Providers in Europe
- Figure 11.21 DNA Cloning Kit Developers in Asia-Pacific and Rest of the World
- Figure 11.22 DNA Cloning Reagent Developers in Asia-Pacific and Rest of the World
- Figure 11.23 DNA Cloning Service Providers in Asia-Pacific and Rest of the World
- Figure 12.1 Concluding Remarks: Overall Market Landscape of DNA and Gene Cloning Services
- Figure 12.2 Concluding Remarks: Patent Analysis
- Figure 12.3 Concluding Remarks: Publication Analysis
- Figure 12.4 Concluding Remarks: Global Event Analysis
- Figure 12.5 Concluding Remarks: Market Forecast

