
PUBLISHER: Roots Analysis | PRODUCT CODE: 1771302

PUBLISHER: Roots Analysis | PRODUCT CODE: 1771302
Chronic Pain Treatment Market: Industry Trends and Global Forecasts - Distribution by Type of Indication, Type of Molecule, Mechanism of Action and Key Geographical Regions
GLOBAL CHRONIC PAIN TREATMENT MARKET: OVERVIEW
As per Roots Analysis, the global chronic pain treatment market valued at USD 7.3 billion in the current year is anticipated to grow at a lucrative CAGR during the forecast period.
The market sizing and opportunity analysis has been segmented across the following parameters:
Type of Indication
- Chronic Back Pain
- Lumbar Radiculopathy
- Migraine
- Osteoarthritis
- Neuropathic Pain
Type of Molecule
- Small Molecule
- Biologic
Mechanism of Action
- CGRP Inhibitors
- COX/ NGF Inhibitors
- TRPV1 Receptor Antagonists
- Channel Blockers
- Others
Key Geographical Regions
- North America
- Europe
- Asia-Pacific
- Latin America
- Middle East and North Africa
GLOBAL CHRONIC PAIN TREATMENT MARKET: GROWTH AND TRENDS
Chronic pain is a psychophysiological response to an underlying medical condition that persists for more than six months and typically does not respond to various treatment approaches. It is worth mentioning that as per the estimates over 1.5 billion people worldwide experience this form of pain. Notably, opioids remain among the most commonly used pharmacological treatments for moderate to severe pain. This can be attributed to their rapid onset of action and high effectiveness in providing immediate relief. However, opioids can induce feelings of euphoria, which often leads to misuse and addiction. Further, increased recreational use has significantly contributed to the problem of opioid dependency. In fact, according to a 2024 report by CDC's National Center for Health Statistics, 54,743 people died in the United States as a result of misuse of prescribed opioids. The severity of the opioid crisis has driven pharmaceutical companies to focus on developing non-addictive, non-narcotic therapeutics and analgesics for the management of chronic pain.
In contrast to opioids, non-opioid medications do not target brain receptors and are therefore non-addictive. These drugs act directly on injured or diseased tissues, specifically by blocking the production of prostaglandins through inhibition of the cyclooxygenase (COX) enzyme at the site of injury or infection. This mechanism reduces the formation of pain mediators within the peripheral nervous system. Furthermore, a variety of pain management devices have been shown to significantly decrease or even eliminate the need for drug-based treatments.
GLOBAL CHRONIC PAIN TREATMENT MARKET: KEY INSIGHTS
The report delves into the current state of global chronic pain treatment market and identifies potential growth opportunities within industry. Some key findings from the report include:
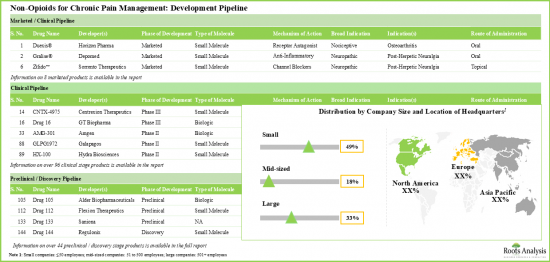
- With few approved drugs and several clinical / preclinical candidates, the market for non-opioid pain management solutions is growing at a commendable pace.
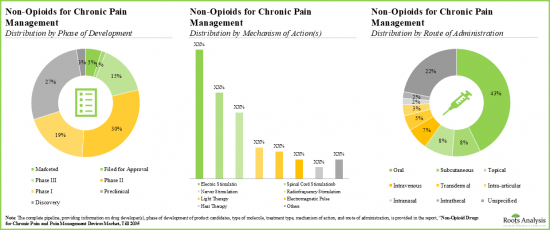
- Majority (>45%) of the pipeline candidates, having diverse mechanisms of action, are in the early stages of development; the oral route continues to be the preferred mode of drug delivery.
- Given a strong early-stage and preclinical pipeline, the industry is likely to address the current unmet need for non-opioid alternatives with novel biological targets.
- There are several clinical stage receptor agonists designed to target the TRPV1 receptor. Most of the marketed drugs are anti-inflammatory agents and calcium channel blockers.
- Notably, majority (~45%) of the non-opioids for chronic pain management are administered through oral route of administration.
- Benefited by easily blocking ion-channels and antagonizing pain proliferating receptors, the pipeline offers many small molecules in both advanced and preclinical stages.
- Over time, several device-based pain management solutions have also emerged as viable alternatives to narcotic drugs / therapies.
- We identified various devices, based on diverse pain relief technologies, which can be either implanted or superficially applied on the body to provide relief from pain.
- Numerous devices have a competitive advantage by focusing on the pain sensation area; examples of such devices include ActiPatch, BioBeam 940, CareTec IV.
- With friendly user interface, wearable (25%) and hand-held devices (20%) are likely to be adopted by a wide customer base; examples include ElectroCore and Interx Technologies.
- Although the market is characterized with multiple stimulation-based devices, next generation devices focus on innovative and less invasive mechanisms for pain relief.
- In pursuit of gaining a competitive edge, manufacturers are focusing on the integration of advanced features in their respective product portfolios.
- Companies have raised significant amounts in financing as investors have realized numerous benefits and future potential for non-opioid alternatives to chronic pain.
- Investments in various companies have fostered innovation in this domain; examples include Centrexion Therapeutics, Hydra Bioscience, NeurogesX and Vapogenix.
- The significant share of investments was raised by stakeholders through various rounds of venture capital funding, primarily in venture series B.
- Multiple investors have supported the initiatives of non-opioid drug developers; huge amount has been awarded only by NIH in the domain.
- With the growing interest in the field of chronic pain therapeutics, several partnerships have been established between device providers and other stakeholders. Notably, most (>25%) of the partnerships were commercialization agreements.
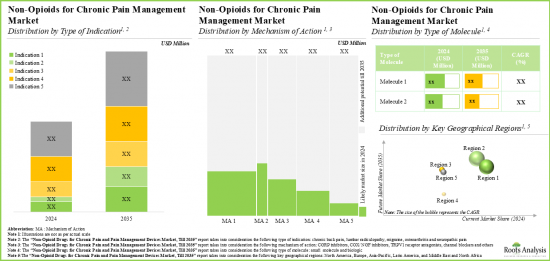
- Prevalent trends indicate that the market is likely to grow at a significant pace as multiple late-stage molecules receive marketing approval in the foreseen future.
Example Players in the Chronic Pain Treatment Market
- Stimwave
- BlueWind Medical
- Omron Healthcare
- Cefaly Technologies
- Prizm Medical
- PainPod
- Neurometrix
- Chattem
- Silk'n Therapy
- ElectroMedical Technologies
PRIMARY RESEARCH OVERVIEW
The opinions and insights presented in this study were influenced by discussions conducted with multiple stakeholders. The research report features detailed transcripts of interviews conducted with the following industry stakeholders:
- Chief Executive Officer, Company A
- Chief Advocacy Officer, Company B
- Chief Executive Officer, Company C
- Director of Clinical Affairs and New Markets, Company D
GLOBAL CHRONIC PAIN TREATMENT MARKET: RESEARCH COVERAGE
- Market Sizing and Opportunity Analysis: The report features an in-depth analysis of the global chronic pain treatment market, focusing on key market segments, including [A] type of indication, [B] type of molecule, [C] mechanism of action and [D] key geographical regions.
- Drugs Market Landscape: A comprehensive evaluation of drugs being developed for the treatment of chronic pain, considering various parameters, such as [A] information on their respective developer(s), [B] phase of development, [C] type of molecule, [D] indication, [E] mechanism of action and [F] route of administration.
- Pipeline Review of Marketed and Development Drugs: A detailed analysis of product pipeline and developer companies, highlighting [A] a mirror analysis depicting the relative popularity of different disease indications based on the number of molecules available / under development for each indication and the number of companies involved, [B] a comprehensive analysis of the various industry players involved in chronic pain treatment market, distributed on the basis of location of headquarters and company size, [C] a detailed analysis highlighting the distribution of marketed and pipeline molecules based on their respective mechanisms of action, and [D] an analysis highlighting the distribution of molecules on the basis of stage of development, route of administration and treatment type.
- Unmet Need Analysis: A comprehensive evaluation of the key unmet needs across chronic pain, highlighting insights generated from data sourced from [A] patient blogs, [B] recent scientific publications, [C] social media posts and [D] the views of key opinion leaders expressed on various online platforms.
- Lifecycle Management Strategies for Marketed Products: A detailed discussion on the lifecycle management strategies that describes how various companies are using different methods to prolong patent age and, thereby, expand marketing exclusivity in order to exploit the revenue generation potential of their proprietary products.
- Drug Profiles: In-depth profiles of drugs that are in phase III of clinical development, focusing on [A] information on developer companies, [B] type of molecule, [C] mechanism of action, [D] current status of development, [E] route of administration, [F] information on clinical trials and [G] key developments (if available).
- Chronic Pain Management Devices Market Landscape: A comprehensive evaluation of various devices that are being developed for chronic pain management, considering various parameters, such as [A] information on developer(s), [B] mechanism of action, [C] site of application on the body, [D] modality of the device, [E] treatment requirements and [F] type of device.
- Device Competitiveness Analysis and Profiles: A comprehensive device competitive analysis highlighting the most important products by examining factors, such as [A] modality of device, [B] treatment requirement, [C] type of device and [D] supplier power. Furthermore, in-depth profiles of devices that emerged as relatively superior, focusing on [A] details on the developer, [B] approval year, [C] mechanism of action, [D] key features and [E] key developments.
- Partnerships and Collaborations: An insightful analysis of the deals inked by stakeholders in the chronic pain treatment market, based on several parameters, such as [A] year of partnership, [B] type of partnership, [C] quarterly trends, [D] most active players (in terms of the number of partnerships signed) and [E] geography.
- Funding and Investments: An insightful analysis of investments made at various stages of product development, based on various relevant parameters, such as [A] types of funding, [B] amount invested, [C] most active players and [D] most active investors.
KEY QUESTIONS ANSWERED IN THIS REPORT
- How many companies are currently engaged in this market?
- Which are the leading companies in this market?
- What factors are likely to influence the evolution of this market?
- What is the current and future market size?
- What is the CAGR of this market?
- How is the current and future market opportunity likely to be distributed across key market segments?
REASONS TO BUY THIS REPORT
- The report provides a comprehensive market analysis, offering detailed revenue projections of the overall market and its specific sub-segments. This information is valuable to both established market leaders and emerging entrants.
- Stakeholders can leverage the report to gain a deeper understanding of the competitive dynamics within the market. By analyzing the competitive landscape, businesses can make informed decisions to optimize their market positioning and develop effective go-to-market strategies.
- The report offers stakeholders a comprehensive overview of the market, including key drivers, barriers, opportunities, and challenges. This information empowers stakeholders to stay abreast of market trends and make data-driven decisions to capitalize on growth prospects.
ADDITIONAL BENEFITS
- Complimentary PPT Insights Packs
- Complimentary Excel Data Packs for all Analytical Modules in the Report
- 15% Free Content Customization
- Detailed Report Walkthrough Session with Research Team
- Free Updated report if the report is 6-12 months old or older
TABLE OF CONTENTS
1. PREFACE
- 1.1. Scope of the Report
- 1.2. Research Methodology
- 1.2.1. Research Assumptions
- 1.2.2. Project Methodology
- 1.2.3. Forecast Methodology
- 1.2.4. Robust Quality Control
- 1.2.5. Key Considerations
- 1.2.5.1. Demographics
- 1.2.5.2. Economic Factors
- 1.2.5.3. Government Regulations
- 1.2.5.4. Supply Chain
- 1.2.5.5. COVID Impact / Related Factors
- 1.2.5.6. Market Access
- 1.2.5.7. Healthcare Policies
- 1.2.5.8. Industry Consolidation
- 1.3 Key Questions Answered
- 1.4. Chapter Outlines
2. EXECUTIVE SUMMARY
3. INTRODUCTION
- 3.1. Definition of Pain
- 3.2. Classification of Pain
- 3.2.1. Acute Pain
- 3.2.2. Chronic Pain
- 3.2.2.1. Classification of Chronic Pain
- 3.2.2.2. Chronic Pain and Mental Health
- 3.3. Pain Management
- 3.3.1. Therapeutics for Pain Management
- 3.3.2. Devices for Pain Management
- 3.3.3. Other Therapeutic Modalities and Interventions for Pain Management
- 3.4. Future Prospects
4. CHRONIC PAIN MANAGEMENT: UNMET NEED ANALYSIS
- 4.1. Chapter Overview
- 4.2. Unmet Need Analysis
- 4.2.1. Introduction
- 4.2.2. Patient Blogs
- 4.2.2.1. Methodology
- 4.2.2.2. Key Insights
- 4.2.3. Published Literature
- 4.2.3.1. Methodology
- 4.2.3.2. Key Insights
- 4.2.4. Social Media Platforms
- 4.2.4.1. Methodology
- 4.2.4.2. Key Insights
- 4.2.5. Expert Opinions
- 4.2.5.1. Jeffrey Curtis, MD, University of Alabama
- 4.2.5.2. Stephan Silberstein, MD, Jefferson University Hospital
- 4.2.5.3. Jeffrey Gudin, MD, Englewood Hospital and Medical Center
- 4.2.5.4. Kevin Zacharoff, MD, SUNY Stonybrook School of Medicine
- 4.2.5.5. Philip J Mease, MD, University of Washington School of Medicine
- 4.2.5.6. John D Reveille, MD, McGovern Medical School
- 4.2.5.7. Christopher R McCurdy, PhD, University of Florida
- 4.2.6. Concluding Remarks: Key Unmet Needs in Chronic Pain Management
5. PIPELINE REVIEW: MARKETED AND DEVELOPMENT DRUGS
- 5.1. Chapter Overview
- 5.2. Non-Opioid Drugs for Chronic Pain Management: Marketed and Development Pipeline
- 5.3. Non-Opioid Drugs for Chronic Pain Management: Pipeline Analysis
- 5.3.1. Analysis by Phase of Development
- 5.3.2. Analysis by Type of Molecule
- 5.3.3. Analysis by Mechanism of Action
- 5.3.4. Analysis by Route of Administration
- 5.3.5. Analysis by Target Therapeutic Indication(s)
- 5.3.6. Analysis by Size of Employee Base of Developer
- 5.3.7. Pipeline Analysis: Leading Players
- 5.3.8. Developer Logo Landscape: Distribution by Size and Location
- 5.3.9. Mirror Analysis: Distribution by Type of Indication, Number of Molecules and Manufacturer
- 5.3.10. Heptagon Representation: Distribution by Target Disease Indication and Phase of Development
- 5.3.11. Funnel Analysis: Distribution by Target Disease Indications, Route of Administration and Phase of Development
6. LIFECYCLE MANAGEMENT STRATEGIES FOR MARKETED PRODUCTS
- 6.1. Introduction
- 6.2. Product Profile: Duexis(R) (Horizon Pharma)
- 6.2.1. Overview
- 6.2.2. Mechanism of Action
- 6.2.3. Life Cycle Management Strategies
- 6.2.3.1. Strategic Pricing
- 6.2.3.2. Geographical Expansion
- 6.2.3.3. Indication Expansion
- 6.2.3.4. Extension of Patent Exclusivity
- 6.2.3.5. Authorized Generics
- 6.2.3.6. Awareness Campaigns
- 6.2.4. Partnerships and Collaborations
- 6.2.4.1. Mallinckrodt
- 6.2.4.2. Gru nenthal
- 6.3. Product Profile: Gralise(R) (Depomed)
- 6.3.1. Overview
- 6.3.2. Mechanism of Action
- 6.3.3. Life Cycle Management Strategies
- 6.3.3.1. New Dose Strength
- 6.3.4. Legal Defense
- 6.3.4.1. Authorized Generics
- 6.3.5. Partnerships and Collaborations
- 6.3.5.1. Actavis
- 6.3.5.2. Abbott
- 6.4. Product Profile: Horizant(R) (Arbor Pharmaceuticals)
- 6.4.1. Overview
- 6.4.2. Mechanism of Action
- 6.4.3. Life Cycle Management Strategies
- 6.4.3.1. Extension of Patent Exclusivity
- 6.4.3.2. Indication Expansion
- 6.4.4. New Dose Strength
- 6.4.5. Partnerships and Collaborations
- 6.4.5.1. GlaxoSmithKline
- 6.4.5.2. Arbor Pharmaceutical
- 6.5. Product Profile: Vimovo(R) (AstraZeneca and Pozen)
- 6.5.1. Overview
- 6.5.2. Mechanism of Action
- 6.5.3. Life Cycle Management Strategies
- 6.5.3.1. Pricing
- 6.5.3.2. Geographical Expansion
- 6.5.4. Legal Defense
- 6.5.5. Partnerships and Collaborations
- 6.5.5.1. AstraZeneca
- 6.5.5.2. Horizon Pharma
7. DRUG PROFILES: LATE-STAGE MOLECULES
- 7.1. Chapter Overview
- 7.2. Drug Profile: Aimovig(TM) / Erenumab
- 7.3. Drug Profile: Analgecine
- 7.4. Drug Profile: Atogepant / AGN 241689 / MK 8031
- 7.5. Drug Profile: Civamide / Civanex / Zucapsaicin
- 7.6. Drug Profile: CNTX-4975
- 7.7. Drug Profile: Eptinezumab / ALD403
- 7.8. Drug Profile: Fasinumab
- 7.9. Drug Profile: Fremanezumab
- 7.10. Drug Profile: Galcanezumab / LY2951742
- 7.11. Drug Profile: Lasmiditan / COL-144
- 7.12. Drug Profile: Mirogabalin / DS-5565
- 7.13. Drug Profile: MPC-06-ID
- 7.14. Drug Profile: Neridronate
- 7.15. Drug Profile: NTM-001
- 7.16. Drug Profile: NTM-002
- 7.17. Drug Profile: Perampanel (E2007)
- 7.18. Drug Profile: POSIMIR (SABER-Bupivacaine)
- 7.19. Drug Profile: Ralfinamide
- 7.20. Drug Profile: SP-102
- 7.21. Drug Profile: T-121
- 7.22. Drug Profile: Tanezumab
- 7.23. Drug Profile: Tetrodotoxin / TTX
- 7.24. Drug Profile: Ubrogepant / MK-1602
- 7.25. Drug Profile: YHD1119 / PREGABALIN
8. CHRONIC PAIN MANAGEMENT DEVICES: MARKET LANDSCAPE
- 8.1. Chapter Overview
- 8.2. Devices for Pain Management: Database
- 8.3. Devices for Pain Management: Database Analysis
- 8.3.1. Analysis by Type of Devices
- 8.3.2. Analysis by Mechanism of Action
- 8.3.3. Analysis by Modality of Device
- 8.3.4. Analysis by Site of Application on Body
- 8.3.5. Analysis by Convenience of Use
- 8.3.6. Analysis by Location of Developer(s)
- 8.3.7. Analysis by Company Size
9. DEVICE COMPETITIVENESS ANALYSIS AND PROFILES
- 9.1. Chapter Overview
- 9.2. Methodology
- 9.3. Implants
- 9.3.1. Assumptions, Limitations and Key Evaluable Parameters
- 9.3.2. Device Competitive Analysis for Implants: Results
- 9.3.3. Device Profiles
- 9.3.3.1. Freedom SCS System (Stimwave)
- 9.3.3.2. VIVENDI(TM) (BlueWind Medical)
- 9.4. Wearables
- 9.4.1. Assumptions, Limitations and Parameters Evaluated
- 9.4.2. Device Competitive Analysis for Wearables: Results
- 9.4.3. Device Profiles
- 9.4.3.1. Avail Wireless (Omron Healthcare)
- 9.4.3.2. Cefaly (Cefaly Technologies)
- 9.4.3.3. Electro-Mesh Garments (Prizm Medical)
- 9.4.3.4. Micro-Z (Prizm Medical)
- 9.4.3.5. PainPod MI (PainPod)
- 9.4.3.6. PainPod XPV (PainPod)
- 9.4.3.7. Quell Relief (Neurometrix)
- 9.4.3.8. SENSUS(R) Pain Management System (Neurometrix)
- 9.4.3.9. Smart Relief Back (Chattem)
- 9.5. Other Devices
- 9.5.1. Assumptions, Limitations and Parameters Evaluated
- 9.5.2. Devices Competitive Analysis for Other Devices: Results
- 9.5.3. Device Profiles
- 9.5.3.1. Silk'n Relief (Silk'n Therapy)
- 9.5.3.2. The Wellness Pro(TM) Plus (ElectroMedical Technologies)
10. PARTNERSHIPS AND COLLABORATIONS
- 10.1. Chapter Overview
- 10.2. Partnership Models
- 10.3. Non-Opioid Drugs and Devices for Chronic Pain Management: Recent Partnerships and Collaborations
- 10.3.1. Analysis by Year of Agreement
- 10.3.2. Analysis by Quarterly Trends
- 10.3.3. Analysis by Type of Partnership
- 10.3.4. Analysis by Most Active Players
- 10.3.5. Analysis by Geographical Activity
11. FUNDING AND INVESTMENT ANALYSIS
- 11.1. Chapter Overview
- 11.2. Types of Funding
- 11.3. Non-Opioid Drugs for Chronic Pain Management: Funding and Investment Analysis
- 11.3.1. Analysis by Cumulative Number of Funding Instances
- 11.3.2. Analysis by Cumulative Amount Invested
- 11.3.3. Analysis by Type of Funding
- 11.3.4. Analysis by Most Active Players
- 11.3.5. Analysis by Most Active Investors
- 11.4. Concluding Remarks
12. MARKET FORECAST AND OPPORTUNITY ANALYSIS
- 12.1. Chapter Overview
- 12.2. Key Assumptions
- 12.3. Forecast Methodology
- 12.4. Overall Non-Opioids Drugs for Chronic Pain Management Market, Since 2018
- 12.4.1. Non-Opioid Drugs Market: Distribution by Therapeutic Area
- 12.4.2. Non-Opioid Drugs Market: Distribution by Molecule Type
- 12.4.3. Non-Opioid Drugs Market: Distribution by Mechanism of Action
- 12.4.4. Non-Opioid Drugs Market: Distribution by Geography
- 12.5. Non-Opioid Drugs Market: Product-Wise Sales Forecasts
- 12.5.1. Qutenza(R) (Accorda Therapeutics)
- 12.5.1.1. Drug Overview and Target Patient Population
- 12.5.1.2. Sales Forecast
- 12.5.2. Vimovo(R) (Horizon Pharma)
- 12.5.2.1. Drug Overview and Target Patient Population
- 12.5.2.2. Sales Forecast
- 12.5.3. Duexis(R) (Horizon Pharma)
- 12.5.3.1. Drug Overview and Target Patient Population
- 12.5.3.2. Sales Forecast
- 12.5.4. Gralise(R) (Depomed)
- 12.5.4.1. Drug Overview and Target Patient Population
- 12.5.4.2. Sales Forecast
- 12.5.5. Horizant(R) (Arbor Pharmaceuticals)
- 12.5.5.1. Drug Overview and Target Patient Population
- 12.5.5.2. Sales Forecast
- 12.5.6. Zilretta(R) (Flexion Therapeutics)
- 12.5.6.1. Drug Overview and Target Patient Population
- 12.5.6.2. Sales Forecast
- 12.5.7. Ztlido(TM) (Sorrento Therapeutics)
- 12.5.7.1. Drug Overview and Target Patient Population
- 12.5.7.2. Sales Forecast
- 12.5.8. Aimovig(TM) (Amgen)
- 12.5.8.1. Drug Overview and Target Patient Population
- 12.5.8.2. Sales Forecast
- 12.5.9. Fremanezumab (Teva Pharmaceuticals)
- 12.5.9.1. Drug Overview and Target Patient Population
- 12.5.9.2. Sales Forecast
- 12.5.10. Galcanezumab (Eli Lilly)
- 12.5.10.1. Drug Overview and Target Patient Population
- 12.5.10.2. Sales Forecast
- 12.5.11. Mirogabalin (DS-5565) (Daiichi Sankyo)
- 12.5.11.1. Drug Overview and Target Patient Population
- 12.5.11.2. Sales Forecast
- 12.5.12. YHD1119 (Yuhan corporation)
- 12.5.12.1. Drug Overview and Target Patient Population
- 12.5.12.2. Sales Forecast
- 12.5.13. GLA5PR (GL PharmTech)
- 12.5.13.1. Drug Overview and Target Patient Population
- 12.5.13.2. Sales Forecast
- 12.5.14. Eptinezumab (Alder Biopharmaceuticals)
- 12.5.14.1. Drug Overview and Target Patient Population
- 12.5.14.2. Sales Forecast
- 12.5.15. ALLOD-2 (Allodynic Therapeutics)
- 12.5.15.1. Drug Overview and Target Patient Population
- 12.5.15.2. Sales Forecast
- 12.5.16. PainBrake(R) (GT Biopharma)
- 12.5.16.1. Drug Overview and Target Patient Population
- 12.5.16.2. Sales Forecast
- 12.5.17. Neridronate (Grunenthal)
- 12.5.17.1. Drug Overview and Target Patient Population
- 12.5.17.2. Sales Forecast
- 12.5.18. Fasinumab (Regeneron Pharmaceuticals)
- 12.5.18.1. Drug Overview and Target Patient Population
- 12.5.18.2. Sales Forecast
- 12.5.19. SP-102 (Semnur Pharmaceuticals)
- 12.5.19.1. Drug Overview and Target Patient Population
- 12.5.19.2. Sales Forecast
- 12.5.20. CNTX-4975 (Centrexion Therapeutics)
- 12.5.20.1. Drug Overview and Target Patient Population
- 12.5.20.2. Sales Forecast
- 12.5.21. MPC-06-ID (Mesoblast)
- 12.5.21.1. Drug Overview and Target Patient Population
- 12.5.21.2. Sales Forecast
- 12.5.22. Tanezumab
- 12.5.22.1. Drug Overview and Target Patient Population
- 12.5.22.2. Sales Forecast
- 12.5.1. Qutenza(R) (Accorda Therapeutics)
- 12.6. Overall Pain Management Devices Market, Since 2018
- 12.6.1. Pain Management Devices Market: Distribution by Geography
- 12.6.2. Pain Management Devices Market: Distribution by Type of Device
- 12.6.3. Pain Management Devices Market: Distribution by Mechanism of Action
13. CONCLUSION
- 13.1. The Opioid Crisis is Responsible for a Number of Fatalities Due to the Abuse of Controlled Substances; Drug Developers are Actively Attempting to Develop Alternative Pain Management Solutions
- 13.2. The Non-Opioid Therapeutics Market is Characterized by a Robust Pipeline of Candidate Drugs Being Developed for a Variety of Chronic Clinical Conditions
- 13.3. A Variety of Innovative Devices are also Available for the Management of Various Clinical Conditions Characterized by Chronic Pain
- 13.4. Increasing Partnership Activity and Financial Support from Various Investors are Indicative of Lucrative Future Potential
- 13.5. Given the Existing Unmet Needs, the Market is Anticipated to Grow at a Steady Pace in the Foreseen Future
14. EXECUTIVE INSIGHTS
- 14.1. Chapter Overview
- 14.2. Chief Executive Officer, Company A
- 14.3. Chief Advocacy Officer, Company B
- 14.4. Chief Executive Officer, Company C
- 14.5. Director of Clinical Affairs and New Markets, Company D
15. APPENDIX I
16. APPENDIX II
List of Tables
- Table 3.1 A Comparison of Chronic and Acute Pain
- Table 3.2 Pain Management: WHO Pain Ladder
- Table 3.3 A Comparison of Opioid and Non-Opioid Drugs
- Table 3.4 Interventional Strategies for Pain Management
- Table 5.1 Non-Opioid Drugs for Chronic Pain Management: Marketed and Development Pipeline
- Table 7.1 Non-Opioid Drugs for Chronic Pain Management: Late-Stage Molecules
- Table 7.2 Drug Profile: Aimovig(TM) / Erenumab
- Table 7.3 Drug Profile: Analgecine
- Table 7.4 Drug Profile: Atogepant / AGN 241689 / MK 8031
- Table 7.5 Drug Profile: Civanex / Civamide / Zucapsaicin
- Table 7.6 Drug Profile: CNTX-4975
- Table 7.7 Drug Profile: Eptinezumab / ALD403
- Table 7.8 Drug Profile: Fasinumab
- Table 7.9 Drug Profile: Fremanezumab
- Table 7.10 Drug Profile: Galcanezumab / LY2951742
- Table 7.11 Drug Profile: Lasmiditan / COL-144
- Table 7.12 Drug Profile: Mirogabalin / DS-5565
- Table 7.13 Drug Profile: MPC-06-ID
- Table 7.14 Drug Profile: Neridronate
- Table 7.15 Drug Profile: NTM-001
- Table 7.16 Drug Profile: NTM-002
- Table 7.17 Drug Profile: Perampanel (E2007)
- Table 7.18 Drug Profile: POSIMIR (SABER-Bupivacaine)
- Table 7.19 Drug Profile: Ralfinamide
- Table 7.20 Drug Profile: SP-102
- Table 7.21 Drug Profile: T-121
- Table 7.22 Drug Profile: Tanezumab
- Table 7.23 Drug Profile: Tetrodotoxin / TTX
- Table 7.24 Drug Profile: Ubrogepant / MK-1602
- Table 7.25 Drug Profile: YHD1119 / Pregabalin
- Table 8.1 List of Pain Management Devices
- Table 9.1 Device Profiles: Implants
- Table 9.2 Device Profile: BurstDR Stimulator
- Table 9.3 Device Profile: VIVENDI(TM)
- Table 9.4 Device Profiles: Wearables
- Table 9.5 Device Profile: Avail Wireless
- Table 9.6 Device Profile: Cefaly
- Table 9.7 Device Profile: Electro-Mesh Garments
- Table 9.8 Device Profile: Micro-Z
- Table 9.9 Device Profile: PainPod MI
- Table 9.10 Device Profile: PainPod XPV
- Table 9.11 Device Profile: Quell Relief
- Table 9.12 Device Profile: SENSUS(R) Pain Management System
- Table 9.13 Device Profile: Smart Relief Back
- Table 9.14 Device Profiles: Other Devices
- Table 9.15 Device Profile: Silk'n Therapy
- Table 9.16 Device Profile: The Wellness Pro(TM) Plus
- Table 10.1 Non-Opioid Drugs and Devices for Chronic Pain Management: Recent Partnerships and Collaborations
- Table 11.1 Non-Opioid Drugs and Devices for Chronic Pain Management: Funding and Investments
- Table 11.2 Non-Opioid Drugs and Devices for Chronic Pain Management: Summary of Investments
- Table 12.1 Non-Opioid Drugs for Chronic Pain Management Market: Forecasted Candidates
- Table 15.1 Patient Assessment for Pain Intensity Pre- and Post-Operation
- Table 15.2 Medication used for Chronic Pain Management in US, Since 2018
- Table 15.3 Unmet Needs in Chronic Pain Management: Number of Publications, Year-wise Trend
- Table 15.4 Unmet Needs in Chronic Pain Management: Information Available in Published Literature
- Table 15.5 Social media Analysis: Overview of the Keywords
- Table 15.6 Unmet Needs in Chronic Pain Management: Social Media Sentiment Analysis
- Table 15.7 Unmet Needs in Chronic Pain Management: Most Prolific Authors on Social Media
- Table 15.8 A Summary of Key Unmet Needs in Chronic Pain
- Table 15.9 Pipeline Analysis: Distribution by Phase of Development
- Table 15.10 Pipeline Analysis: Distribution by Type of Molecule
- Table 15.11 Pipeline Analysis: Distribution by Mechanism of Action
- Table 15.12 Pipeline Analysis: Distribution by Route of Administration
- Table 15.13 Pipeline Analysis: Distribution by Target Therapeutic Indication(s)
- Table 15.14 Pipeline Analysis: Distribution by Size of Employee Base of Developer
- Table 15.15 Pipeline Analysis: Distribution by Leading Players
- Table 15.16 Mirror Analysis: Distribution by Type of Indications, Number of Molecules and Manufacturer
- Table 15.17 Heptagon Representation: Distribution by Target Disease Indication and Phase of Development
- Table 15.18 Devices for Pain Management: Distribution by Type
- Table 15.19 Devices for Pain Management: Distribution by Mechanism of Action
- Table 15.20 Devices for Pain Management: Distribution by Administration Modality
- Table 15.21 Devices for Pain Management: Distribution by Site of Application on Body
- Table 15.22 Devices for Pain Management: Distribution by Convenience of Use
- Table 15.23 Devices for Pain Management: Distribution by Location of Developer(s)
- Table 15.24 Devices for Pain Management: Distribution by Company Size
- Table 15.25 Device Competitive Analysis for Implants: Dot-Plot Representation
- Table 15.26 Device Competitive Analysis for Wearables: Dot-Plot Representation
- Table 15.27 Device Competitive Analysis for Other Devices: Dot-Plot Representation
- Table 15.28 Non-Opioid Drugs and Devices for Chronic Pain Management: Distribution by Year of Agreement
- Table 15.29 Non-Opioid Drugs and Devices for Chronic Pain Management: Distribution by Quarterly Trends
- Table 15.30 Non-Opioid Drugs and Devices for Chronic Pain Management: Distribution by Type of Partnership
- Table 15.31 Non-Opioid Drugs for Chronic Pain Management: Cumulative Number of Funding Instances, Till 2035
- Table 15.32 Non-Opioid Drugs for Chronic Pain Management: Cumulative Distribution of Amount Invested by Year, Till 2035 (USD Million)
- Table 15.33 Non-Opioid Drugs for Chronic Pain Management: Distribution by Type of Funding, Since 2018
- Table 15.34 Non-Opioid Drugs for Chronic Pain Management: Distribution of Total Amount Invested by Type of Funding, Since 2018 (USD Million)
- Table 15.35 Non-Opioid Drugs for Chronic Pain Management: Most Active Players by Number of Funding Instances
- Table 15.36 Non-Opioid Drugs for Chronic Pain Management: Most Active Investors by Number of Funding Instances
- Table 15.37 Non-Opioid Drugs for Chronic Pain Management: Funding and Investment Summary (USD Million)
- Table 15.38 Non-Opioid Drugs for Chronic Pain Market: Base Scenario, Till 2035 (USD Billion)
- Table 15.39 Non-Opioid Drugs for Chronic Pain Market: Conservative Scenario, Till 2035 (USD Billion)
- Table 15.40 Non-Opioid Drugs for Chronic Pain Management Market: Optimistic Scenario, Till 2035 (USD Billion)
- Table 15.41 Non-Opioid Drugs for Chronic Pain Management Market: Distribution by Therapeutic Area, Till 2035 (USD Billion)
- Table 15.42 Non-Opioid Drugs for Chronic Pain Management Market: Distribution by Mechanism of Action, Till 2035 (USD Billion)
- Table 15.43 Non-Opioid Drugs for Chronic Pain Management Market: Distribution by Geography, Till 2035 (USD Billion)
- Table 15.44 Qutenza(R) Sales Forecast (Till 2035): Base Scenario (USD Million)
- Table 15.45 Qutenza(R) Sales Forecast (Till 2035): Conservative Scenario (USD Million)
- Table 15.46 Qutenza(R) Sales Forecast (Till 2035): Optimistic Scenario (USD Million)
- Table 15.47 Vimovo(R) Sales Forecast (Till 2035): Base Scenario (USD Million)
- Table 15.48 Vimovo(R) Sales Forecast (Till 2035): Conservative Scenario (USD Million)
- Table 15.49 Vimovo(R) Sales Forecast (Till 2035): Optimistic Scenario (USD Million)
- Table 15.50 Duexis(R) Sales Forecast (Till 2035): Base Scenario (USD Million)
- Table 15.51 Duexis(R) Sales Forecast (Till 2035): Conservative Scenario (USD Million)
- Table 15.52 Duexis(R) Sales Forecast (Till 2035): Optimistic Scenario (USD Million)
- Table 15.53 Gralise(R) Sales Forecast (Till 2035): Base Scenario (USD Million)
- Table 15.54 Gralise(R) Sales Forecast (Till 2035): Conservative Scenario (USD Million)
- Table 15.55 Gralise(R) Sales Forecast (Till 2035): Optimistic Scenario (USD Million)
- Table 15.56 Horizant(R) Sales Forecast (Till 2035): Base Scenario (USD Million)
- Table 15.57 Horizant(R) Sales Forecast (Till 2035): Conservative Scenario (USD Million)
- Table 15.58 Horizant(R) Sales Forecast (Till 2035): Optimistic Scenario (USD Million)
- Table 15.59 Zilretta(R) Sales Forecast (Till 2035): Base Scenario (USD Million)
- Table 15.60 Zilretta(R) Sales Forecast (Till 2035): Conservative Scenario (USD Million)
- Table 15.61 Zilretta(R) Sales Forecast (Till 2035): Optimistic Scenario (USD Million)
- Table 15.62 Ztlido(TM) Sales Forecast (Till 2035): Base Scenario (USD Million)
- Table 15.63 Ztlido(TM) Sales Forecast (Till 2035): Conservative Scenario (USD Million)
- Table 15.64 Ztlido(TM) Sales Forecast (Till 2035): Optimistic Scenario (USD Million)
- Table 15.65 Aimovig(TM) Sales Forecast (Till 2035): Base Scenario (USD Million)
- Table 15.66 Aimovig(TM) Sales Forecast (Till 2035): Conservative Scenario (USD Million)
- Table 15.67 Aimovig(TM) Sales Forecast (Till 2035): Optimistic Scenario (USD Million)
- Table 15.68 Fremanezumab Sales Forecast (Till 2035): Base Scenario (USD Million)
- Table 15.69 Fremanezumab Sales Forecast (Till 2035): Conservative Scenario (USD Million)
- Table 15.70 Fremanezumab Sales Forecast (Till 2035): Optimistic Scenario (USD Million)
- Table 15.71 Galcanezumab Sales Forecast (Till 2035): Base Scenario (USD Million)
- Table 15.72 Galcanezumab Sales Forecast (Till 2035): Conservative Scenario (USD Million)
- Table 15.73 Galcanezumab Sales Forecast (Till 2035): Optimistic Scenario (USD Million)
- Table 15.74 Mirogabalin (DS-5565) Sales Forecast (Till 2035): Base Scenario (USD Million)
- Table 15.75 Mirogabalin (DS-5565) Sales Forecast (Till 2035): Conservative Scenario (USD Million)
- Table 15.76 Mirogabalin (DS-5565) Sales Forecast (Till 2035): Optimistic Scenario (USD Million)
- Table 15.77 YHD1119 Sales Forecast (Till 2035): Base Scenario (USD Million)
- Table 15.78 YHD1119 Sales Forecast (Till 2035): Conservative Scenario (USD Million)
- Table 15.70 YHD1119 Sales Forecast (Till 2035): Optimistic Scenario (USD Million)
- Table 15.80 GLA5PR Sales Forecast (Till 2035): Base Scenario (USD Million)
- Table 15.81 GLA5PR Sales Forecast (Till 2035): Conservative Scenario (USD Million)
- Table 15.82 GLA5PR Sales Forecast (Till 2035): Optimistic Scenario (USD Million)
- Table 15.83 Eptinezumab Sales Forecast (Till 2035): Base Scenario (USD Million)
- Table 15.84 Eptinezumab Sales Forecast (Till 2035): Conservative Scenario (USD Million)
- Table 15.85 Eptinezumab Sales Forecast (Till 2035): Optimistic Scenario (USD Million)
- Table 15.86 ALLOD-2 Sales Forecast (Till 2035): Base Scenario (USD Million)
- Table 15.87 ALLOD-2 Sales Forecast (Till 2035): Conservative Scenario (USD Million)
- Table 15.88 ALLOD-2 Sales Forecast (Till 2035): Optimistic Scenario (USD Million)
- Table 15.89 PainBrake(R) Sales Forecast (Till 2035): Base Scenario (USD Million)
- Table 15.90 PainBrake(R) Sales Forecast (Till 2035): Conservative Scenario (USD Million)
- Table 15.91 PainBrake(R) Sales Forecast (Till 2035): Optimistic Scenario (USD Million)
- Table 15.92 Neridronate Sales Forecast (Till 2035): Base Scenario (USD Million)
- Table 15.93 Neridronate Sales Forecast (Till 2035): Conservative Scenario (USD Million)
- Table 15.94 Neridronate Sales Forecast (Till 2035): Optimistic Scenario (USD Million)
- Table 15.95 Fasinumab Sales Forecast (Till 2035): Base Scenario (USD Million)
- Table 15.96 Fasinumab Sales Forecast (Till 2035): Conservative Scenario (USD Million)
- Table 15.97 Fasinumab Sales Forecast (Till 2035): Optimistic Scenario (USD Million)
- Table 15.98 SP-102 Sales Forecast (Till 2035): Base Scenario (USD Million)
- Table 15.99 SP-102 Sales Forecast (Till 2035): Conservative Scenario (USD Million)
- Table 15.100 SP-102 Sales Forecast (Till 2035): Optimistic Scenario (USD Million)
- Table 15.101 CNTX-4975 Sales Forecast (Till 2035): Base Scenario (USD Million)
- Table 15.102 CNTX-4975 Sales Forecast (Till 2035): Conservative Scenario (USD Million)
- Table 15.103 CNTX-4975 Sales Forecast (Till 2035): Optimistic Scenario (USD Million)
- Table 15.104 MPC-06-ID Sales Forecast (Till 2035): Base Scenario (USD Million)
- Table 15.105 MPC-06-ID Sales Forecast (Till 2035): Conservative Scenario (USD Million)
- Table 15.106 MPC-06-ID Sales Forecast (Till 2035): Optimistic Scenario (USD Million)
- Table 15.107 Tanezumab Sales Forecast (Till 2035): Base Scenario (USD Million)
- Table 15.108 Tanezumab Sales Forecast (Till 2035): Conservative Scenario (USD Million)
- Table 15.109 Tanezumab Sales Forecast (Till 2035): Optimistic Scenario (USD Million)
- Table 15.110 Chronic Pain Management Devices Market: Base Scenario, Till 2035 (USD Billion)
- Table 15.111 Chronic Pain Management Devices Market: Conservative Scenario, Till 2035 (USD Billion)
- Table 15.112 Chronic Pain Management Device Market: Optimistic Scenario, Till 2035 (USD Billion)
- Table 15.113 Chronic Pain Management Device Market: Distribution by Geography, Till 2035 (USD Billion)
- Table 15.114 Chronic Pain Management Device Market: Distribution by Type of Device, Till 2035 (USD Billion)
- Table 15.115 Chronic Pain Management Device Market: Distribution by Mechanism of Action, Till 2035 (USD Billion)
- Table 15.116 Non-Opioid Drugs for Chronic Pain Management Market: Summary of Base, Conservative and Optimistic Scenarios (USD Million)
List of Figures
- Figure 3.1 Classification of Pain: Acute and Chronic Pain
- Figure 3.2 Acute and Chronic Pain: Key Biological Pathways
- Figure 3.3 Patient Assessment for Pain Intensity Pre- and Post-Operation
- Figure 3.4 Chronic Pain: Primary Symptoms and Causes
- Figure 3.5 Types of Chronic Pain: ICD Classification
- Figure 3.6 Medications used for Chronic Pain Management in US, Since 2018
- Figure 3.7 Pain Management Therapeutics: Mode of Action
- Figure 3.8 Primary Routes of Administration for Opioid Intake
- Figure 3.9 Types of Pain Management Devices
- Figure 4.1 Unmet Need Analysis: Overview of the Methodology
- Figure 4.2 Unmet Needs in Chronic Pain Management: Word Cloud Analysis of Patient Blogs
- Figure 4.3 Unmet Needs in Chronic Pain Management: Number of Publications, Year-wise Trend
- Figure 4.4 Unmet Needs in Chronic Pain Management: Unmet Needs Highlighted in Published Literature
- Figure 4.5 Social Media Analysis: Overview of the Keywords
- Figure 4.6 Unmet Needs in Chronic Pain Management: Social Media Sentiment Analysis
- Figure 4.7 Unmet Needs in Chronic Pain Management: Social Media Word Cloud on Total Tweets
- Figure 4.8 Unmet Needs in Chronic Pain Management: Trends on Social Media
- Figure 4.9 Unmet Needs in Chronic Pain Management: Most Prolific Authors on Social Media
- Figure 4.10 Unmet Needs in Chronic Pain Management: Social Media Word Clouds on Most Popular Keywords
- Figure 4.11 Summary of Key Unmet Needs in Chronic Pain
- Figure 5.1 Pipeline Analysis: Distribution by Phase of Development
- Figure 5.2 Pipeline Analysis: Distribution by Type of Molecule
- Figure 5.3 Pipeline Analysis: Distribution by Mechanism of Action
- Figure 5.4 Pipeline Analysis: Distribution by Route of Administration
- Figure 5.5 Pipeline Analysis: Distribution by Target Therapeutic Indications(s)
- Figure 5.6 Pipeline Analysis: Distribution by Size of Employee Base of Developer
- Figure 5.7 Pipeline Analysis: Distribution by Leading Players
- Figure 5.8 Developer Logo Landscape: Distribution by Size and Location
- Figure 5.9 Mirror Analysis: Distribution by Target Therapeutics Indication(s), Number of Molecules and Number of Developers
- Figure 5.10 Heptagon Representation: Distribution by Target Disease Indications Indication(s) and Development Stage
- Figure 5.11 Funnel Analysis: Distribution by Target Disease Indication, Route of Administration and Phase of Development
- Figure 6.1 Types of Life Cycle Management Strategies
- Figure 6.2 Duexis(R): Mechanism of Action
- Figure 6.3 Duexis(R): Life Cycle Management Strategies
- Figure 6.4 Gralise(R): Mechanism of Action
- Figure 6.5 Gralise(R): Life Cycle Management Strategies
- Figure 6.6 Horizant(R): Mechanism of Action
- Figure 6.7 Horizant(R): Life Cycle Management Strategies
- Figure 6.8 Vimovo(R): Mechanism of Action
- Figure 6.9 Vimovo(R): Life Cycle Management Strategies
- Figure 8.1 Devices for Pain Management: Distribution by Type
- Figure 8.2 Devices for Pain Management: Distribution by Mechanism of Action
- Figure 8.3 Devices for Pain Management: Distribution by Administration Modality
- Figure 8.4 Devices for Pain Management: Distribution by Site of Application on Body
- Figure 8.5 Devices for Pain Management: Distribution by Convenience of Use
- Figure 8.6 Devices for Pain Management: Distribution by Location of Developer(s)
- Figure 8.7 Devices for Pain Management: Distribution by Company Size
- Figure 9.1 Pain Management Device Competitiveness Analysis: Methodology
- Figure 9.2 Device Competitiveness Analysis for Implants: Dot-Plot Representation
- Figure 9.3 Device Competitiveness Analysis for Wearables: Dot-Plot Representation
- Figure 9.4 Device Competitiveness Analysis for Other Devices: Dot-Plot Representation
- Figure 10.1 Recent Collaborations: Distribution by Year of Agreement
- Figure 10.2 Recent Collaborations: Distribution by Quarterly Trends
- Figure 10.3 Recent Collaborations: Distribution by Type of Partnership
- Figure 10.4 Recent Collaborations: Distribution by Most Active Players
- Figure 10.5 Recent Collaborations: Distribution by Geographical Activity
- Figure 11.1 Non-Opioid Drugs for Chronic Pain Management: Cumulative Number of Funding Instances, Till 2035
- Figure 11.2 Non-Opioid Drugs for Chronic Pain Management: Cumulative Distribution of Amount Invested by Year, Till 2035 (USD Million)
- Figure 11.3 Non-Opioid Drugs for Chronic Pain Management: Distribution by Type of Funding, Till 2035
- Figure 11.4 Non-Opioid for Chronic Pain Management: Distribution of Total Amount Invested by Type of Funding, Till 2035 (USD Million)
- Figure 11.5 Non-Opioid Drugs for Chronic Pain Management: Most Active Players by Number of Funding Instances
- Figure 11.6 Non-Opioid Drugs for Chronic Pain Management: Most Active Investors by Number of Funding Instances
- Figure 11.7 Non-Opioid Drugs for Chronic Pain Management: Funding and Investment Summary
- Figure 12.1 Non-Opioid Drugs for Chronic Pain Management Market: Base Scenario, Till 2035 (USD Billion)
- Figure 12.2 Non-Opioid Drugs for Chronic Pain Management Market: Distribution by Therapeutic Area, Till 2035 (USD Billion)
- Figure 12.3 Non-Opioid Drugs for Chronic Pain Management Market: Distribution by Molecule Type, Till 2035 (USD Billion)
- Figure 12.4 Non-Opioid Drugs for Chronic Pain Management Market: Distribution by Geography, Till 2035 (USD Billion)
- Figure 12.5 Qutenza(R) Sales Forecast, Till 2035: Base Scenario (USD Million)
- Figure 12.6 Vimovo(R) Sales Forecast, Till 2035: Base Scenario (USD Million)
- Figure 12.7 Duexis(R) Sales Forecast, Till 2035: Base Scenario (USD Million)
- Figure 12.8 Gralise(R) Sales Forecast, Till 2035: Base Scenario (USD Million)
- Figure 12.9 Horizant(R) Sales Forecast, Till 2035: Base Scenario (USD Million)
- Figure 12.10 Zilretta(R) Sales Forecast, Till 2035: Base Scenario (USD Million)
- Figure 12.11 Ztlido(TM) Sales Forecast, Till 2035: Base Scenario (USD Million)
- Figure 12.12 Aimovig(TM) Sales Forecast, Till 2035: Base Scenario (USD Million)
- Figure 12.13 Fremanezumab Sales Forecast, Till 2035: Base Scenario (USD Million)
- Figure 12.14 Galcanezumab Sales Forecast, Till 2035: Base Scenario (USD Million)
- Figure 12.15 Mirogabalin Sales Forecast, Till 2035: Base Scenario (USD Million)
- Figure 12.16 YHD1119 Sales Forecast, Till 2035: Base Scenario (USD Million)
- Figure 12.17 GLA5PR Sales Forecast, Till 2035: Base Scenario (USD Million)
- Figure 12.18 Eptinezumab Sales Forecast, Till 2035: Base Scenario (USD Million)
- Figure 12.19 ALLOD-2 Sales Forecast, Till 2035: Base Scenario (USD Million)
- Figure 12.20 PainBrake(R) Sales Forecast, Till 2035: Base Scenario (USD Million)
- Figure 12.21 Neridronate Sales Forecast, Till 2035: Base Scenario (USD Million)
- Figure 12.22 Fasinumab Sales Forecast, Till 2035: Base Scenario (USD Million)
- Figure 12.23 SP-102 Sales Forecast, Till 2035: Base Scenario (USD Million)
- Figure 12.24 CNTX-4975 Sales Forecast, Till 2035: Base Scenario (USD Million)
- Figure 12.25 MPC-06-ID Sales Forecast, Till 2035: Base Scenario (USD Million)
- Figure 12.26 Tanezumab Sales Forecast, Till 2035: Base Scenario (USD Million)
- Figure 12.27 Chronic Pain Management Devices Market: Base Scenario, Till 2035 (USD Billion)
- Figure 12.28 Chronic Pain Management Devices Market: Distribution by Geography, Till 2035 (USD Billion)
- Figure 12.29 Chronic Pain Management Devices Market: Distribution by Type of Device, Till 2035 (USD Billion)
- Figure 12.30 Chronic Pain Management Devices Market: Distribution by Mechanism of Action, Till 2035 (USD Billion)
- Figure 13.1 Non-Opioid Drugs for Chronic Pain Management Market: Summary of Base, Conservative and Optimistic Scenarios, Till 2035

