
PUBLISHER: Roots Analysis | PRODUCT CODE: 1771303

PUBLISHER: Roots Analysis | PRODUCT CODE: 1771303
Cell Reprogramming Market: Industry Trends and Global Forecasts - Distribution by Type of Technology, Type of Source Cell, Type of Application and Key Geographical Regions
GLOBAL CELL REPROGRAMMING MARKET: OVERVIEW
As per Roots Analysis, the global cell reprogramming market valued at USD 1.16 billion in the current year is anticipated to grow at a CAGR of 8% during the forecast period.
The market sizing and opportunity analysis has been segmented across the following parameters:
Type of Technology
- Sendai Virus-based Reprogramming
- mRNA Reprogramming
- Episomal Reprogramming
- Other Reprogramming Technologies
Type of Source Cell
- Fibroblasts
- Peripheral Blood Mononuclear Cells
- Unspecified Somatic Cells
- Other Cells
Type of Application
- Research
- Therapeutic
Key Geographical Regions
- North America
- Europe
- Asia-Pacific and Rest of the World
GLOBAL CELL REPROGRAMMING MARKET: GROWTH AND TRENDS
Progress in stem cell biology and regenerative medicine over the years has led to the discovery and development of various stem cell-based therapies. However, prevalent challenges concerning the development and use of cell therapies persist, including complex production process, scarcity of healthy cell donors, and concerns associated with donor-recipient haplotype mismatch. Moreover, there are still several ethical barriers when it comes to using human stem cells for research purposes. Consequently, the concept of cell reprogramming has emerged as one of the means to overcome the aforementioned issues and develop safe and effective cell-based therapeutic interventions.
Empowered by technical developments in the field of biotechnology and the market opportunity associated with regenerative medicine, a number of research groups across the world are presently developing innovative ways to reprogram cells. Further, it is worth noting that various start-ups and university spin-offs have emerged as pioneers in this emerging field of therapeutics and are anticipated to maintain the research momentum in the coming years as well.
GLOBAL CELL REPROGRAMMING MARKET: KEY INSIGHTS
The report delves into the current state of global cell reprogramming market and identifies potential growth opportunities within industry. Some key findings from the report include:
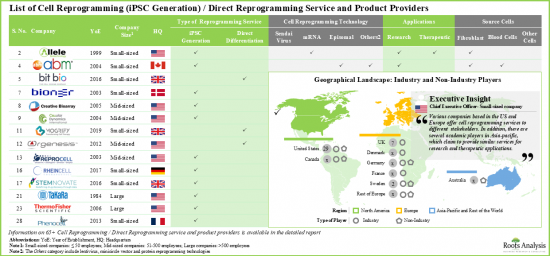
- Advances in cell reprogramming have paved way for a plethora of advanced therapeutic and research applications, resulting in lucrative business opportunities for industry and non-industry service provider firms.
- More than 30 companies claim to offer cell reprogramming services and products. Of these, close to 70% are small firms (having less than 50 employees).
- Presently, the majority (~75%) of the service providers claim to offer iPSC generation services, using episomal reprogramming technologies, and are capable of working with various types of cells. This is followed by the companies offering direct reprogramming services (30%).
- It is worth mentioning that majority of stakeholders claim to be using episomal reprogramming for generating iPSCs; other popular cell reprograming approaches include Sendai virus and mRNA-based technologies.
- Numerous companies claim to use more than two technologies for the generation of iPSCs; examples include Applied StemCell, Applied Biological Materials, Creative Bioarray, Lonza and Stemnovate.
- Given the various advantages associated with fibroblasts, such as easy availability, faster proliferation rate and cell robustness, these cells have found maximum (>40%) usage in cell reprogramming.
- Featuring the presence of several small and mid-sized firms, the cell reprogramming landscape is well distributed across various regions; players have established multiple facilities to cater to the needs of their clients.
- North America is a key services hub for cell reprogramming. More than 55% of companies engaged in cell reprogramming are headquartered in North America. This is followed by players based in Europe (45%).
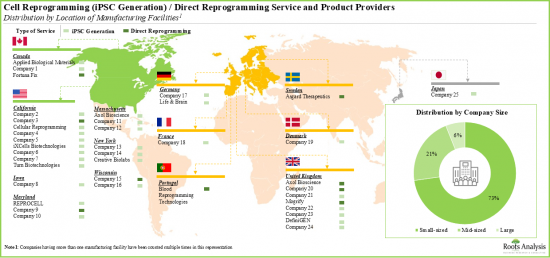
- Prominent facilities within Europe include the UK, Germany, Denmark, Switzerland, France, Portugal and Sweden. Stakeholders are actively expanding their capabilities in order to enhance their respective cell reprogramming service portfolios and, thereby, maintain a competitive edge in this upcoming industry.
- The rising interest in this field is reflected in the number of partnerships, involving a varied range of cell types, inked in the recent past; the maximum partnering activity has been observed in the US.
- Since 2016, the partnership activity has increased at a CAGR of 7%; with the increasing demand for stem cells, both industry and academic players are likely to enter into multiple alliances for cell reprogramming.
- Both established players and new entrants have forged several strategic partnerships in the recent past; majority (>30%) of the deals have primarily been inked for generations of iPSCs, which are further differentiated based on the client's requirement.
- A number of companies have signed multiple deals for cell reprogramming; examples of the firms that have signed over four deals include Cellaria, BlueRock Therapeutics, FUJIFILM Cellular Dynamics and STEMCELL Technologies.
- In the last few years, over 540 clinical trials, evaluating various types of stem cell therapies have been initiated; this highlights the rising demand for iPSC generation and direct reprogramming strategies.
- >70% of these trials were / are being sponsored by small / mid-sized companies to exploit the potential of stem cell therapies to cater to the unmet need in this domain.
- An evaluation of more than 300+ stakeholders engaged in the development of stem cell therapies reveals several likely strategic partners for cell reprogramming service providers, across different geographical regions.
- The market is anticipated to grow at a CAGR of 8% till 2030, and the opportunity is likely to be distributed across different types of technologies, applications and key geographical regions.
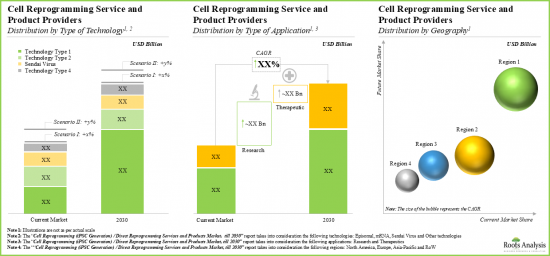
- Presently, the majority share of service revenues is generated from projects involving episomal reprogramming technologies.
- In 2030, episomal reprogramming focused projects are anticipated to contribute over 40% of the overall share; it is expected to be followed by revenues generated from projects involving Sendai virus-based reprogramming (30%) and mRNA (25%).
Example Players in the Cell Reprogramming Market
- Allele Biotechnology
- ALSTEM
- Applied Biological Materials
- Axol Bioscience
- Creative Bioarray
- DefiniGEN
- FUJIFILM Cellular Dynamics
- Lonza
- Mogrify
- REPROCELL
- Stemnovate
- Thermo Fisher Scientific
GLOBAL CELL REPROGRAMMING MARKET: RESEARCH COVERAGE
- Market Sizing and Opportunity Analysis: The report features an in-depth analysis of the global cell reprogramming market, focusing on key market segments, including [A] type of technology, [B] type of source cell, [C] type of application and [D] key geographical regions.
- Market Landscape: A comprehensive evaluation of cell reprogramming market, considering various parameters, such as [A] year of establishment, [B] company size, [C] geographical location, [D] location of manufacturing facilities, [E] type of service, [F] type of offering, [G] type of technology, [H] type of vector used, [I] source cell for iPSC generation, [J] target indication(s), [K] type of application and [L] additional service(s) offered.
- Company Competitiveness Analysis: A comprehensive company competitive analysis of iPSC generation and direct reprogramming service providers, examining factors, such as [A] supplier strength and [B] service strength.
- Company Profiles: In-depth profiles of the players that offer cell reprogramming services and products, focusing on [A] company overview, [B] financial information (if available), [C] details on cell reprogramming approaches, [D] types of cell(s) utilized and differentiated, [E] target indication(s), [F] other drug discovery services offered and [G] recent developments and an informed future outlook.
- Clinical Trial Analysis: An insightful analysis more than 540 completed, ongoing and planned clinical studies of various stem cell therapies, based on several parameters, such as [A] trial registration year, [B] phase of development, [C] study design, [D] current trial status, [E] leading industry sponsors, [F] study focus, [G] type of stem cells, [H] target indication(s), [I] target therapeutic area(s), [J] enrolled patient population and [K] regional distribution of trials.
- Partnerships and Collaborations: An insightful analysis of the deals inked by stakeholders in the cell reprogramming market, based on several parameters, such as [A] year of partnership, [B] type of partnership, [C] type of stem cell, [D] target therapeutic area, [E] application, [F] most active players (in terms of the number of partnerships signed) and [G] geography.
- Likely Partnership Opportunities: A detailed discussion on the stem cell therapy developers / manufacturers that are anticipated to partner with cell reprogramming service and product providers in the foreseen future, based on various relevant parameters, such as [A] company size, [B] type of cell (s), [C] indication counts and [D] existing partnership(s).
KEY QUESTIONS ANSWERED IN THIS REPORT
- How many companies are currently engaged in this market?
- Which are the leading companies in this market?
- What factors are likely to influence the evolution of this market?
- What is the current and future market size?
- What is the CAGR of this market?
- How is the current and future market opportunity likely to be distributed across key market segments?
REASONS TO BUY THIS REPORT
- The report provides a comprehensive market analysis, offering detailed revenue projections of the overall market and its specific sub-segments. This information is valuable to both established market leaders and emerging entrants.
- Stakeholders can leverage the report to gain a deeper understanding of the competitive dynamics within the market. By analyzing the competitive landscape, businesses can make informed decisions to optimize their market positioning and develop effective go-to-market strategies.
- The report offers stakeholders a comprehensive overview of the market, including key drivers, barriers, opportunities, and challenges. This information empowers stakeholders to stay abreast of market trends and make data-driven decisions to capitalize on growth prospects.
ADDITIONAL BENEFITS
- Complimentary PPT Insights Packs
- Complimentary Excel Data Packs for all Analytical Modules in the Report
- 15% Free Content Customization
- Detailed Report Walkthrough Session with Research Team
- Free Updated report if the report is 6-12 months old or older
TABLE OF CONTENTS
1. PREFACE
- 1.1. Scope of the Report
- 1.2. Research Methodology
- 1.2.1. Research Assumptions
- 1.2.2. Project Methodology
- 1.2.3. Forecast Methodology
- 1.2.4. Robust Quality Control
- 1.2.5. Key Considerations
- 1.2.5.1. Demographics
- 1.2.5.2. Economic Factors
- 1.2.5.3. Government Regulations
- 1.2.5.4. Supply Chain
- 1.2.5.5. COVID Impact / Related Factors
- 1.2.5.6. Market Access
- 1.2.5.7. Healthcare Policies
- 1.2.5.8. Industry Consolidation
- 1.3 Key Questions Answered
- 1.4. Chapter Outlines
2. EXECUTIVE SUMMARY
3. INTRODUCTION
- 3.1. Chapter Overview
- 3.2. Overview of Stem Cells
- 3.2.1. Classification of Stem Cells
- 3.2.1.1. Based on Source of Stem Cell
- 3.2.1.2. Based on Origin of Stem Cell
- 3.2.1.3. Based on Potency of Stem Cell
- 3.2.2. Routes of Administration of Stem Cell Therapies
- 3.2.3. Applications of Stem Cell Therapies
- 3.2.1. Classification of Stem Cells
- 3.3. Introduction to Cell Reprogramming
- 3.3.1. Cell Reprogramming Approaches and Affiliated Technologies
- 3.4. Applications of Cell Reprogramming
- 3.5. Key Growth Drivers and Constraints
4. CURRENT MARKET LANDSCAPE
- 4.1. Chapter Overview
- 4.2. Cell Reprogramming Service and Product Providers: List of Industry Players
- 4.2.1. Analysis by Year of Establishment
- 4.2.2. Analysis by Company Size
- 4.2.3. Analysis by Geographical Location
- 4.2.4. Analysis by Location of Stem Cell Research Facilities
- 4.2.5. Analysis by Type of Service
- 4.2.6. Analysis by Type of Technology
- 4.2.7. Analysis by Target Indication
- 4.2.8. Analysis by Source Cell
- 4.2.9. Analysis by Application Area
- 4.2.10. Analysis by Additional Service(s) Offered
- 4.2.11. Analysis by Type of Offering
- 4.3. Cell Reprogramming Service and Product Providers: List of Non-Industry Players
- 4.3.1. Analysis by Geographical Location
- 4.3.2. Analysis by Type of Technology Used
- 4.3.3. Analysis by Source Cell for iPSC Generation
- 4.3.4. Analysis by Type of Offering
- 4.4. Cell Reprogramming: List of Affiliated Products Providers
5. COMPANY COMPETITIVENESS ANALYSIS
- 5.1. Chapter Overview
- 5.2. Assumptions and Key Parameters
- 5.3. Methodology
- 5.4. Competitiveness Analysis: iPSC Generation Service and Product Providers
- 5.5. Competitiveness Analysis: Direct Reprogramming Service and Product Providers
6. COMPANY PROFILES
- 6.1. Chapter Overview
- 6.2. Allele Biotechnology
- 6.2.1. Company Overview
- 6.2.2. Recent Developments and Future Outlook
- 6.3. ALSTEM
- 6.3.1. Company Overview
- 6.3.2. Recent Developments and Future Outlook
- 6.4. Applied Biological Materials
- 6.4.1. Company Overview
- 6.4.2. Recent Developments and Future Outlook
- 6.5. Axol Bioscience
- 6.5.1. Company Overview
- 6.5.2. Recent Developments and Future Outlook
- 6.6. Creative Bioarray
- 6.6.1. Company Overview
- 6.6.1.1. Recent Developments and Future Outlook
- 6.6.1. Company Overview
- 6.7. DefiniGEN
- 6.7.1. Company Overview
- 6.7.2. Recent Developments and Future Outlook
- 6.8. FUJIFILM Cellular Dynamics International
- 6.8.1. Company Overview
- 6.8.2. Recent Developments and Future Outlook
- 6.9. Lonza
- 6.9.1. Company Overview
- 6.9.2. Recent Developments and Future Outlook
- 6.10. Mogrify
- 6.10.1. Company Overview
- 6.10.2. Recent Developments and Future Outlook
- 6.11. REPROCELL
- 6.11.1. Company Overview
- 6.11.1.1. Recent Developments and Future Outlook
- 6.11.1. Company Overview
- 6.12. Stemnovate
- 6.12.1. Company Overview
- 6.12.2. Recent Developments and Future Outlook
- 6.14. Thermo fisher Scientific
- 6.14.1. Company Overview
- 6.14.1.1. Recent Developments and Future Outlook
- 6.14.1. Company Overview
7. CASE STUDY: CLINICAL TRIAL ACTIVITY IN STEM CELL THERAPY DEVELOPMENT
- 7.1. Chapter Overview
- 7.2. Scope and Methodology
- 7.3. Stem Cell Therapies: Clinical Trial Analysis
- 7.3.1. Analysis by Trial Registration Year
- 7.3.2. Analysis by Trial Phase
- 7.3.3. Analysis by Number of Patients Enrolled by Trial Registration Year
- 7.3.4. Analysis by Study Design
- 7.3.5. Analysis by Trial Recruitment Status
- 7.3.6. Analysis by Sponsor / Collaborator
- 7.3.7. Leading Industry Sponsors: Analysis by Number of Registered Trials
- 7.3.8. Analysis by Trial Focus
- 7.3.9. Analysis by Type of Stem Cell
- 7.3.10. Analysis by Therapeutic Area
- 7.3.11. Analysis by Type of Stem Cell and Therapeutic Area
- 7.3.12. Geographical Analysis by Number of Clinical Trials
- 7.3.13. Geographical Analysis by Trial Recruitment Status
- 7.3.14. Geographical Analysis by Enrolled Patient Population
8. PARTNERSHIPS AND COLLABORATIONS
- 8.1. Chapter Overview
- 8.2. Scope and Methodology
- 8.3. Cell Reprogramming Services and Products Market: List of Partnerships and Collaborations
- 8.3.1. Analysis by Year of Partnership
- 8.3.2. Analysis by Type of Partnership
- 8.3.3. Analysis by Year of Partnership and Type of Partner
- 8.3.4. Analysis by Type of Partnership and Type of Partner
- 8.3.5. Analysis by Type of Stem Cell
- 8.3.6. Analysis by Target Therapeutic Area
- 8.3.7. Analysis by Application
- 8.3.8. Most Active Players: Analysis by Number of Partnerships
- 8.3.9. Regional Analysis
- 8.3.10. Intercontinental and Intracontinental Agreements
9. LIKELY PARTNERSHIP OPPORTUNITIES
- 9.1. Chapter Overview
- 9.2. Scope and Methodology
- 9.3. Scoring Criteria and Key Assumptions
- 9.4. Stem Cell Therapy Developers: Likely Partners for Cell Reprogramming Service and Product Providers
- 9.4.1. Likely Partners for Cell Reprogramming Service and Product Providers in North America
- 9.4.2. Likely Partners for Cell Reprogramming Service and Product Providers in Europe
- 9.4.3. Likely Partners for Cell Reprogramming Service and Product Providers in Asia-Pacific and Rest of the World
- 9.5. Stem Cell Therapy Contract Manufacturers: Likely Partners for Cell Reprogramming Service and Product Providers
- 9.5.1. Likely Partners for Cell Reprogramming Service and Product Providers in North America
- 9.5.2. Likely Partners for Cell Reprogramming Service and Product Providers in Europe
- 9.5.3. Likely Partners for Cell Reprogramming Service and Product Providers in Asia-Pacific and Rest of the World
10. MARKET FORECAST
- 10.1. Chapter Overview
- 10.2. Scope and Methodology
- 10.3. Forecast Methodology and Key Assumptions
- 10.4. Global Cell Reprogramming Services and Products Market, Till 2035
- 10.4.1. Global Cell Reprogramming Services and Products Market: Distribution by Type of Technology, Till 2035
- 10.4.1.1. Cell Reprogramming Services and Products Market for Episomal Reprogramming, Till 2035
- 10.4.1.2. Cell Reprogramming Services and Products Market for mRNA Reprogramming, Till 2035
- 10.4.1.3. Cell Reprogramming Services and Products Market for Sendai Virus-based Reprogramming, Till 2035
- 10.4.1.4. Cell Reprogramming Services and Products Market for Other Reprogramming Technologies, Till 2035
- 10.4.2. Global Cell Reprogramming Services and Products Market: Distribution by Type of Source Cell, Till 2035
- 10.4.2.1. Cell Reprogramming Services and Products Market for Fibroblasts, Till 2035
- 10.4.2.2. Cell Reprogramming Services and Products Market for Peripheral Blood Mononuclear Cells, Till 2035
- 10.4.2.3. Cell Reprogramming Services and Products Market for Unspecified Somatic Cells, Till 2035
- 10.4.2.4. Cell Reprogramming Services and Products Market for Other Cells, Till 2035
- 10.4.3. Global Cell Reprogramming Services and Products Market: Distribution by Type of Application, Till 2035
- 10.4.3.1. Cell Reprogramming Services and Products Market for Research, Till 2035
- 10.4.3.2. Cell Reprogramming Services and Products Market for Therapeutic, Till 2035
- 10.4.4. Global Cell Reprogramming Services and Products Market: Distribution by Key Geographical Regions, Till 2035
- 10.4.4.1. Cell Reprogramming Services and Products Market in North America, Till 2035
- 10.4.4.2. Cell Reprogramming Services and Products Market in Europe, Till 2035
- 10.4.4.3. Cell Reprogramming Services and Products Market in Asia-Pacific and Rest of the World, Till 2035
- 10.4.1. Global Cell Reprogramming Services and Products Market: Distribution by Type of Technology, Till 2035
11. EXECUTIVE INSIGHTS
- 11.1. Chapter Overview
- 11.2. Company A
- 11.2.1. Company Snapshot
- 11.2.2. Interview Transcript: Co-Founder and Chief Executive Officer
- 11.3. Company B
- 11.3.1. Company Snapshot
- 11.3.2. Interview Transcript: Chief Scientific Officer
12. CONCLUDING REMARKS
13. APPENDIX 1: TABULATED DATA
14. APPENDIX 2: LIST OF COMPANIES AND ORGANIZATIONS
List of Tables
- Table 3.1 Differences between Stem Cell Therapies and Other Biologics
- Table 4.1 Cell Reprogramming Services and Products: List of Industry Players
- Table 4.2 Cell Reprogramming Services and Products: List of Non-Industry Players
- Table 4.3 Cell Reprogramming Services and Products: List of Affiliated Product Providers
- Table 6.1 Cell Reprogramming Service and Product Providers: List of Profiled Companies
- Table 6.2 ALSTEM: Company Snapshot
- Table 6.3 ALSTEM: Recent Developments and Future Outlook
- Table 6.4 Applied Biological Materials: Company Snapshot
- Table 6.5 Applied Biological Materials: Recent Developments and Future Outlook
- Table 6.6 Axol Bioscience: Company Snapshot
- Table 6.7 Axol Bioscience: Recent Developments and Future Outlook
- Table 6.8 Creative Bioarray: Company Snapshot
- Table 6.9 Creative Bioarray: Recent Developments and Future Outlook
- Table 6.10 DefiniGEN: Company Snapshot
- Table 6.11 DefiniGEN: Recent Developments and Future Outlook
- Table 6.12 FUJIFILM Cellular Dynamics International: Company Snapshot
- Table 6.13 FUJIFILM Cellular Dynamics International: Recent Developments and Future Outlook
- Table 6.14 Lonza: Company Snapshot
- Table 6.15 Lonza: Recent Developments and Future Outlook
- Table 6.16 Mogrify: Company Snapshot
- Table 6.17 Mogrify: Recent Developments and Future Outlook
- Table 6.18 REPROCELL: Company Snapshot
- Table 6.19 REPROCELL: Recent Developments and Future Outlook
- Table 6.20 Stemnovate: Company Snapshot
- Table 6.21 Stemnovate: Recent Developments and Future Outlook
- Table 6.22 Thermo Fisher Scientific: Company Snapshot
- Table 6.23 Thermo Fisher Scientific: Recent Developments and Future Outlook
- Table 7.1 Cell Reprogramming Services: List of Partnerships and Collaborations
- Table 9.1 Likely Partners for Cell Reprogramming Service and Product Providers in North America
- Table 9.2 Likely Partners for Cell Reprogramming Service and Product Providers in Europe
- Table 9.3 Likely Partners for Cell Reprogramming Service and Product Providers in Asia-Pacific and Rest of the World
- Table 9.4 Likely Partners for Cell Reprogramming Service and Product Providers in North America
- Table 9.5 Likely Partners for Cell Reprogramming Service and Product Providers in Europe
- Table 9.6 Likely Partners for Cell Reprogramming Service and Product Providers in Asia-Pacific and Rest of the World
- Table 11.1 Asgard Therapeutics: Company Snapshot
- Table 11.2 Phenocell: Company Snapshot
- Table 13.1 Cell Reprogramming Service and Product Providers (Industry Players): Distribution by Year of Establishment
- Table 13.2 Cell Reprogramming Service and Product Providers (Industry Players): Distribution by Company Size
- Table 13.3 Cell Reprogramming Service and Product Providers (Industry Players): Distribution by Geographical Location
- Table 13.4 Cell Reprogramming Service and Product Providers (Industry Players): Distribution by Location of Manufacturing Facilities
- Table 13.5 Cell Reprogramming Service and Product Providers (Industry Players): Distribution by Type of Service
- Table 13.6 Cell Reprogramming Service and Product Providers (Industry Players): Distribution by Type of Offering
- Table 13.7 Cell Reprogramming Service and Product Providers (Industry Players): Distribution by Type of Technology
- Table 13.8 Cell Reprogramming Service and Product Providers (Industry Players): Distribution by Type of Technology and Year of Establishment
- Table 13.9 Cell Reprogramming Service and Product Providers (Industry Players): Distribution by Type of Vector Used
- Table 13.10 Cell Reprogramming Service and Product Providers (Industry Players): Distribution by Source Cell for iPSC Generation
- Table 13.11 Cell Reprogramming Service and Product Providers (Industry Players): Distribution by Type of Source Cell for iPSC Generation and company size
- Table 13.12 Cell Reprogramming Service and Product Providers (Industry Players): Distribution by Target Indication
- Table 13.13 Cell Reprogramming Service and Product Providers (Industry Players): Distribution by Type of directly reprogrammed cell
- Table 13.14 Cell Reprogramming Service and Product Providers (Industry Players): Distribution by Type of Application
- Table 13.15 Cell Reprogramming Service and Product Providers (Industry Players): Distribution by Type of Additional Service(s) Offered
- Table 13.16 Cell Reprogramming Service and Product Providers (Non-Industry Players): Distribution by Geographical Location
- Table 13.17 Cell Reprogramming Service and Product Providers (Non-Industry Players): Distribution by Type of Technology
- Table 13.18 Cell Reprogramming Service and Product Providers (Non-Industry Players): Distribution by Type of Vector Used
- Table 13.19 Cell Reprogramming Service and Product Providers (Non-Industry Players): Distribution by Source Cell for iPSC Generation
- Table 13.20 Clinical Trial Analysis: Distribution by Trial Status
- Table 13.21 Clinical Trial Analysis: Cumulative Distribution of Trials by Registration Year, Since Pre-2010
- Table 13.22 Clinical Trial Analysis: Distribution by Trial Phase
- Table 13.23 Clinical Trial Analysis: Distribution by Number of Patients Enrolled by Trial Registration Year, Since 2011
- Table 13.24 Clinical Trial Analysis: Distribution by Study Design
- Table 13.25 Clinical Trial Analysis: Cumulative Year-wise Trend by Trial Recruitment Status
- Table 13.26 Clinical Trial Analysis: Distribution by Type of Sponsor / Collaborator
- Table 13.27 Clinical Trial Analysis: Leading Industry Players
- Table 13.28 Clinical Trial Analysis: Analysis by Type of Stem Cell
- Table 13.29 Clinical Trial Analysis: Cumulative Distribution by Type of Stem Cell and Trial Registration Year
- Table 13.30 Clinical Trial Analysis: Distribution by Therapeutic Area
- Table 13.31 Clinical Trial Analysis: Year-Wise Trend in Activity for Popular Therapeutic Areas
- Table 13.32 Clinical Trial Analysis: Distribution by Patient Enrollment and Therapeutic Area
- Table 13.33 Clinical Trial Analysis: Year-Wise Trend in Patient Enrollment (in thousands) for Popular Therapeutic Areas
- Table 13.34 Clinical Trial Analysis: Distribution by Type of Stem Cell and Therapeutic Area
- Table 13.35 Clinical Trial Analysis: Geographical Distribution by Number of Trials
- Table 13.36 Clinical Trial Analysis: Geographical Distribution by Trial Registration Year and Recruitment Status
- Table 13.37 Clinical Trial Analysis: Geographical Distribution by Enrolled Patient
- Table 13.38 Partnerships and Collaborations: Analysis by Year of Partnership
- Table 13.39 Partnerships and Collaborations: Analysis by Type of Partnership
- Table 13.40 Partnerships and Collaborations: Analysis by Year of Partnership and Type of Partner
- Table 13.41 Partnerships and Collaborations: Analysis by Type of Partnership and Type of Partner
- Table 13.42 Partnerships and Collaborations: Analysis by Type of Stem Cell
- Table 13.43 Partnerships and Collaborations: Analysis by Target Therapeutic Area
- Table 13.44 Partnerships and Collaborations: Analysis by Application
- Table 13.45 Most Active Players: Distribution by Number of Partnerships
- Table 13.46 Partnerships and Collaborations: Regional Analysis
- Table 13.47 Partnerships and Collaborations: Intercontinental and Intracontinental Agreements
- Table 13.48 Global Cell Reprogramming Services and Products Market, Till 2035 (USD Million)
- Table 13.49 Global Cell Reprogramming Services and Products Market: Distribution by Type of Technology, Till 2035
- Table 13.50 Cell Reprogramming Services and Products Market for Episomal Reprogramming, Till 2035 (USD Million)
- Table 13.51 Cell Reprogramming Services and Products Market for mRNA Reprogramming, Till 2035 (USD Million)
- Table 13.52 Cell Reprogramming Services and Products Market for Sendai Virus-based Reprogramming, Till 2035 (USD Million)
- Table 13.53 Cell Reprogramming Services and Products Market for Other Reprogramming Technologies, Till 2035 (USD Million)
- Table 13.54 Global Cell Reprogramming Services and Products Market: Distribution by Source Cell for iPSC Generation, Till 2035
- Table 13.55 Cell Reprogramming Services and Products Market for Fibroblasts, Till 2035 (USD Million)
- Table 13.56 Cell Reprogramming Services and Products Market for Peripheral Blood Mononuclear Cells, Till 2035 (USD Million)
- Table 13.57 Cell Reprogramming Services and Products Market for Unspecified Somatic Cells, Till 2035 (USD Million)
- Table 13.58 Cell Reprogramming Services and Products Market for Other Cells, Till 2035 (USD Million)
- Table 13.59 Global Cell Reprogramming Services and Products Market: Distribution by Application, Till 2035
- Table 13.60 Cell Reprogramming Services and Products Market for Research, Till 2035 (USD Million)
- Table 13.61 Cell Reprogramming Services and Products Market for Therapeutic Use, Till 2035 (USD Million)
- Table 13.62 Global Cell Reprogramming Services and Products Market: Distribution by Key Geographical Regions, Till 2035
- Table 13.63 Cell Reprogramming Services and Products Market in North America, Till 2035 (USD Million)
- Table 13.64 Cell Reprogramming Services and Products Market in Europe, Till 2035 (USD Million)
- Table 13.65 Cell Reprogramming Services and Products Market in Asia-Pacific and Rest of the World, Till 2035 (USD Million)
List of Figures
- Figure 3.1 Cellular Lineages used for Isolation of Stem Cells
- Figure 3.2 Steps Involved in the Development and Administration of Stem Cells
- Figure 3.3 Classification of Stem Cells
- Figure 3.4 Classification based on Source of Stem Cell
- Figure 3.5 Differences between Allogeneic and Autologous Stem Cell Therapies
- Figure 3.6 Classification of Stem Cells based on Origin
- Figure 3.7 Classification of Adult Stem Cells
- Figure 3.8 Classification based on Potency of Stem Cell
- Figure 3.9 Key Application Areas for Stem Cell Therapies
- Figure 3.10 Potential Applications of Cell Reprogramming
- Figure 3.11 Key Growth Drivers and Constraints to Cell Reprogramming
- Figure 4.1 Cell Reprogramming Service and Product Providers (Industry Players): Distribution by Year of Establishment
- Figure 4.2 Cell Reprogramming Service and Product Providers (Industry Players): Distribution by Company Size
- Figure 4.3 Cell Reprogramming Service and Product Providers (Industry Players): Distribution by Geographical Location
- Figure 4.4 Cell Reprogramming Service and Product Providers (Industry Players): Distribution by Location of Manufacturing Facilities
- Figure 4.5 Cell Reprogramming Service and Product Providers (Industry Players): Distribution by Type of Service
- Figure 4.6 Cell Reprogramming Service and Product Providers (Industry Players): Distribution by Type of Offering
- Figure 4.7 Cell Reprogramming Service and Product Providers (Industry Players): Distribution by Type of Technology
- Figure 4.8 Cell Reprogramming Service and Product Providers (Industry Players): Distribution by Type of Technology and Year of Establishment
- Figure 4.9 Cell Reprogramming Service and Product Providers (Industry Players): Distribution by Type of Vector Used
- Figure 4.10 Cell Reprogramming Service and Product Providers (Industry Players): Distribution by Source Cell for iPSC Generation
- Figure 4.11 Cell Reprogramming Service and Product Providers (Industry Players): Distribution by Source Cell for iPSC Generation and Company size
- Figure 4.12 Cell Reprogramming Service and Product Providers (Industry Players): Distribution by Target Indication
- Figure 4.13 Cell Reprogramming Service and Product Providers (Industry Players): Distribution by Type of Directly Reprogrammed cells
- Figure 4.14 Cell Reprogramming Service and Product Providers (Industry Players): Distribution by Type of Application
- Figure 4.15 Cell Reprogramming Service and Product Providers (Industry Players): Distribution by Type of Additional Service(s) Offered
- Figure 4.16 Cell Reprogramming Service and Product Providers (Non-Industry Players): Distribution by Geographical Location
- Figure 4.17 Cell Reprogramming Service and Product Providers (Non-Industry Players): Distribution by Type of Technology
- Figure 4.18 Cell Reprogramming Service and Product Providers (Non-Industry Players): Distribution by Type of Vector Used
- Figure 4.19 Cell Reprogramming Service and Product Providers (Non-Industry Players): Distribution by Source Cell for iPSC Generation
- Figure 5.1 Competitiveness Analysis of iPSCs Generation Service and Product Providers
- Figure 5.2 Competitiveness Analysis of Direct Reprogramming Service and Product Providers
- Figure 7.1 Clinical Trial Analysis: Scope and Methodology
- Figure 7.2 Clinical Trial Analysis: Distribution by Trial Status
- Figure 7.3 Clinical Trial Analysis: Cumulative Distribution of Trials by Registration Year, Since Pre-2010
- Figure 7.4 Clinical Trial Analysis: Distribution by Trial Phase
- Figure 7.5 Clinical Trial Analysis: Distribution by Number of Patients Enrolled and Trial Registration Year, Since 2011
- Figure 7.6 Clinical Trial Analysis: Distribution by Study Design
- Figure 7.7 Clinical Trial Analysis: Cumulative Year-wise Trend by Trial Recruitment Status
- Figure 7.8 Clinical Trial Analysis: Distribution by Type of Sponsor / Collaborator
- Figure 7.9 Clinical Trial Analysis: Leading Industry Players
- Figure 7.10 Clinical Trial Analysis: Distribution by Focus Area
- Figure 7.11 Clinical Trial Analysis: Distribution by Type of Stem Cell
- Figure 7.12 Clinical Trial Analysis: Cumulative Distribution by Type of Stem Cell and Trial Registration Year
- Figure 7.13 Clinical Trial Analysis: Distribution by Therapeutic Area
- Figure 7.14 Clinical Trial Analysis: Year-Wise Trend in Activity for Popular Therapeutic Areas
- Figure 7.15 Clinical Trial Analysis: Distribution by Patient Enrollment and Therapeutic Area
- Figure 7.16 Clinical Trial Analysis: Year-Wise Trend in Patient Enrollment (in thousands) for Popular Therapeutic Areas
- Figure 7.17 Clinical Trial Analysis: Distribution by Type of Stem Cell and Therapeutic Area
- Figure 7.18 Clinical Trial Analysis: Geographical Distribution by Number of Trials
- Figure 7.19 Clinical Trial Analysis: Geographical Distribution by Trial Registration Year and Recruitment Status
- Figure 7.20 Clinical Trial Analysis: Geographical Distribution by Enrolled Patient Population
- Figure 8.1 Partnerships and Collaborations: Distribution by Year of Partnership
- Figure 8.2 Partnerships and Collaborations: Distribution by Type of Partnership
- Figure 8.3 Partnerships and Collaborations: Distribution by Year of Partnership and Type of Partner
- Figure 8.4 Partnerships and Collaborations: Distribution by Type of Partnership and Type of Partner
- Figure 8.5 Partnerships and Collaborations: Distribution by Type of Stem Cell
- Figure 8.6 Partnerships and Collaborations: Distribution by Target Therapeutic Area
- Figure 8.7 Partnerships and Collaborations: Distribution by Application
- Figure 8.8 Most Active Players: Distribution by Number of Partnerships
- Figure 8.9 Partnerships and Collaborations: Regional Analysis
- Figure 8.10 Partnerships and Collaborations: Intercontinental and Intracontinental Agreement
- Figure 10.1 Global Cell Reprogramming Services and Products Market, Till 2035 (USD Million)
- Figure 10.2 Global Cell Reprogramming Services and Products Market: Distribution by Type of Technology, Till 2035
- Figure 10.3 Cell Reprogramming Services and Products Market for Episomal Reprogramming, Till 2035 (USD Million)
- Figure 10.4 Cell Reprogramming Services and Products Market for mRNA Reprogramming, Till 2035 (USD Million)
- Figure 10.5 Cell Reprogramming Services and Products Market for Sendai Virus-based Reprogramming, Till 2035 (USD Million)
- Figure 10.6 Cell Reprogramming Services and Products Market for Other Reprogramming Technologies, Till 2035 (USD Million)
- Figure 10.7 Global Cell Reprogramming Services and Products Market: Distribution by Source Cell for iPSC Generation, Till 2035
- Figure 10.8 Cell Reprogramming Services and Products Market for Fibroblasts, Till 2035 (USD Million)
- Figure 10.9 Cell Reprogramming Services and Products Market for Peripheral Blood Mononuclear Cells, Till 2035 (USD Million)
- Figure 10.10 Cell Reprogramming Services and Products Market for Unspecified Somatic Cells, Till 2035 (USD Million)
- Figure 10.11 Cell Reprogramming Services and Products Market for Other Cells, Till 2035 (USD Million)
- Figure 10.12 Global Cell Reprogramming Services and Products Market: Distribution by Application, Till 2035
- Figure 10.13 Cell Reprogramming Services and Products Market for Research, Till 2035 (USD Million)
- Figure 10.14 Cell Reprogramming Services and Products Market for Therapeutic Use, Till 2035 (USD Million)
- Figure 10.15 Global Cell Reprogramming Services and Products Market: Distribution by Key Geographical Regions, Till 2035
- Figure 10.16 Cell Reprogramming Services and Products Market in North America, Till 2035 (USD Million)
- Figure 10.17 Cell Reprogramming Services and Products Market in Europe, Till 2035 (USD Million)
- Figure 10.18 Cell Reprogramming Services and Products Market in Asia-Pacific and Rest of the World, Till 2035 (USD Million)

