
PUBLISHER: Roots Analysis | PRODUCT CODE: 1895186

PUBLISHER: Roots Analysis | PRODUCT CODE: 1895186
AI in Medical Imaging Market, till 2030: Distribution by Application Area, Type of Image Processed, and Key Geographical Regions: Industry Trends and Global Forecasts
AI in Medical Imaging Market Outlook
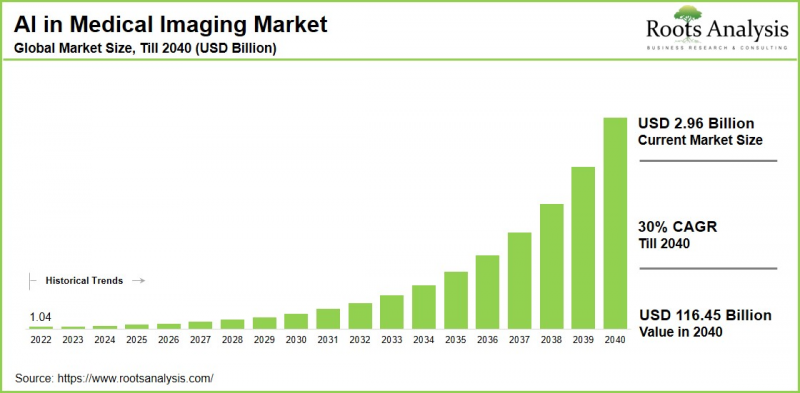
As per Roots Analysis, the global AI in medical imaging market size is estimated to grow from USD 1.75 billion in current year to USD 8.56 billion by 2040, at a CAGR of 30% during the forecast period, till 2040. The new study provides a comprehensive AI in medical imaging market analysis, pipeline analysis, partnerships and collaborations, funding and investments analysis, company valuation analysis, patent analysis, cost saving analysis and detailed market analysis.
The growth of the AI in medical imaging market over the next ten years is expected to stem from the rising implementation of artificial intelligence (AI) technology, especially in deep learning algorithms, a growing emphasis on personalized and precision medicine, unmet needs within the target demographic, and backing from venture capital. Deep learning is an approach to machine learning that utilizes sophisticated algorithms and artificial neural networks to enable unsupervised pattern recognition and insight generation from large quantities of unstructured data. This technology is progressively being integrated into various areas of the healthcare industry, including medical diagnosis based on imaging and data analysis.
Over time, various stakeholders in the industry have developed proprietary deep learning algorithms for medical image processing. At present, numerous innovators assert they have created systems that can teach computers to examine and prioritize medical images, identifying patterns connected to both temporal and spatial changes that may not even be discernible to the human eye.
Strategic Insights for Senior Leaders
Key Drivers Propelling Growth of AI in Medical Imaging Market
The primary factors propelling the AI in medical imaging market include the increasing number of diagnostic procedures, lack of qualified radiologists, rising integration of AI in telemedicine and remote diagnostics, and the necessity to efficiently manage large medical datasets. Innovations in technology such as deep learning, convolutional neural networks, and generative adversarial networks have enhanced the accuracy and effectiveness of AI applications in medical image analysis. Furthermore, support from governments, beneficial regulatory environments, and collaborations between hospitals and AI solution providers are speeding up the adoption process.
Other significant growth drivers include the expansion of AI applications across different medical imaging techniques, such as mammography, ultrasound, MRI, and pathology. AI assists in minimizing image noise, reducing radiation exposure during scans, and enhancing clinical decision-making processes.
Technological Advancements in AI in Medical Imaging Industry
Technological advancements in artificial intelligence (AI) have improved technology in medical imaging, enhancing the precision, efficiency, and customization of diagnostics. AI-driven algorithms can now accurately detect and identify abnormalities such as tumors and fractures across various imaging techniques, including CT, MRI, and X-ray. These systems take over routine tasks, optimize workflows, and alleviate radiologist fatigue, enabling clinicians to focus on more complex cases. Additionally, AI combines imaging information with clinical and genomic data to provide tailored insights and predictive analytics for assessing disease risk. Innovations like generative AI amplify image datasets, while real-time AI tools aid in surgical navigation, enhancing procedural accuracy.
Moreover, explainable AI and federated learning improve transparency and scalability within clinical environments. Collectively, these developments are transforming medical imaging by facilitating earlier and more precise diagnoses, ultimately enhancing patient outcomes globally.
AI in Medical Imaging Market: Competitive Landscape of Companies in this Industry
The competitive landscape of AI in medical imaging market is characterized by intense competition, featuring a combination of large and smaller firms. Leading Tier I companies (GE Healthcare, Siemens Healthineers, Philips, Canon Medical) maintain their dominance by incorporating integrated AI ecosystems into their imaging systems. Tier II companies (Aidoc, Arterys, Qure.ai, Gleamer, Viz.ai) are transforming the market through agile, cloud-native algorithms designed for disease-specific applications. The future differentiation in competition will depend on factors like model explainability, interoperability, and the extent of clinical validation. Emerging trends related to AI marketplaces, open AI platforms, and vendor-neutral integration frameworks are anticipated to further reshape competitive dynamics.
AI in Medical Imaging Evolution: Emerging Trends in the Industry
Key trends in this industry include faster regulatory approvals that facilitate broader clinical implementation, the utilization of AI to tailor scanning protocols according to patient information, and the introduction of AI-powered tools for optimizing workflows, particularly in radiology where routine diagnostics are increasingly handled by AI. Innovative developments like AI-assisted ultrasound, real-time image evaluation during surgeries, and cloud-based solutions are improving access to advanced imaging, even in rural and underserved regions. These advancements are shifting imaging from a qualitative discipline to one driven by data, focusing on patient-centric approaches with improved accuracy, efficiency, and healthcare equality.
Key Market Challenges
Key obstacles in the AI in medical imaging include significant costs for implementation and ongoing maintenance, concerns regarding the privacy and security of sensitive patient data. Additionally, regulatory challenges related to new technologies, and the necessity for smooth integration with established systems along with acceptance from healthcare professionals also hinders the growth.
Other significant challenges include insufficient integration into existing workflows, fragmented healthcare data, and isolated IT systems, which hinder the seamless deployment of AI solutions. Moreover, ethical and regulatory issues regarding data privacy, biases in AI models, and ensuring accountability impede clinical adoption. Additionally, there is a lack of a qualified AI workforce and vague regulatory guidance, which further complicates growth and integration into everyday clinical practice.
Regional Analysis: Asia to Hold the Largest Share in the Market
According to our estimates North America currently captures a significant share of the AI in medical imaging market. This is due to its sophisticated healthcare system, considerable financial support for healthcare technology, and vigorous research and development efforts, particularly in the US. The presence of many top technology companies and innovative startups promotes the advancement and implementation of state-of-the-art AI applications.
Furthermore, the regulatory environment in North America, characterized by proactive FDA approvals and reimbursement incentives, facilitates the introduction of AI solutions. This region also has a high prevalence of chronic diseases, which boosts the demand for early and precise diagnoses through AI-enhanced imaging.
AI in Medical Imaging Market: Key Market Segmentation
Application Area
- Lung Infections / Respiratory Disorders
- Brain Injuries / Disorders
- Lung Cancer
- Cardiac Conditions / Cardiovascular Disorders
- Bone Deformities / Orthopedic Disorders
- Breast Cancer
- Other Application Areas
Type of Image Processed
- X-ray
- MRI
- CT
- Ultrasound
Geographical Regions
- North America
- US
- Canada
- Mexico
- Other North American countries
- Europe
- Austria
- Belgium
- Denmark
- France
- Germany
- Ireland
- Italy
- Netherlands
- Norway
- Russia
- Spain
- Sweden
- Switzerland
- UK
- Other European countries
- Asia
- China
- India
- Japan
- Singapore
- South Korea
- Other Asian countries
- Latin America
- Brazil
- Chile
- Colombia
- Venezuela
- Other Latin American countries
- Middle East and North Africa
- Egypt
- Iran
- Iraq
- Israel
- Kuwait
- Saudi Arabia
- UAE
- Other MENA countries
- Rest of the World
- Australia
- New Zealand
- Other countries
Example Players in AI in Medical Imaging Market
- Artelus
- Arterys
- Butterfly Network
- ContextVision
- Enlitic
- Echonous
- GE Healthcare
- InferVision
- VUNO
AI in Medical Imaging Market: Report Coverage
The report on the AI in medical imaging market features insights on various sections, including:
- Market Sizing and Opportunity Analysis: An in-depth analysis of the AI in medical imaging market, focusing on key market segments, including [A] application area, [B] type of image processed, and [C] key geographical regions.
- Competitive Landscape: A comprehensive analysis of the companies engaged in the AI in medical imaging market, based on several relevant parameters, such as [A] year of establishment, [B] company size, [C] location of headquarters and [D] ownership structure.
- Company Profiles: Elaborate profiles of prominent players engaged in the AI in medical imaging market, providing details on [A] location of headquarters, [B] company size, [C] company mission, [D] company footprint, [E] management team, [F] contact details, [G] financial information, [H] operating business segments, [I] portfolio, [J] recent developments, and an informed future outlook.
- Megatrends: An evaluation of ongoing megatrends in the AI in medical imaging industry.
- Patent Analysis: An insightful analysis of patents filed / granted in the AI in medical imaging domain, based on relevant parameters, including [A] type of patent, [B] patent publication year, [C] patent age and [D] leading players.
- Recent Developments: An overview of the recent developments made in the AI in medical imaging market, along with analysis based on relevant parameters, including [A] year of initiative, [B] type of initiative, [C] geographical distribution and [D] most active players.
- Porter's Five Forces Analysis: An analysis of five competitive forces prevailing in the AI in medical imaging market, including threats of new entrants, bargaining power of buyers, bargaining power of suppliers, threats of substitute products and rivalry among existing competitors.
- SWOT Analysis: An insightful SWOT framework, highlighting the strengths, weaknesses, opportunities and threats in the domain. Additionally, it provides Harvey ball analysis, highlighting the relative impact of each SWOT parameter.
- Value Chain Analysis: A comprehensive analysis of the value chain, providing information on the different phases and stakeholders involved in the AI in medical imaging market.
Key Questions Answered in this Report
- What is the current and future market size?
- Who are the leading companies in this market?
- What are the growth drivers that are likely to influence the evolution of this market?
- What are the key partnership and funding trends shaping this industry?
- Which region is likely to grow at higher CAGR till 2040?
- How is the current and future market opportunity likely to be distributed across key market segments?
Reasons to Buy this Report
- Detailed Market Analysis: The report provides a comprehensive market analysis, offering detailed revenue projections of the overall market and its specific sub-segments. This information is valuable to both established market leaders and emerging entrants.
- In-depth Analysis of Trends: Stakeholders can leverage the report to gain a deeper understanding of the competitive dynamics within the market. Each report maps ecosystem activity across partnerships, funding, and patent landscapes to reveal growth hotspots and white spaces in the industry.
- Opinion of Industry Experts: The report features extensive interviews and surveys with key opinion leaders and industry experts to validate market trends mentioned in the report.
- Decision-ready Deliverables: The report offers stakeholders with strategic frameworks (Porter's Five Forces, value chain, SWOT), and complimentary Excel / slide packs with customization support.
Additional Benefits
- Complimentary Dynamic Excel Dashboards for Analytical Modules
- Exclusive 15% Free Content Customization
- Personalized Interactive Report Walkthrough with Our Expert Research Team
- Free Report Updates for Versions Older than 6-12 Months
TABLE OF CONTENTS
SECTION I: REPORT OVERVIEW
1. PREFACE
- 1.1. Introduction
- 1.2. Market Share Insights
- 1.3. Key Market Insights
- 1.4. Report Coverage
- 1.5. Key Questions Answered
- 1.6. Chapter Outlines
2. RESEARCH METHODOLOGY
- 2.1. Chapter Overview
- 2.2. Research Assumptions
- 2.3. Database Building
- 2.3.1. Data Collection
- 2.3.2. Data Validation
- 2.3.3. Data Analysis
- 2.4. Project Methodology
- 2.4.1. Secondary Research
- 2.4.1.1. Annual Reports
- 2.4.1.2. Academic Research Papers
- 2.4.1.3. Company Websites
- 2.4.1.4. Investor Presentations
- 2.4.1.5. Regulatory Filings
- 2.4.1.6. White Papers
- 2.4.1.7. Industry Publications
- 2.4.1.8. Conferences and Seminars
- 2.4.1.9. Government Portals
- 2.4.1.10. Media and Press Releases
- 2.4.1.11. Newsletters
- 2.4.1.12. Industry Databases
- 2.4.1.13. Roots Proprietary Databases
- 2.4.1.14. Paid Databases and Sources
- 2.4.1.15. Social Media Portals
- 2.4.1.16. Other Secondary Sources
- 2.4.2. Primary Research
- 2.4.2.1. Introduction
- 2.4.2.2. Types
- 2.4.2.2.1. Qualitative
- 2.4.2.2.2. Quantitative
- 2.4.2.3. Advantages
- 2.4.2.4. Techniques
- 2.4.2.4.1. Interviews
- 2.4.2.4.2. Surveys
- 2.4.2.4.3. Focus Groups
- 2.4.2.4.4. Observational Research
- 2.4.2.4.5. Social Media Interactions
- 2.4.2.5. Stakeholders
- 2.4.2.5.1. Company Executives (CXOs)
- 2.4.2.5.2. Board of Directors
- 2.4.2.5.3. Company Presidents and Vice Presidents
- 2.4.2.5.4. Key Opinion Leaders
- 2.4.2.5.5. Research and Development Heads
- 2.4.2.5.6. Technical Experts
- 2.4.2.5.7. Subject Matter Experts
- 2.4.2.5.8. Scientists
- 2.4.2.5.9. Doctors and Other Healthcare Providers
- 2.4.2.6. Ethics and Integrity
- 2.4.2.6.1. Research Ethics
- 2.4.2.6.2. Data Integrity
- 2.4.3. Analytical Tools and Databases
- 2.4.1. Secondary Research
3. MARKET DYNAMICS
- 3.1. Forecast Methodology
- 3.1.1. Top-Down Approach
- 3.1.2. Bottom-Up Approach
- 3.1.3. Hybrid Approach
- 3.2. Market Assessment Framework
- 3.2.1. Total Addressable Market (TAM)
- 3.2.2. Serviceable Addressable Market (SAM)
- 3.2.3. Serviceable Obtainable Market (SOM)
- 3.2.4. Currently Acquired Market (CAM)
- 3.3. Forecasting Tools and Techniques
- 3.3.1. Qualitative Forecasting
- 3.3.2. Correlation
- 3.3.3. Regression
- 3.3.4. Time Series Analysis
- 3.3.5. Extrapolation
- 3.3.6. Convergence
- 3.3.7. Forecast Error Analysis
- 3.3.8. Data Visualization
- 3.3.9. Scenario Planning
- 3.3.10. Sensitivity Analysis
- 3.4. Key Considerations
- 3.4.1. Demographics
- 3.4.2. Market Access
- 3.4.3. Reimbursement Scenarios
- 3.4.4. Industry Consolidation
- 3.5. Robust Quality Control
- 3.6. Key Market Segmentations
- 3.7. Limitations
4. MACRO-ECONOMIC INDICATORS
- 4.1. Chapter Overview
- 4.2. Market Dynamics
- 4.2.1. Time Period
- 4.2.1.1. Historical Trends
- 4.2.1.2. Current and Forecasted Estimates
- 4.2.2. Currency Coverage
- 4.2.2.1. Overview of Major Currencies Affecting the Market
- 4.2.2.2. Impact of Currency Fluctuations on the Industry
- 4.2.3. Foreign Exchange Impact
- 4.2.3.1. Evaluation of Foreign Exchange Rates and Their Impact on Market
- 4.2.3.2. Strategies for Mitigating Foreign Exchange Risk
- 4.2.4. Recession
- 4.2.4.1. Historical Analysis of Past Recessions and Lessons Learnt
- 4.2.4.2. Assessment of Current Economic Conditions and Potential Impact on the Market
- 4.2.5. Inflation
- 4.2.5.1. Measurement and Analysis of Inflationary Pressures in the Economy
- 4.2.5.2. Potential Impact of Inflation on the Market Evolution
- 4.2.6. Interest Rates
- 4.2.6.1. Overview of Interest Rates and Their Impact on the Market
- 4.2.6.2. Strategies for Managing Interest Rate Risk
- 4.2.7. Commodity Flow Analysis
- 4.2.7.1. Type of Commodity
- 4.2.7.2. Origins and Destinations
- 4.2.7.3. Values and Weights
- 4.2.7.4. Modes of Transportation
- 4.2.8. Global Trade Dynamics
- 4.2.8.1. Import Scenario
- 4.2.8.2. Export Scenario
- 4.2.9. War Impact Analysis
- 4.2.9.1. Russian-Ukraine War
- 4.2.9.2. Israel-Hamas War
- 4.2.10. COVID Impact / Related Factors
- 4.2.10.1. Global Economic Impact
- 4.2.10.2. Industry-specific Impact
- 4.2.10.3. Government Response and Stimulus Measures
- 4.2.10.4. Future Outlook and Adaptation Strategies
- 4.2.11. Other Indicators
- 4.2.11.1. Fiscal Policy
- 4.2.11.2. Consumer Spending
- 4.2.11.3. Gross Domestic Product (GDP)
- 4.2.11.4. Employment
- 4.2.11.5. Taxes
- 4.2.11.6. R&D Innovation
- 4.2.11.7. Stock Market Performance
- 4.2.11.8. Supply Chain
- 4.2.11.9. Cross-Border Dynamics
- 4.2.1. Time Period
SECTION II: QUALITATIVE INSIGHTS
5. EXECUTIVE SUMMARY
6. INTRODUCTION
- 6.1. Chapter Overview
- 6.2. Overview of AI in Medical Imaging Market
- 6.2.1. Evolution and Milestones
- 6.2.2. Type of Technology
- 6.2.3. Key Applications
- 6.2.4. Regulatory and Ethical Considerations
- 6.3. Future Perspective
7. REGULATORY SCENARIO
SECTION III: MARKET OVERVIEW
8. COMPREHENSIVE DATABASE OF LEADING PLAYERS
9. COMPETITIVE LANDSCAPE
- 9.1. Chapter Overview
- 9.2. AI in Medical Imaging Market: Overall Market Landscape
- 9.2.1. Analysis by Year of Establishment
- 9.2.2. Analysis by Company Size
- 9.2.3. Analysis by Location of Headquarters
- 9.2.4. Analysis by Type of AI In Medical Imaging Solution Provider
10. WHITE SPACE ANALYSIS
11. COMPANY COMPETITIVENESS ANALYSIS
12. STARTUP ECOSYSTEM IN THE AI IN MEDICAL IMAGING MARKET
- 12.1. AI in Medical Imaging Market: Market Landscape of Startups
- 12.1.1. Analysis by Year of Establishment
- 12.1.2. Analysis by Company Size
- 12.1.3. Analysis by Company Size and Year of Establishment
- 12.1.4. Analysis by Location of Headquarters
- 12.1.5. Analysis by Company Size and Location of Headquarters
- 12.1.6. Analysis by Ownership Structure
- 12.2. Key Findings
SECTION IV: COMPANY PROFILES
13. COMPANY PROFILES
- 13.1. Chapter Overview
- 13.2. Artelus *
- 13.2.1. Company Overview
- 13.2.2. Company Mission
- 13.2.3. Company Footprint
- 13.2.4. Management Team
- 13.2.5. Contact Details
- 13.2.6. Financial Performance
- 13.2.7. Operating Business Segments
- 13.2.8. Service / Product Portfolio (project specific)
- 13.2.9. MOAT Analysis
- 13.2.10. Recent Developments and Future Outlook
- 13.3. Arterys
- 13.4. Butterfly Network
- 13.5. ContextVision
- 13.6. Enlitic
- 13.7. Echonous
- 13.8. GE Healthcare
- 13.9. InferVision
- 13.10. VUNO
SECTION V: MARKET TRENDS
14. MEGA TRENDS ANALYSIS
15. PATENT ANALYSIS
16. RECENT DEVELOPMENTS
- 16.1. Chapter Overview
- 16.2. Recent Funding
- 16.3. Recent Partnerships
- 16.4. Other Recent Initiatives
SECTION VI: MARKET OPPORTUNITY ANALYSIS
17. GLOBAL AI IN MEDICAL IMAGING MARKET
- 17.1. Chapter Overview
- 17.2. Key Assumptions and Methodology
- 17.3. Trends Disruption Impacting Market
- 17.4. Demand Side Trends
- 17.5. Supply Side Trends
- 17.6. Global AI in Medical Imaging Market, Historical Trends (Since 2020) and Forecasted Estimates (Till 2040)
- 17.7. Multivariate Scenario Analysis
- 17.7.1. Conservative Scenario
- 17.7.2. Optimistic Scenario
- 17.8. Investment Feasibility Index
- 17.9. Key Market Segmentations
18. MARKET OPPORTUNITIES BASED ON APPLICATION AREA
- 18.1. Chapter Overview
- 18.2. Key Assumptions and Methodology
- 18.3. Revenue Shift Analysis
- 18.4. Market Movement Analysis
- 18.5. Penetration-Growth (P-G) Matrix
- 18.6. AI in Medical Imaging Market for Lung Infections / Respiratory Disorders: Historical Trends (Since 2020) and Forecasted Estimates (Till 2040)
- 18.7. AI in Medical Imaging Market for Brain Injuries / Disorders: Historical Trends (Since 2020) and Forecasted Estimates (Till 2040)
- 18.8. AI in Medical Imaging Market for Lung Cancer: Historical Trends (Since 2020) and Forecasted Estimates (Till 2040)
- 18.9. AI in Medical Imaging Market for Cardiac Conditions / Cardiovascular Disorders: Historical Trends (Since 2020) and Forecasted Estimates (Till 2040)
- 18.10. AI in Medical Imaging Market for Bone Deformities / Orthopedic Disorders: Historical Trends (Since 2020) and Forecasted Estimates (Till 2040)
- 18.11. AI in Medical Imaging Market for Breast Cancer: Historical Trends (Since 2020) and Forecasted Estimates (Till 2040)
- 18.12. AI in Medical Imaging Market for Other Application Areas: Historical Trends (Since 2020) and Forecasted Estimates (Till 2040)
- 18.13. Data Triangulation and Validation
- 18.13.1. Secondary Sources
- 18.13.2. Primary Sources
- 18.13.3. Statistical Modeling
19. MARKET OPPORTUNITIES BASED ON TYPE OF IMAGE PROCESSED
- 19.1. Chapter Overview
- 19.2. Key Assumptions and Methodology
- 19.3. Revenue Shift Analysis
- 19.4. Market Movement Analysis
- 19.5. Penetration-Growth (P-G) Matrix
- 19.6. AI in Medical Imaging Market for X-ray: Historical Trends (Since 2020) and Forecasted Estimates (Till 2040)
- 19.7. AI in Medical Imaging Market for MRI: Historical Trends (Since 2020) and Forecasted Estimates (Till 2040)
- 19.8. AI in Medical Imaging Market for CT: Historical Trends (Since 2020) and Forecasted Estimates (Till 2040)
- 19.9. AI in Medical Imaging Market for Ultrasound: Historical Trends (Since 2020) and Forecasted Estimates (Till 2040)
- 19.10. Data Triangulation and Validation
- 19.10.1. Secondary Sources
- 19.10.2. Primary Sources
- 19.10.3. Statistical Modeling
20. MARKET OPPORTUNITIES FOR AI IN MEDICAL IMAGING IN NORTH AMERICA
- 20.1. Chapter Overview
- 20.2. Key Assumptions and Methodology
- 20.3. Revenue Shift Analysis
- 20.4. Market Movement Analysis
- 20.5. Penetration-Growth (P-G) Matrix
- 20.6. AI in Medical Imaging Market in North America: Historical Trends (Since 2020) and Forecasted Estimates (Till 2040)
- 20.6.1. AI in Medical Imaging Market in the US: Historical Trends (Since 2020) and Forecasted Estimates (Till 2040)
- 20.6.2. AI in Medical Imaging Market in Canada: Historical Trends (Since 2020) and Forecasted Estimates (Till 2040)
- 20.6.3. AI in Medical Imaging Market in Mexico: Historical Trends (Since 2020) and Forecasted Estimates (Till 2040)
- 20.6.4. AI in Medical Imaging Market in Other North American Countries: Historical Trends (Since 2020) and Forecasted Estimates (Till 2040)
- 20.7. Data Triangulation and Validation
21. MARKET OPPORTUNITIES FOR AI IN MEDICAL IMAGING IN EUROPE
- 21.1. Chapter Overview
- 21.2. Key Assumptions and Methodology
- 21.3. Revenue Shift Analysis
- 21.4. Market Movement Analysis
- 21.5. Penetration-Growth (P-G) Matrix
- 21.6. AI in Medical Imaging Market in Europe: Historical Trends (Since 2020) and Forecasted Estimates (Till 2040)
- 21.6.1. AI in Medical Imaging Market in Austria: Historical Trends (Since 2020) and Forecasted Estimates (Till 2040)
- 21.6.2. AI in Medical Imaging Market in Belgium: Historical Trends (Since 2020) and Forecasted Estimates (Till 2040)
- 21.6.3. AI in Medical Imaging Market in Denmark: Historical Trends (Since 2020) and Forecasted Estimates (Till 2040)
- 21.6.4. AI in Medical Imaging Market in France: Historical Trends (Since 2020) and Forecasted Estimates (Till 2040)
- 21.6.5. AI in Medical Imaging Market in Germany: Historical Trends (Since 2020) and Forecasted Estimates (Till 2040)
- 21.6.6. AI in Medical Imaging Market in Ireland: Historical Trends (Since 2020) and Forecasted Estimates (Till 2040)
- 21.6.7. AI in Medical Imaging Market in Italy: Historical Trends (Since 2020) and Forecasted Estimates (Till 2040)
- 21.6.8. AI in Medical Imaging Market in Netherlands: Historical Trends (Since 2020) and Forecasted Estimates (Till 2040)
- 21.6.9. AI in Medical Imaging Market in Norway: Historical Trends (Since 2020) and Forecasted Estimates (Till 2040)
- 21.6.10. AI in Medical Imaging Market in Russia: Historical Trends (Since 2020) and Forecasted Estimates (Till 2040)
- 21.6.11. AI in Medical Imaging Market in Spain: Historical Trends (Since 2020) and Forecasted Estimates (Till 2040)
- 21.6.12. AI in Medical Imaging Market in Sweden: Historical Trends (Since 2020) and Forecasted Estimates (Till 2040)
- 21.6.13. AI in Medical Imaging Market in Switzerland: Historical Trends (Since 2020) and Forecasted Estimates (Till 2040)
- 21.6.14. AI in Medical Imaging Market in the UK: Historical Trends (Since 2020) and Forecasted Estimates (Till 2040)
- 21.6.15. AI in Medical Imaging Market in Other European Countries: Historical Trends (Since 2020) and Forecasted Estimates (Till 2040)
- 21.7. Data Triangulation and Validation
22. MARKET OPPORTUNITIES FOR AI IN MEDICAL IMAGING IN ASIA
- 22.1. Chapter Overview
- 22.2. Key Assumptions and Methodology
- 22.3. Revenue Shift Analysis
- 22.4. Market Movement Analysis
- 22.5. Penetration-Growth (P-G) Matrix
- 22.6. AI in Medical Imaging Market in Asia: Historical Trends (Since 2020) and Forecasted Estimates (Till 2040)
- 22.6.1. AI in Medical Imaging Market in China: Historical Trends (Since 2020) and Forecasted Estimates (Till 2040)
- 22.6.2. AI in Medical Imaging Market in India: Historical Trends (Since 2020) and Forecasted Estimates (Till 2040)
- 22.6.3. AI in Medical Imaging Market in Japan: Historical Trends (Since 2020) and Forecasted Estimates (Till 2040)
- 22.6.4. AI in Medical Imaging Market in Singapore: Historical Trends (Since 2020) and Forecasted Estimates (Till 2040)
- 22.6.5. AI in Medical Imaging Market in South Korea: Historical Trends (Since 2020) and Forecasted Estimates (Till 2040)
- 22.6.6. AI in Medical Imaging Market in Other Asian Countries: Historical Trends (Since 2020) and Forecasted Estimates (Till 2040)
- 22.7. Data Triangulation and Validation
23. MARKET OPPORTUNITIES FOR AI IN MEDICAL IMAGING IN MIDDLE EAST AND NORTH AFRICA (MENA)
- 23.1. Chapter Overview
- 23.2. Key Assumptions and Methodology
- 23.3. Revenue Shift Analysis
- 23.4. Market Movement Analysis
- 23.5. Penetration-Growth (P-G) Matrix
- 23.6. AI in Medical Imaging Market in Middle East and North Africa (MENA): Historical Trends (Since 2020) and Forecasted Estimates (Till 2040)
- 23.6.1. AI in Medical Imaging Market in Egypt: Historical Trends (Since 2020) and Forecasted Estimates (Till 205)
- 23.6.2. AI in Medical Imaging Market in Iran: Historical Trends (Since 2020) and Forecasted Estimates (Till 2040)
- 23.6.3. AI in Medical Imaging Market in Iraq: Historical Trends (Since 2020) and Forecasted Estimates (Till 2040)
- 23.6.4. AI in Medical Imaging Market in Israel: Historical Trends (Since 2020) and Forecasted Estimates (Till 2040)
- 23.6.5. AI in Medical Imaging Market in Kuwait: Historical Trends (Since 2020) and Forecasted Estimates (Till 2040)
- 23.6.6. AI in Medical Imaging Market in Saudi Arabia: Historical Trends (Since 2020) and Forecasted Estimates (Till 2040)
- 23.6.7. AI in Medical Imaging Market in United Arab Emirates (UAE): Historical Trends (Since 2020) and Forecasted Estimates (Till 2040)
- 23.6.8. AI in Medical Imaging Market in Other MENA Countries: Historical Trends (Since 2020) and Forecasted Estimates (Till 2040)
- 23.7. Data Triangulation and Validation
24. MARKET OPPORTUNITIES FOR AI IN MEDICAL IMAGING IN LATIN AMERICA
- 24.1. Chapter Overview
- 24.2. Key Assumptions and Methodology
- 24.3. Revenue Shift Analysis
- 24.4. Market Movement Analysis
- 24.5. Penetration-Growth (P-G) Matrix
- 24.6. AI in Medical Imaging Market in Latin America: Historical Trends (Since 2020) and Forecasted Estimates (Till 2040)
- 24.6.1. AI in Medical Imaging Market in Argentina: Historical Trends (Since 2020) and Forecasted Estimates (Till 2040)
- 24.6.2. AI in Medical Imaging Market in Brazil: Historical Trends (Since 2020) and Forecasted Estimates (Till 2040)
- 24.6.3. AI in Medical Imaging Market in Chile: Historical Trends (Since 2020) and Forecasted Estimates (Till 2040)
- 24.6.4. AI in Medical Imaging Market in Colombia Historical Trends (Since 2020) and Forecasted Estimates (Till 2040)
- 24.6.5. AI in Medical Imaging Market in Venezuela: Historical Trends (Since 2020) and Forecasted Estimates (Till 2040)
- 24.6.6. AI in Medical Imaging Market in Other Latin American Countries: Historical Trends (Since 2020) and Forecasted Estimates (Till 2040)
- 24.7. Data Triangulation and Validation
25. MARKET OPPORTUNITIES FOR AI IN MEDICAL IMAGING IN REST OF THE WORLD
- 25.1. Chapter Overview
- 25.2. Key Assumptions and Methodology
- 25.3. Revenue Shift Analysis
- 25.4. Market Movement Analysis
- 25.5. Penetration-Growth (P-G) Matrix
- 25.6. AI in Medical Imaging Market in Rest of the World: Historical Trends (Since 2020) and Forecasted Estimates (Till 2040)
- 25.6.1. AI in Medical Imaging Market in Australia: Historical Trends (Since 2020) and Forecasted Estimates (Till 2040)
- 25.6.2. AI in Medical Imaging Market in New Zealand: Historical Trends (Since 2020) and Forecasted Estimates (Till 2040)
- 25.6.3. AI in Medical Imaging Market in Other Countries
- 25.7. Data Triangulation and Validation
26. MARKET CONCENTRATION ANALYSIS: DISTRIBUTION BY LEADING PLAYERS
- 26.1. Leading Player 1
- 26.2. Leading Player 2
- 26.3. Leading Player 3
- 26.4. Leading Player 4
- 26.5. Leading Player 5
- 26.6. Leading Player 6
- 26.7. Leading Player 7
- 26.8. Leading Player 8
27. ADJACENT MARKET ANALYSIS
SECTION VII: STRATEGIC TOOLS
28. KEY WINNING STRATEGIES
29. PORTER'S FIVE FORCES ANALYSIS
30. SWOT ANALYSIS
31. ROOTS STRATEGIC RECOMMENDATIONS
- 31.1. Chapter Overview
- 31.2. Key Business-related Strategies
- 31.2.1. Research & Development
- 31.2.2. Product Manufacturing
- 31.2.3. Commercialization / Go-to-Market
- 31.2.4. Sales and Marketing
- 31.3. Key Operations-related Strategies
- 31.3.1. Risk Management
- 31.3.2. Workforce
- 31.3.3. Finance
- 31.3.4. Others
SECTION VIII: OTHER EXCLUSIVE INSIGHTS
32. INSIGHTS FROM PRIMARY RESEARCH
33. REPORT CONCLUSION
SECTION IX: APPENDIX
34. TABULATED DATA
35. LIST OF COMPANIES AND ORGANIZATIONS
36. ROOTS SUBSCRIPTION SERVICES
37. AUTHOR DETAILS

