
PUBLISHER: Roots Analysis | PRODUCT CODE: 1771305

PUBLISHER: Roots Analysis | PRODUCT CODE: 1771305
Drug Device Combination Products Market: Industry Trends and Global Forecasts - Distribution by Type of Device, Service Focus Area, Company Size, and Key Geographical Regions
GLOBAL DRUG DEVICE COMBINATION PRODUCTS MARKET: GROWTH AND TRENDS
Non-adherence to prescribed medication regimens is a significant issue that not only negatively impacts patient health but also increases the overall burden on the pharmaceutical industry. As recently reported by Contract Pharma, medication non-adherence is estimated to cost drug developers over USD 250 billion each year. Additionally, the lack of effective solutions for sustained or controlled release of active pharmaceutical ingredients (APIs) at targeted delivery sites remains a major challenge in drug delivery. In fact, inadequate control over API release can lead to fluctuations in plasma drug levels, which may result in various side effects. This has led to a rise in the demand for effective drug delivery treatment options for patients.
Notably, in the recent past the development of combination products has attracted significant interest from pharmaceutical companies. These products integrate two or more FDA-regulated components to enable controlled release of APIs. However, creating drug-device combination products is a complex and lengthy process that demands innovative technologies, substantial investment, and specialized expertise. Additional challenges include ensuring drug-device compatibility, addressing user requirements, conducting release testing, and meeting production and packaging standards. To address these hurdles and improve patient outcomes, many developers are now outsourcing key operations to specialized companies that provide testing and validation services for combination products.
GLOBAL DRUG DEVICE COMBINATION PRODUCTS MARKET: KEY INSIGHTS
The report delves into the current state of global drug device combination products market and identifies potential growth opportunities within industry. Some key findings from the report include:
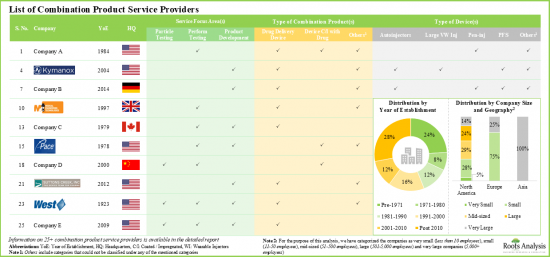
- At present, more than 25 companies across the globe offer services for the development and testing of various drug-device combination products.
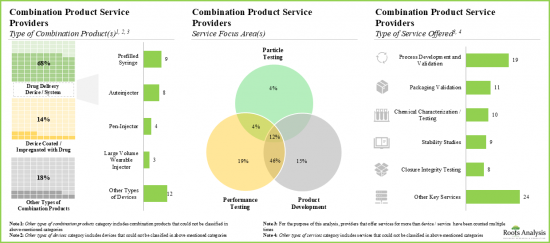
- Service providers claim to have the necessary expertise to provide a wide range of services for different types of combination products; majority (~20%) of these services are focused on performance testing.
- Majority of the players (over 85%) that support development and testing of drug delivery devices / systems are headquartered in North America.
- Over 45% of the service providers assist the performance testing and product development of combination products; of these, 40% are large / very large players.
- Around 75% of the combination product service providers perform the process development and validation; examples include BS, EKG Labs, Exponent and Surpass.
- In order to gain an edge in this competitive industry, service providers are continuously undertaking initiatives to upgrade their existing service offerings.
- To keep pace with the growing demand, many companies have undertaken expansion initiatives, such as establishing new facilities (~40%) or expanding their existing capabilities (~50%), to strengthen their service portfolio.
- Majority of the expansion initiatives were undertaken by combination product service providers based in the US; examples include DDL, NAMSA, and Nelson Labs.
- Majority expansions were undertaken in order to meet the increasing demand for testing services related to combination products.
- Most of the expansions reported were local initiatives; some companies based in the US have undertaken international expansions initiatives as well.
- Presently, over 210 combination products have been / are being developed for the treatment of various clinical conditions; these can be used for both parenteral as well as non-parenteral drug delivery.
- The pipeline features a variety of combination products that have been / are being developed for various therapeutic areas; majority of the products are being evaluated for the administration of biologics.
- Majority of the large volume WI combination products (~80%) that are currently under development are being developed to provide basal dose.
- A sizeable proportion of large volume WI combination products are being developed for the treatment of neurological disorders (33%); examples include D-mine(R) Pump, and ND0701.
- Over 90% of the prefilled syringe combination products have been / are being developed to administer biologics; of these, majority are antibody-based molecules (48%).
- Combination product developers are anticipated to forge strategic alliances with service providers for the development and testing of their proprietary combination products.
- Built on our intellectual capital, we have proposed a proprietary framework to allow developers to decide whether to outsource manufacturing or keep it in-house; we expect majority of the small firms to outsource such operations.
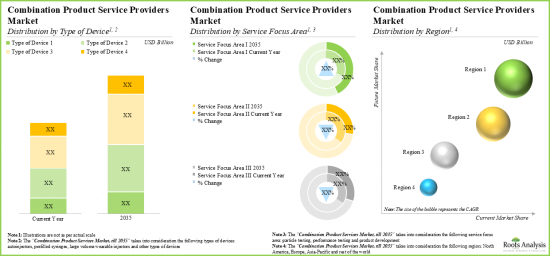
- With the rising demand for combination products, the affiliated market for service providers is expected to grow at a steady annualized rate over the coming decade.
Example Players in the Drug Device Combination Products Market
- EKG LABS
- Eurofins Medical Device Testing
- Exponent
- Kymanox
- Medical Engineering Technologies
- Pace Analytical Services
- Suttons Creek
- West Pharmaceutical Services
GLOBAL DRUG DEVICE COMBINATION PRODUCTS MARKET: RESEARCH COVERAGE
- Market Sizing and Opportunity Analysis: The report features an in-depth analysis of the global drug device combination products market, focusing on key market segments, including [A] type of device, [B] service focus area, [C] company size and [D] key geographical regions.
- Market Landscape: A comprehensive evaluation of combination product service providers, considering various parameters, such as [A] year of establishment, [B] company size, [C] location of headquarters, [D] type of combination product(s), [E] type of device(s), [F] service focus area(s), [G] type of service(s) offered, [H] location of facility and [I] leading players (in terms of number of services offered).
- Company Competitiveness Analysis: A comprehensive competitive analysis of combination product service providers, examining factors, such as [A] supplier power and [B] service portfolio strength.
- Company Profiles: In-depth profiles of companies that offer services for development and testing of combination products, focusing on [A] company overviews and [B] recent developments and an informed future outlook.
- Recent Expansions: An insightful analysis of recent expansions undertaken by various combination product service providers, based on various relevant parameters, such as [A] year of expansion, [B] type of expansion, [C] location of expanded facility, [D] most active players (in terms of number of recent expansions) and [E] geographical distribution.
- Case Study: A detailed discussion on the most advanced and popular combination products, including large volume wearable injectors and prefilled syringes combination products, providing information on their developer(s) and combination product specific features.
- Likely Partner Analysis: A comprehensive analysis of more than 90 combination product developers that are likely to partner with combination product service providers. These players analyzed based on various parameters, such as [A] pipeline strength, [B] developer strength and [C] product strength.
- Go or No-Go Framework Analysis: In-depth analysis highlighting the various factors that need to be considered by combination product developers while deciding whether to develop their respective products in-house or engage the services of a service provider.
KEY QUESTIONS ANSWERED IN THIS REPORT
- How many companies are currently engaged in this market?
- Which are the leading companies in this market?
- What factors are likely to influence the evolution of this market?
- What is the current and future market size?
- What is the CAGR of this market?
- How is the current and future market opportunity likely to be distributed across key market segments?
REASONS TO BUY THIS REPORT
- The report provides a comprehensive market analysis, offering detailed revenue projections of the overall market and its specific sub-segments. This information is valuable to both established market leaders and emerging entrants.
- Stakeholders can leverage the report to gain a deeper understanding of the competitive dynamics within the market. By analyzing the competitive landscape, businesses can make informed decisions to optimize their market positioning and develop effective go-to-market strategies.
- The report offers stakeholders a comprehensive overview of the market, including key drivers, barriers, opportunities, and challenges. This information empowers stakeholders to stay abreast of market trends and make data-driven decisions to capitalize on growth prospects.
ADDITIONAL BENEFITS
- Complimentary PPT Insights Packs
- Complimentary Excel Data Packs for all Analytical Modules in the Report
- 15% Free Content Customization
- Detailed Report Walkthrough Session with Research Team
- Free Updated report if the report is 6-12 months old or older
TABLE OF CONTENTS
1. PREFACE
- 1.1. Scope of the Report
- 1.2. Research Methodology
- 1.2.1. Research Assumptions
- 1.2.2. Project Methodology
- 1.2.3. Forecast Methodology
- 1.2.4. Robust Quality Control
- 1.2.5. Key Considerations
- 1.2.5.1. Demographics
- 1.2.5.2. Economic Factors
- 1.2.5.3. Government Regulations
- 1.2.5.4. Supply Chain
- 1.2.5.5. COVID Impact / Related Factors
- 1.2.5.6. Market Access
- 1.2.5.7. Healthcare Policies
- 1.2.5.8. Industry Consolidation
- 1.3 Key Questions Answered
- 1.4. Chapter Outlines
2. EXECUTIVE SUMMARY
3. INTRODUCTION
- 3.1. Chapter Overview
- 3.2. Introduction to Combination Products
- 3.3. Challenges Associated with Development of Combination Products
- 3.4. Outsourced Combination Products Operations / Services
- 3.5. Advantages of Outsourcing Operations for Combination Products
- 3.6. Key Considerations while Selecting a CDMO
- 3.7. Future Perspectives
4. COMBINATION PRODUCTS SERVICE PROVIDERS: MARKET LANDSCAPE
- 4.1. Chapter Overview
- 4.2. Combination Products Service Providers: Overall Market Landscape
- 4.2.1. Analysis by Year of Establishment
- 4.2.2. Analysis by Company Size
- 4.2.3. Analysis by Location of Headquarters
- 4.2.4. Analysis by Type of Combination Product
- 4.2.5. Analysis by Type of Device
- 4.2.6. Analysis by Service Focus Area(s)
- 4.2.7. Analysis by Type of Service(s) Offered
- 4.2.8. Analysis by Location of Facility
- 4.2.9. Leading Combination Products Service Providers: Analysis by Number of Service(s) Offered
- 4.2.10. 4D Bubble Representation: Analysis by Company Size, Location of Headquarters (Region), Number of Service Focus Area(s) and Number of Service(s) Offered
- 4.2.11. Mekko Representation: Analysis by Company Size and Number of Service Focus Area(s)
5. COMPANY COMPETITIVENESS ANALYSIS
- 5.1. Chapter Overview
- 5.2. Assumptions / Key Parameters
- 5.3. Methodology
- 5.4. Combination Products Service Providers: Company Competitiveness Analysis
- 5.4.1. Combination Products Service Providers based in North America
- 5.4.2. Combination Products Service Providers based in Europe and Asia
6. COMBINATION PRODUCTS SERVICE PROVIDERS: COMPANY PROFILES
- 6.1. Chapter Overview
- 6.2. EKG LABS
- 6.2.1. Company Overview
- 6.2.2. Recent Developments and Future Outlook
- 6.3. Eurofins Medical Device Testing
- 6.3.1. Company Overview
- 6.3.2. Recent Developments and Future Outlook
- 6.4. Exponent
- 6.4.1. Company Overview
- 6.4.2. Recent Developments and Future Outlook
- 6.5. Kymanox
- 6.5.1. Company Overview
- 6.5.2. Recent Developments and Future Outlook
- 6.6. Medical Engineering Technologies
- 6.6.1. Company Overview
- 6.6.2. Recent Developments and Future Outlook
- 6.7. Pace Analytical Services
- 6.7.1. Company Overview
- 6.7.2. Recent Developments and Future Outlook
- 6.8. Suttons Creek
- 6.8.1. Company Overview
- 6.8.2. Recent Developments and Future Outlook
- 6.9. West Pharmaceutical Services
- 6.9.1. Company Overview
- 6.9.2. Recent Developments and Future Outlook
- 6.10. Concluding Remarks: Initiatives Undertaken by Industry Players
7. RECENT EXPANSIONS
- 7.1. Chapter Overview
- 7.2. Combination Products Service Providers: List of Recent Expansions
- 7.2.1. Analysis by Year of Expansion
- 7.2.2. Analysis by Type of Expansion
- 7.2.3. Analysis by Location of Expanded Facility
- 7.2.4. Analysis by Type of Expansion (Country-wise)
- 7.2.5. Most Active Players: Analysis by Number of Expansions
- 7.2.6. Geographical Analysis
8. CASE STUDY: LARGE VOLUME WEARABLE INJECTORS AND PREFILLED SYRINGES COMBINATION PRODUCTS
- 8.1. Chapter Overview
- 8.2. Large Volume Wearable Injector Combination Products
- 8.2.1. Large Volume Drug Device Combination Products: Market Landscape
- 8.2.1.1. Analysis by Phase of Development
- 8.2.1.2. Analysis by Type of Device
- 8.2.1.3. Analysis by Drug Compatibility
- 8.2.1.4. Analysis by Type of Dosage
- 8.2.1.5. Analysis by Route of Administration
- 8.2.1.6. Analysis by Method of Administration
- 8.2.1.7. Analysis by Therapeutic Area
- 8.2.1.8. Analysis by Storage Volume / Capacity
- 8.2.1.9. Analysis by Usability
- 8.2.1.10. Analysis by Technology Used
- 8.2.1.11. Analysis by Mechanism of Action
- 8.2.1.12. Analysis by Type of Drug Container
- 8.2.2. Large Volume Drug Device Combination Products: Developer Landscape
- 8.2.2.1. Analysis by Year of Establishment
- 8.2.2.2. Analysis by Company Size
- 8.2.2.3. Analysis by Location of Headquarters
- 8.2.2.4. Most Active Players: Analysis by Number of Products Manufactured
- 8.2.1. Large Volume Drug Device Combination Products: Market Landscape
- 8.3. Prefilled Syringes Combination Products
- 8.3.1. Prefilled Syringe Combination Products: List of Approved Drugs
- 8.3.1.1. Analysis by Type of Drug Molecule
- 8.3.1.2. Analysis by Approval Year
- 8.3.1.3. Analysis by Geography
- 8.3.1.4. Analysis by Route of Administration
- 8.3.1.5. Analysis by Therapeutic Area
- 8.3.1.6. Analysis by Dosage Strength
- 8.3.1.7. Analysis by Other Approved Dosage Forms
- 8.3.2. Prefilled Syringe Combination Products: List of Clinical Stage Drugs
- 8.3.2.1. Analysis by Type of Drug Molecule
- 8.3.2.2. Analysis by Phase of Development
- 8.3.2.3. Analysis by Route of Administration
- 8.3.2.4. Analysis by Therapeutic Area
- 8.3.3. Prefilled Syringes Combination Products: Information on Developers
- 8.3.3.1. Analysis by Year of Establishment
- 8.3.3.2. Analysis by Company Size
- 8.3.3.3. Analysis by Location of Headquarters
- 8.3.1. Prefilled Syringe Combination Products: List of Approved Drugs
9. LIKELY PARTNER ANALYSIS
- 9.1. Chapter Overview
- 9.2. Large Volume Wearable Injectors Combination Products
- 9.2.1. Scoring Criteria and Key Assumptions
- 9.2.2. Scope and Methodology
- 9.2.3. Potential Strategic Partners
- 9.2.3.1. Most Likely Partners
- 9.2.3.2. Likely Partners
- 9.2.3.3. Less Likely Partners
- 9.3. Prefilled Syringes Combination Products
- 9.3.1. Scoring Criteria and Key Assumptions
- 9.3.2. Scope and Methodology
- 9.3.3. Potential Strategic Partners
- 9.3.3.1. Most Likely Partners
- 9.3.3.2. Likely Partners
- 9.3.3.3. Less Likely Partners
10. OUTSOURCING: GO / NO-GO FRAMEWORK
- 10.1. Chapter Overview
- 10.2. Outsourcing: Go / No-Go Framework
- 10.3. Prefilled Syringes Combination Products Developers: Go / No-Go Framework
- 10.3.1. Assumptions and Key Parameters
- 10.3.2. Methodology
- 10.3.3. Results and Interpretations
- 10.3.3.1. Outsourcing: Go / No-Go Framework for Very Small and Small Companies
- 10.3.3.2. Outsourcing: Go / No-Go Framework for Mid-sized Companies
- 10.3.3.3. Outsourcing: Go / No-Go Framework for Large Companies
11. MARKET FORECAST
- 11.1. Chapter Overview
- 11.2. Key Assumptions and Forecast Methodology
- 11.3. Global Combination Products Service Providers Market, Till 2035
- 11.3.1. Global Combination Products Service Providers Market: Distribution by Type of Device
- 11.3.1.1. Combination Products Service Providers Market for Large Volume Wearable Injectors
- 11.3.1.2. Combination Products Service Providers Market for Autoinjector Combination Products
- 11.3.1.3. Combination Products Service Providers Market for Prefilled Syringe
- 11.3.1.4. Combination Products Service Providers Market for Other Types of Combination Products
- 11.3.2. Global Combination Products Service Providers Market: Distribution by Service Focus Area
- 11.3.2.1. Combination Products Service Providers Market for Particle Testing
- 11.3.2.2. Combination Products Service Providers Market for Performance Testing
- 11.3.2.3. Combination Products Service Providers Market for Product Development
- 11.3.3. Global Combination Products Service Providers Market: Distribution by Company Size
- 11.3.3.1. Combination Products Service Providers Market for Very Small Companies
- 11.3.3.2. Combination Products Service Providers Market for Small Companies
- 11.3.3.3. Combination Products Service Providers Market for Mid-sized Companies
- 11.3.3.4. Combination Products Service Providers Market for Large Companies
- 11.3.3.5. Combination Products Service Providers Market for Very Large Companies
- 11.3.4 Combination Products Service Providers Market: Distribution by Region
- 11.3.4.1. Combination Products Service Providers Market in North America, Till 2035
- 11.3.4.2. Combination Products Service Providers Market in Europe, Till 2035
- 11.3.4.3. Combination Products Service Providers Market in Asia, Till 2035
- 11.3.4.4. Combination Products Service Providers in Rest of the World, Till 2035
- 11.3.1. Global Combination Products Service Providers Market: Distribution by Type of Device
12. CONCLUDING REMARKS
13. EXECUTIVE INSIGHTS
14. APPENDIX 1: TABULATED DATA
15. APPENDIX 2: LIST OF COMPANIES AND ORGANIZATIONS
List of Tables
- Table 4.1 Combination Products Service Providers: Information on Year of Establishment, Company Size and Location of Headquarters
- Table 4.2 Combination Products Service Providers: Information on Type of Combination Product
- Table 4.3 Combination Products Service Providers: Information on Type of Device
- Table 4.4 Combination Products Service Providers: Information on Service Focus Area(s)
- Table 4.5 Combination Products Service Providers: Information on Type of Service(s) Offered
- Table 4.6 Combination Products Service Providers: Information on Location of Facility(s)
- Table 6.1 Combination Products Service Providers: List of Companies Profiled
- Table 6.2 EKG LABS: Company Overview
- Table 6.3 Eurofins Medical Device Testing: Company Overview
- Table 6.4 Eurofins Medical Device Testing: Recent Developments and Future Outlook
- Table 6.5 Exponent: Company Overview
- Table 6.6 Exponent: Recent Developments and Future Outlook
- Table 6.7 Kymanox: Company Overview
- Table 6.8 Kymanox: Recent Developments and Future Outlook
- Table 6.9 Medical Engineering Technologies: Company Overview
- Table 6.10 Medical Engineering Technologies: Recent Developments and Future Outlook
- Table 6.11 Pace Analytical Services: Company Overview
- Table 6.12 Pace Analytical Services: Recent Developments and Future Outlook
- Table 6.13 Suttons Creek: Company Overview
- Table 6.14 Suttons Creek: Recent Developments and Future Outlook
- Table 6.15 West Pharmaceutical Services: Company Overview
- Table 6.16 West Pharmaceutical Services: Recent Developments and Future Outlook
- Table 7.1 Combination Products Service Providers: List of Expansions, Since 2017
- Table 8.1 Large Volume Drug Device Combinations: Information on Phase of Development and Device Features
- Table 8.2 Large Volume Drug Device Combinations: Information on Drug Administration Related Parameters
- Table 8.3 Large Volume Wearable Injectors for Drug Device Combinations: Information on Developers
- Table 8.4 Prefilled Syringes Combination Products: List of Approved Drugs, Since 2013
- Table 8.5 Prefilled Syringes Combination Products: Information on Approval Year, Since 2013
- Table 8.6 Prefilled Syringes Combination Products: Information on Target Indication(s) and Dosage Strength
- Table 8.7 Prefilled Syringes Combination Products: List of Other Drug Delivery Solutions, Since 2013
- Table 8.8 Prefilled Syringes Combination Products: List of Clinical Stage Drugs
- Table 8.9 Prefilled Syringes Combination Products: List of Developers
- Table 9.1 Most Likely Partners
- Table 9.2 Likely Partners
- Table 9.3 Least Likely Partners
- Table 14.1 Combination Products Service Providers: Cumulative Distribution by Year of Establishment
- Table 14.2 Combination Products Service Providers: Distribution by Company Size
- Table 14.3 Combination Products Service Providers: Distribution by Location of Headquarters
- Table 14.4 Combination Products Service Providers: Distribution by Company Size and Location of Headquarters
- Table 14.5 Combination Products Service Providers: Distribution by Type of Combination Product
- Table 14.6 Combination Products Service Providers: Distribution by Company Size and Type of Combination Product
- Table 14.7 Combination Products Service Providers: Distribution by Type of Device
- Table 14.8 Combination Product Service Providers: Distribution by Service Focus Area(s)
- Table 14.9 Combination Product Service Providers: Distribution by Type of Service(s) Offered
- Table 14.10 Combination Product Service Providers: Distribution by Location of Facility (Region-wise)
- Table 14.11 Combination Product Service Providers: Distribution by Location of Facility (Country-wise)
- Table 14.12 Leading Combination Product Service Providers: Distribution by Number of Key Service(s) Offered
- Table 14.13 4D Bubble Analysis: Distribution by Company Size, Company Headquarters (Region), Number of Service Focus Area(s) and Number of
- Table 14.14 Mekko Representation: Distribution by Company Size and Service Focus Area(s)
- Table 14.15 Recent Expansions: Cumulative Year-wise Trend, Since 2017
- Table 14.16 Recent Expansions: Distribution by Type of Expansion
- Table 14.17 Recent Expansions: Distribution by Year of Expansion and Type of Expansion
- Table 14.18 Recent Expansions: Distribution by Location of Expanded Facility
- Table 14.19 Recent Expansions: Distribution by Type of Expansion and Location of Expanded Facility
- Table 14.20 Recent Expansions: Distribution by Type of Expansion (Country-wise)
- Table 14.21 Recent Expansions: Distribution by Location of Expanded Facility and Type of Expansion (Country-wise)
- Table 14.22 Most Active Players: Distribution by Number of Recent Expansions
- Table 14.23 Large Volume Drug Device Combinations: Distribution by Phase of Development
- Table 14.24 Large Volume Drug Device Combinations: Distribution by Type of Device
- Table 14.25 Large Volume Drug Device Combinations: Distribution by Mechanism of Action
- Table 14.26 Large Volume Drug Device Combinations: Distribution by Type of Technology Used
- Table 14.27 Large Volume Drug Device Combinations: Distribution by Route of Administration
- Table 14.28 Large Volume Drug Device Combinations: Distribution by Method of Administration
- Table 14.29 Large Volume Drug Device Combinations: Distribution by Therapeutic Area
- Table 14.30 Large Volume Drug Device Combinations: Distribution by Type of Dosage
- Table 14.31 Large Volume Drug Device Combinations: Distribution by Storage Volume / Capacity (in mL)
- Table 14.32 Large Volume Drug Device Combinations: Distribution by Usability
- Table 14.33 Large Volume Drug Device Combinations: Distribution by Drug Compatibility
- Table 14.34 Large Volume Drug Device Combinations: Distribution by Drug Container
- Table 14.35 Large Volume Wearable Injectors for Drug Device Combinations: Distribution of Developers by Year of Establishment
- Table 14.36 Large Volume Wearable Injectors for Drug Device Combinations: Distribution of Developers by Company Size
- Table 14.37 Large Volume Wearable Injectors for Drug Device Combinations: Distribution of Developers by Location of Headquarters
- Table 14.38 Leading Players: Distribution by Number of Products
- Table 14.39 Approved Prefilled Syringes Combination Products: Distribution by Type of Drug Molecule
- Table 14.40 Approved Prefilled Syringes Combination Products: Distribution by Approval Year
- Table 14.41 Approved Prefilled Syringe Combination Products: Distribution by Geography
- Table 14.42 Approved Prefilled Syringe Combination Products: Distribution by Route of Administration
- Table 14.43 Approved Prefilled Syringe Combination Products: Distribution by Therapeutic Area
- Table 14.44 Approved Prefilled Syringe Combination Products: Distribution by Other Dosage Forms
- Table 14.45 Clinical Stage Prefilled Syringes Combination Products: Distribution by Type of Drug Molecule
- Table 14.46 Clinical Stage Prefilled Syringes Combination Products: Distribution by Phase of Development
- Table 14.47 Clinical Stage Prefilled Syringes Combination Products: Distribution by Route of Administration
- Table 14.48 Clinical Stage Prefilled Syringes Combination Products: Distribution by Therapeutic Area
- Table 14.49 Prefilled Syringe Combination Product Developers: Distribution by Year of Establishment
- Table 14.50 Prefilled Syringe Combination Product Developers: Distribution by Company Size
- Table 14.51 Prefilled Syringe Combination Product Developers: Distribution by Location of Headquarters
- Table 14.52 Global Combination Products Service Providers Market, Till 2035 (USD Million), Conservative, Base and Optimistic Scenarios
- Table 14.53 Global Combination Products Service Providers Market: Distribution by Type of Device
- Table 14.54 Combination Products Service Providers Market for Large Volume Wearable Injectors, Till 2035 (USD Million), Conservative, Base and Optimistic Scenarios
- Table 14.55 Combination Products Service Providers Market for Autoinjectors, Till 2035 (USD Million), Conservative, Base and Optimistic Scenarios
- Table 14.56 Combination Products Service Providers Market for Prefilled Syringes, Till 2035 (USD Million), Conservative, Base and Optimistic Scenarios
- Table 14.57 Combination Products Service Providers Market for Other Types of Combination Products, Till 2035 (USD Million), Conservative, Base and Optimistic Scenarios
- Table 14.58 Global Combination Products Service Providers Market: Distribution by Service Focus Area
- Table 14.59 Combination Products Service Providers Market for Particle Testing, Till 2035 (USD Million), Conservative, Base and Optimistic Scenarios
- Table 14.60 Combination Products Service Providers Market for Performance Testing Till, 2035 (USD Million), Conservative, Base and Optimistic Scenarios
- Table 14.61 Combination Products Service Providers Market for Product Development, Till 2035 (USD Million), Conservative, Base and
- Table 14.62 Global Combination Products Service Providers Market: Distribution by Company Size
- Table 14.63 Combination Products Service Providers Market for Very Small Companies, Till 2035 (USD Million), Conservative, Base and
- Table 14.64 Combination Products Service Providers Market for Small Companies, Till 2035 (USD Million), Conservative, Base and Optimistic Scenarios
- Table 14.65 Combination Products Service Providers Market for Mid-sized Companies, Till 2035 (USD Million), Conservative, Base and Optimistic
- Table 14.66 Combination Products Service Providers Market for Large Companies, Till 2035 (USD Million), Conservative, Base and Optimistic Scenarios
- Table 14.67 Combination Products Service Providers Market for Very Large Companies, Till 2035 (USD Million), Conservative, Base and Optimistic
- Table 14.68 Global Combination Products Service Providers Market: Distribution by Region
- Table 14.69 Combination Products Service Providers Market in North America, Till 2035 (USD Million), Conservative, Base and Optimistic Scenarios
- Table 14.70 Combination Products Service Providers Market in Europe, Till 2035 (USD Million), Conservative, Base and Optimistic Scenarios
- Table 14.71 Combination Products Service Providers Market in Asia, Till 2035 (USD Million), Conservative, Base and Optimistic Scenarios
- Table 14.72 Combination Products Service Providers Market in Rest of the World, Till 2035 (USD Million), Conservative, Base and Optimistic Scenarios
List of Figures
- Figure 2.1 Executive Summary: Combination Products Service Providers Market Landscape
- Figure 2.2 Executive Summary: Recent Expansions
- Figure 2.3 Executive Summary: Case Study on Large Volume Wearable Injectors and Prefilled Syringes Combination Products
- Figure 2.4 Executive Summary: Market Forecast
- Figure 3.1 Types of Combination Products
- Figure 3.2 Recently Approved Combination Products
- Figure 3.3 Challenges Associated with Development of Combination Products
- Figure 3.4 Key Outsourced Combination Product Operations / Services
- Figure 4.1 Combination Products Service Providers: Distribution by Year of Establishment
- Figure 4.2 Combination Products Service Providers: Distribution by Company Size
- Figure 4.3 Combination Products Service Providers: Distribution by Location of Headquarters
- Figure 4.4 Combination Products Service Providers: Distribution by Company Size and Location of Headquarters
- Figure 4.5 Combination Products Service Providers: Distribution by Type of Combination Product
- Figure 4.6 Combination Products Service Providers: Distribution by Company Size and Type of Combination Product
- Figure 4.7 Combination Products Service Providers: Distribution by Type of Device
- Figure 4.8 Combination Product Service Providers: Distribution by Service Focus Area(s)
- Figure 4.9 Combination Product Service Providers: Distribution by Type of Service(s) Offered
- Figure 4.10 Combination Product Service Providers: Distribution by Location of Facility (Region-wise)
- Figure 4.11 Combination Product Service Providers: Distribution by Location of Facility (Country-wise)
- Figure 4.12 Leading Combination Products Service Providers: Distribution by Number of Service(s) Offered
- Figure 4.13 4D Bubble Representation: Distribution by Company Size, Location of Headquarters (Region), Number of Service Focus Area(s) and Number of Service(s) Offered
- Figure 4.14 Mekko Representation: Distribution by Company Size and Service Focus Area(s)
- Figure 5.1 Company Competitiveness Analysis: Players based in North America
- Figure 5.2 Company Competitiveness Analysis: Players based in Europe and Asia
- Figure 6.1 Company Profiles: Initiatives Undertaken by Industry Players
- Figure 7.1 Recent Expansions: Cumulative Year-wise Trend, Since 2017
- Figure 7.2 Recent Expansions: Distribution by Type of Expansion
- Figure 7.3 Recent Expansions: Distribution by Year of Expansion and Type of Expansion
- Figure 7.4 Recent Expansions: Distribution by Location of Expanded Facility
- Figure 7.5 Recent Expansions: Distribution by Type of Expansion (Country-wise)
- Figure 7.6 Recent Expansions: Distribution by Location of Expanded Facility and Type of Expansion (Country-wise)
- Figure 7.7 Most Active Players: Distribution by Number of Expansions
- Figure 9.1 Large Volume Drug Device Combination Products: Distribution by Phase of Development
- Figure 9.2 Large Volume Drug Device Combination Products: Distribution by Type of Device
- Figure 9.3 Large Volume Drug Device Combination Products: Distribution by Mechanism of Action
- Figure 9.4 Large Volume Drug Device Combination Products: Distribution by Type of Technology Used
- Figure 9.5 Large Volume Drug Device Combination Products: Distribution by Route of Administration
- Figure 9.6 Large Volume Drug Device Combination Products: Distribution by Method of Administration
- Figure 9.7 Large Volume Drug Device Combination Products: Distribution by Therapeutic Area
- Figure 9.8 Large Volume Drug Device Combination Products: Distribution by Type of Dosage
- Figure 9.9 Large Volume Drug Device Combination Products: Distribution by Storage Volume / Capacity (in mL)
- Figure 9.10 Large Volume Drug Device Combination Products: Distribution by Usability
- Figure 9.11 Large Volume Drug Device Combination Products: Distribution by Drug compatibility
- Figure 9.12 Large Volume Drug Device Combination Products: Distribution by Drug Container
- Figure 9.13 Large Volume Drug Device Combination Products Developers: Distribution by Year of Establishment
- Figure 9.14 Large Volume Drug Device Combination Products Developers: Distribution by Company Size
- Figure 9.15 Large Volume Drug Device Combination Products: Distribution by Location of Headquarters
- Figure 9.16 Most Active Players: Distribution by Number of Products Manufactured
- Figure 9.17 Approved Prefilled Syringes Combination Products: Distribution by Type of Drug Molecule
- Figure 9.18 Approved Prefilled Syringes Combination Products: Distribution by Approval Year
- Figure 9.19 Approved Prefilled Syringes Combination Products: Distribution by Geography
- Figure 9.20 Approved Prefilled Syringes Combination Products: Distribution by Route of Administration
- Figure 9.21 Approved Prefilled Syringes Combination Products: Distribution by Therapeutic Area
- Figure 9.22 Approved Prefilled Syringes Combination Products: Distribution by Other Dosage Forms
- Figure 9.23 Clinical Stage Prefilled Syringes Combination Products: Distribution by Type of Drug Molecule
- Figure 9.24 Clinical Stage Prefilled Syringes Combination Products: Distribution by Phase of Development
- Figure 9.25 Clinical Stage Prefilled Syringes Combination Products: Distribution by Route of Administration
- Figure 9.26 Clinical Stage Prefilled Syringes Combination Products: Distribution by Therapeutic Area
- Figure 9.27 Prefilled Syringes Combination Product Developers: Distribution by Year of Establishment
- Figure 9.28 Prefilled Syringes Combination Product Developers: Distribution by Company Size
- Figure 9.29 Prefilled Syringes Combination Product Developers: Distribution by Location of Headquarters
- Figure 10.1 Outsourcing: Go / No-Go Framework
- Figure 10.2 Outsourcing: Go / No-Go Framework for Prefilled Syringes Combination Product Developers
- Figure 10.3 Prefilled Syringes Combination Products Developers: Benchmarking of Very Small / Small Companies
- Figure 10.4 Prefilled Syringes Combination Products Developers: Benchmarking of Mid-sized Companies
- Figure 10.5 Prefilled Syringes Combination Products Developers: Benchmarking of Large Companies
- Figure 11.1 Global Combination Products Service Providers Market, Till 2035 (USD Million)
- Figure 11.2 Global Combination Products Service Providers Market: Distribution by Type of Device (USD Million)
- Figure 11.3 Combination Products Service Providers Market for Large Volume Wearable Injectors, Till 2035 (USD Million)
- Figure 11.4 Combination Products Service Providers Market for Autoinjector, Till 2035 (USD Million)
- Figure 11.5 Combination Products Service Providers Market for Prefilled Syringes, Till 2035 (USD Million)
- Figure 11.6 Combination Products Service Providers Market for Other Types of Combination Products, Till 2035 (USD Million)
- Figure 11.7 Global Combination Products Service Providers Market: Distribution by Service Focus Area (USD Million)
- Figure 11.8 Combination Products Service Providers Market for Particle Testing, Till 2035 (USD Million)
- Figure 11.9 Combination Products Service Providers Market for Performance Testing, Till 2035 (USD Million)
- Figure 11.10 Combination Products Service Providers Market for Product Development, Till 2035 (USD Million)
- Figure 11.11 Global Combination Products Service Providers Market: Distribution by Company Size (USD Million)
- Figure 11.12 Combination Products Service Providers Market for Very Small Companies, Till 2035 (USD Million)
- Figure 11.13 Combination Products Service Providers Market for Small Companies, Till 2035 (USD Million)
- Figure 11.14 Combination Products Service Providers Market for Mid-sized Companies, Till 2035 (USD Million)
- Figure 11.15 Combination Products Service Providers Market for Large Companies, Till 2035 (USD Million)
- Figure 11.16 Combination Products Service Providers Market for Very Large Companies, Till 2035 (USD Million)
- Figure 11.17 Global Combination Products Service Providers Market: Distribution by Region (USD Million)
- Figure 11.18 Combination Products Service Providers Market in North America, Till 2035 (USD Million)
- Figure 11.19 Combination Products Service Providers Market in Europe, Till 2035 (USD Million)
- Figure 11.20 Combination Products Service Providers Market in Asia, Till 2035 (USD Million)
- Figure 11.21 Combination Products Service Providers Market in Rest of the World, Till 2035 (USD Million)
- Figure 12.1 Conclusion: Combination Products Service Providers Market Landscape
- Figure 12.2 Conclusion: Company Competitiveness Analysis
- Figure 12.3 Conclusion: Recent Expansions
- Figure 12.4 Conclusion: Combination Products Case Study on Large Volume Wearable Injectors and Prefilled Syringes
- Figure 12.5 Conclusion: Likely Partner Analysis
- Figure 12.6 Conclusion: Outsourcing Go / No-Go Framework
- Figure 12.7 Conclusion: Market Forecast

