
PUBLISHER: Roots Analysis | PRODUCT CODE: 1771307

PUBLISHER: Roots Analysis | PRODUCT CODE: 1771307
Automatic Aseptic Sampling Market: Industry Trends and Global Forecasts - Distribution by Type of Monitoring Method, Bioprocessing Method, Working Volume, Scalability and Key Geographical Regions
GLOBAL AUTOMATIC ASEPTIC SAMPLING MARKET: OVERVIEW
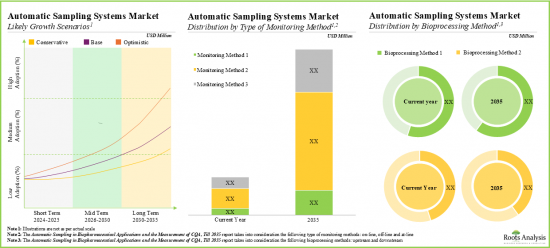
As per Roots Analysis, the global automatic aseptic sampling market is estimated to grow from USD 157 million in the current year to USD 913 million by 2035, at a CAGR of 19.3% during the forecast period, till 2035.
The market sizing and opportunity analysis has been segmented across the following parameters:
Type of Monitoring Method
- Online
- Off-line
- At-line
Bioprocessing Method
- Upstream
- Downstream
Working Volume
- Less than 10 ml
- 10-50 ml
- 51-100 ml
- More than 100 ml
Scalability
- Lab Scale
- Pilot Scale
- Commercial Scale
Key Geographical Regions
- North America
- Europe
- Asia-Pacific
- Rest of the World
GLOBAL AUTOMATIC ASEPTIC SAMPLING MARKET: GROWTH AND TRENDS
Accurate sampling is one of the most crucial processes during the production of pharmaceutical products. The conventional sampling approach or manual sampling techniques pose a risk of contamination and may result in operator-to-operator deviations during sample preparation and sampling. Furthermore, managing real-time data can be challenging for the labor enrolled in operational processes. Consequently, there is an increasing demand for sampling systems that allow accurate handling and aseptic sampling. In this context, an automatic aseptic sampling system emerges as an ideal solution for accurate sampling, minimizing errors, and real-time data monitoring.
Notably, the implementation of automated aseptic sampling systems helps to reduce deviation by around 65% and improve overall productivity by up to 80%. Further, owing to the significance offered by automated sampling systems, several pharmaceutical companies have begun to adopt these systems for seamless, error-free sampling operations. As a result, the automated aseptic sampling market is anticipated to grow during the forecast period driven by its wide-scale adoption.
GLOBAL AUTOMATIC ASEPTIC SAMPLING MARKET: KEY INSIGHTS
The report delves into the current state of global automatic aseptic sampling market and identifies potential growth opportunities within industry. Some key findings from the report include:
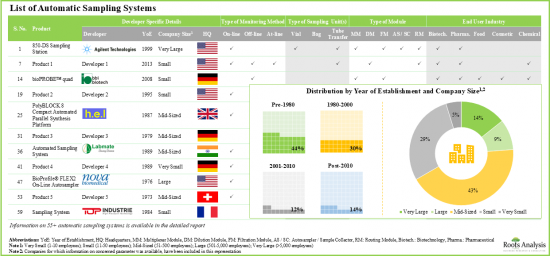
- Presently, more than 55 automatic sampling systems are commercially available in different regions of the globe; a relatively larger proportion of these players are mid-sized companies.
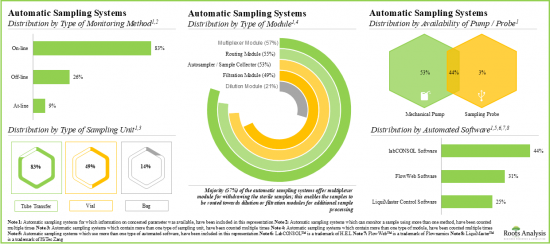
- Majority of the automatic sampling systems (83%) allow on-line real-time monitoring and continuous process control; pharma and biotech companies have emerged as the most prominent end users of these systems.
- More than 80% of the automatic sample collection / preparation system manufacturers were established before 2000; majority of them are based in North America.
- In pursuit of building a competitive edge, stakeholders in this domain are striving to enhance their product portfolio and upgrade their automatic sampling systems with advanced features.
- Over 400 patents related to automatic sampling in biopharmaceutical industry have been filed / granted by various stakeholders in order to protect the intellectual property generated within this field.
- The number of patents filed in this domain has increased at a CAGR of 40% since 2018; close to 30% of the patents have been filed in the last 12 months.
- The growing interest of stakeholders is also reflected by the events organized for automatic sampling systems, providing product developers with the opportunity to share their ideas and develop a better understanding of such systems.
- Over 35% of the partnerships were signed for product distribution purposes; stakeholders based in North America have signed maximum agreements related to automatic sampling.
- The increasing adoption of automatic sampling systems in the biopharmaceutical industry is anticipated to create profitable business opportunities for the system manufacturers.
- Given the requirement of systems that can transfer bioprocess samples directly from bioreactors to analyzers while maintaining the process sterility, the adoption of automatic sampling is anticipated to rise significantly.
- The market is likely to grow at an annualized rate of more than 19.3% by 2035; the opportunity is likely to be well distributed across different geographies, and other important market segments.
GLOBAL AUTOMATIC ASEPTIC SAMPLING MARKET: KEY SEGMENTS
The Online Segment Occupies the Largest Share of the Automatic Aseptic Sampling Market
Based on type of monitoring method, the market is segmented into online, off-line and at-line. At present, the online segment holds the majority share (~60%) of the global automatic aseptic sampling market. Additionally, the at-line segment is likely to grow at a faster pace compared to the other segments.
By Working Volume, 51-100 ml is the Fastest Growing Segment of the Global Automatic Aseptic Sampling Market
Based on the working volume, the market is segmented into less than 10 ml, 10-50 ml, 51-100 ml, and more than 100 ml. Currently, the 10-50 ml segment captures the highest proportion (~40%) of the global automatic aseptic sampling market. It is worth highlighting that the automatic aseptic sampling market for 51-100 ml segment is likely to grow at a relatively higher CAGR.
Upstream Segment Occupy the Largest Share of the Automatic Aseptic Sampling Market
Based on the bioprocessing method, the market is segmented into upstream and downstream. At present, the upstream segment holds the maximum share (~60%) of the automatic aseptic sampling market. In addition, this segment is likely to grow at a relatively higher CAGR.
By Scalability, the Pilot Scale Segment is the Fastest Growing Segment of the Automatic Aseptic Sampling Market During the Forecast Period
Based on the scalability, the market is segmented into lab scale, pilot scale, and commercial scale. Currently, lab scale segment captures the highest proportion (~50%) of the automatic aseptic sampling market. Further, it is worth highlighting that the automatic aseptic sampling market for pilot scale is likely to grow at a relatively higher CAGR.
North America Accounts for the Largest Share of the Market
Based on key geographical regions, the market is segmented into North America, Europe, Asia-Pacific and Rest of the World. Currently, North America (~55%) dominates the automatic aseptic sampling market and accounts for the largest revenue share. However, the market in Asia-Pacific is expected to grow at a higher CAGR.
Example Players in the Automatic Aseptic Sampling Market
- Agilent Technologies
- Biotage
- Cytiva
- Flownamics
- MGI Tech
- Mettler Toledo
- Pall Corporation
- Shimadzu
- SOTAX
GLOBAL AUTOMATIC ASEPTIC SAMPLING MARKET: RESEARCH COVERAGE
- Market Sizing and Opportunity Analysis: The report features an in-depth analysis of the global automated liquid handling systems market, focusing on key market segments, including [A] type of monitoring method, [B] bioprocessing method, [C] working volume, [D] scalability and [E] key geographical regions.
- Automatic Sampling Systems Market Landscape: A comprehensive evaluation of automatic sampling systems, considering various parameters, such as [A] type of monitoring method, [B] type of sampling unit(s), [C] availability of pump / probe, [D] type of module, [E] automated software, [F] type of vessel, [G] vessel fabrication material, [H] type of analyte monitored, [I] type of analyzer, [J] number of sampling vessels, [K] working volume, [L] operating temperature, [M] end-user industry, [N] scalability and [O] applications of the system. Additionally, the module presents comprehensive analysis of automatic sampling system developers, based on [A] year of establishment, [B] company size, [C] location of headquarters and [D] leading players (in terms of number of systems being offered).
- Automatic Sampling System Manufacturers Competitiveness Analysis: A comprehensive competitive analysis of automatic sampling systems manufacturers, examining factors, such as [A] overall experience of the company, [B] product portfolio strength and [C] portfolio diversity.
- Automatic Sampling System Company Profiles: In-depth profiles of companies engaged in the automatic aseptic sampling market, focusing on [A] company overviews, [B] financial information (if available), [C] product portfolio and [D] recent developments and an informed future outlook.
- Automatic Sample Collection / Preparation System Manufacturers Market Landscape: A comprehensive evaluation of automatic sample collection / preparation systems, considering various parameters, such as [A] system category, [B] system classification, [C] type of monitoring method, [D] type of sampling unit, [E] type of module, [F] working volume, [G] type of analyzer, [H] end-user industry and [I] scalability of the products. Additionally, a comprehensive analysis of players engaged in developing automatic sample collection / preparation systems, based on [A] year of establishment, [B] company size and [C] location of headquarters.
- Automatic Sample Collection / Preparation System Company Profiles: In-depth profiles of companies offering automatic sample collection / preparation systems, focusing on [A] company overviews, [B] product portfolio and [C] recent developments and an informed future outlook.
- Patent Analysis: An in-depth analysis of patents filed / granted till date in the automatic sampling systems domain, based on various relevant parameters, such as [A] type of patent, [B] publication year, [C] geographical location, [D] CPC symbols, [E] emerging focus areas, [F] type of organization, [G] leading players (in terms of number of patents granted / filed in the given time period), [H] patent characteristics, [I] patent benchmarking and [J] patent valuation.
- Recent Developments: An in-depth analysis of various developments / recent trends related to automatic sampling systems, providing insights on recent global events related to automatic sampling systems and partnerships and collaborations established within the domain.
- SWOT Analysis: An analysis of industry affiliated trends, opportunities and challenges, which are likely to impact the evolution of automatic sampling systems market; it includes a Harvey ball analysis, assessing the relative impact of each SWOT parameter on industry dynamics.
- PORTER'S Five Forces Analysis: A detailed analysis of the five competitive forces prevalent in automatic sampling systems market, including [A] threats of new entrants, [B] bargaining power of customers, [C] bargaining power of automatic sampling system manufacturers, [C] threats of substitute products and [D] rivalry among existing competitors.
KEY QUESTIONS ANSWERED IN THIS REPORT
- How many companies are currently engaged in this market?
- Which are the leading companies in this market?
- What factors are likely to influence the evolution of this market?
- What is the current and future market size?
- What is the CAGR of this market?
- How is the current and future market opportunity likely to be distributed across key market segments?
REASONS TO BUY THIS REPORT
- The report provides a comprehensive market analysis, offering detailed revenue projections of the overall market and its specific sub-segments. This information is valuable to both established market leaders and emerging entrants.
- Stakeholders can leverage the report to gain a deeper understanding of the competitive dynamics within the market. By analyzing the competitive landscape, businesses can make informed decisions to optimize their market positioning and develop effective go-to-market strategies.
- The report offers stakeholders a comprehensive overview of the market, including key drivers, barriers, opportunities, and challenges. This information empowers stakeholders to stay abreast of market trends and make data-driven decisions to capitalize on growth prospects.
ADDITIONAL BENEFITS
- Complimentary PPT Insights Packs
- Complimentary Excel Data Packs for all Analytical Modules in the Report
- 15% Free Content Customization
- Detailed Report Walkthrough Session with Research Team
- Free Updated report if the report is 6-12 months old or older
TABLE OF CONTENTS
1. PREFACE
- 1.1. Scope of the Report
- 1.2. Research Methodology
- 1.2.1. Research Assumptions
- 1.2.2. Project Methodology
- 1.2.3. Forecast Methodology
- 1.2.4. Robust Quality Control
- 1.2.5. Key Considerations
- 1.2.5.1. Demographics
- 1.2.5.2. Economic Factors
- 1.2.5.3. Government Regulations
- 1.2.5.4. Supply Chain
- 1.2.5.5. COVID Impact / Related Factors
- 1.2.5.6. Market Access
- 1.2.5.7. Healthcare Policies
- 1.2.5.8. Industry Consolidation
- 1.3 Key Questions Answered
- 1.4. Chapter Outlines
2. EXECUTIVE SUMMARY
3. INTRODUCTION
- 3.1. Chapter Overview
- 3.2. Process Analytical Technology in Sampling
- 3.3. Manual Sampling versus Automatic Sampling
- 3.4. Need for Automatic Sampling Systems
- 3.5. Automatic Aseptic Sampling System
- 3.6. Components of a Sampling System
- 3.7. Stand-alone Systems versus Integrated Systems
- 3.8. Bioprocess Monitoring and Control Methods
- 3.8.1. At-line Monitoring
- 3.8.2. In-line Monitoring
- 3.8.3. Off-line Monitoring
- 3.8.4. On-line Monitoring
- 3.9. Key Considerations for Automatic Sampling
- 3.9.1. Sample Volume
- 3.9.2. Cell Removal
- 3.9.3. Sampling Rate
- 3.9.4. Integration of Analyzers
- 3.9.5. Feedback to Bioreactor
- 3.9.6. Flexibility
- 3.9.7. Transferability
- 3.9.8. Price
- 3.10. Benefits of Automatic Sampling Systems
- 3.11. Standards and Requirements
- 3.12. Future Innovations
4. MARKET LANDSCAPE: AUTOMATIC SAMPLING SYSTEMS
- 4.1. Chapter Overview
- 4.2. Automatic Sampling Systems: Overall Market Landscape
- 4.2.1. Analysis by Type of Monitoring Method
- 4.2.2. Analysis by Type of Sampling Unit
- 4.2.3. Analysis by Availability of Pump / Probe
- 4.2.4. Analysis by Type of Module
- 4.2.5. Analysis by Automated Software
- 4.2.6. Analysis by Type of Vessel
- 4.2.7. Analysis by Vessel Fabrication Material
- 4.2.8. Analysis by Type of Analyte Monitored
- 4.2.9. Analysis by Type of Analyzer
- 4.2.10. Analysis by Number of Sampling Vessels
- 4.2.11. Analysis by Working Volume
- 4.2.12. Analysis by Operating Temperature
- 4.2.13. Analysis by End User Industry
- 4.2.14. Analysis by Scalability
- 4.2.15. Analysis by Application(s)
- 4.3. List of Automatic Sampling System Manufacturers
- 4.3.1. Analysis by Year of Establishment
- 4.3.2. Analysis by Company Size
- 4.3.3. Analysis by Region of Headquarters
- 4.3.4. Analysis by Company Size and Region of Headquarters
- 4.3.5. Analysis by Location of Headquarters
- 4.3.6. Leading Players: Analysis by Number of Automatic Sampling Systems Manufactured
- 4.3.7. Leading Automatic Sampling System Manufacturers: Analysis by Number of End User Industries
5. COMPANY COMPETITIVENESS ANALYSIS
- 5.1. Chapter Overview
- 5.2. Assumptions / Key Parameters
- 5.3. Scope and Methodology
- 5.4. Company Competitiveness Analysis: Automatic Sampling System Manufacturers in North America
- 5.5. Company Competitiveness Analysis: Automatic Sampling System Manufacturers in Europe
- 5.6. Company Competitiveness Analysis: Automatic Sampling System Manufacturers in Asia-Pacific
6. COMPANY PROFILES: AUTOMATIC SAMPLING SYSTEM MANUFACTURERS
- 6.1. Chapter Overview
- 6.2. Agilent Technologies
- 6.2.1. Company Overview
- 6.2.2. Financial Information
- 6.2.3. Product Portfolio
- 6.2.4. Recent Developments and Future Outlook
- 6.3. Cytiva
- 6.3.1. Company Overview
- 6.3.2. Product Portfolio
- 6.3.3. Recent Developments and Future Outlook
- 6.4. Mettler Toledo
- 6.4.1. Company Overview
- 6.4.2. Financial Information
- 6.4.3. Product Portfolio
- 6.4.4. Recent Developments and Future Outlook
- 6.5. Pall Corporation
- 6.5.1. Company Overview
- 6.5.2. Product Portfolio
- 6.5.3. Recent Developments and Future Outlook
- 6.6. Shimadzu
- 6.6.1. Company Overview
- 6.6.2. Financial Information
- 6.6.3. Product Portfolio
- 6.6.4. Recent Developments and Future Outlook
- 6.7. Xylem
- 6.7.1. Company Overview
- 6.7.2. Financial Information
- 6.7.3. Product Portfolio
- 6.7.4. Recent Developments and Future Outlook
7. MARKET LANDSCAPE: AUTOMATIC SAMPLE COLLECTION / PREPARATION SYSTEMS
- 7.1. Chapter Overview
- 7.2. Automatic Sample Collection / Preparation Systems: Overall Market Landscape
- 7.2.1. Analysis by System Category
- 7.2.2. Analysis by System Classification
- 7.2.3. Analysis by Type of Monitoring Method
- 7.2.4. Analysis by Type of Sampling Unit
- 7.2.5. Analysis by Type of Module
- 7.2.6. Analysis by Working Volume
- 7.2.7. Analysis by Type of Analyzer
- 7.2.8. Analysis by End User Industry
- 7.2.9. Analysis by Scalability
- 7.3. List of Automatic Sample Collection / Preparation System Manufacturers
- 7.3.1. Analysis by Year of Establishment
- 7.3.2. Analysis by Company Size
- 7.3.3. Analysis by Region of Headquarters
- 7.3.4. Analysis by Company Size and Region of Headquarters
- 7.3.5. Analysis by Location of Headquarters
- 7.3.6. Leading Players: Analysis by Number of Automatic Sample Collection / Preparation Systems Manufactured
8. COMPANY PROFILES: AUTOMATIC SAMPLE COLLECTION / PREPARATION SYSTEM MANUFACTURERS
- 8.1. Chapter Overview
- 8.2. Agilent Technologies
- 8.2.1. Company Overview
- 8.2.2. Product Portfolio
- 8.2.3. Recent Developments and Future Outlook
- 8.3. Biotage
- 8.3.1. Company Overview
- 8.3.2. Product Portfolio
- 8.3.3. Recent Developments and Future Outlook
- 8.4. Flownamics
- 8.4.1. Company Overview
- 8.4.2. Product Portfolio
- 8.4.3. Recent Developments and Future Outlook
- 8.5. MGI Tech
- 8.5.1. Company Overview
- 8.5.2. Product Portfolio
- 8.5.3. Recent Developments and Future Outlook
- 8.6. SOTAX
- 8.6.1. Company Overview
- 8.6.2. Product Portfolio
- 8.6.3. Recent Developments and Future Outlook
9. PATENT ANALYSIS
- 9.1. Chapter Overview
- 9.2. Scope and Methodology
- 9.3. Automatic Sampling in Biopharmaceutical Applications and the Measurement of CQA: Patent Analysis
- 9.3.1. Analysis by Publication Year
- 9.3.2. Analysis by Annual Number of Granted Patents and Patent Applications
- 9.3.3. Analysis by Geographical Location
- 9.3.4. Analysis by CPC Symbols
- 9.3.5. Word Cloud: Emerging Focus Areas
- 9.3.6. Analysis by Type of Organization
- 9.3.7. Leading Industry Players: Analysis by Number of Patents
- 9.3.8. Leading Non-Industry Players: Analysis by Number of Patents
- 9.3.9. Leading Individual Assignees: Analysis by Number of Patents
- 9.4. Automatic Sampling in Biopharmaceutical Applications and the Measurement of CQA: Patent Benchmarking Analysis
- 9.4.1. Analysis by Patent Characteristics
- 9.5. Automatic Sampling in Biopharmaceutical Applications and the Measurement of CQA: Patent Valuation Analysis
- 9.6. Leading Patents by Number of Citations
10. RECENT DEVELOPMENTS
- 10.1. Chapter Overview
- 10.2. Automatic Sampling in Biopharmaceutical Applications and the Measurement of CQA: Partnership Activity
- 10.2.1. Partnership Models
- 10.2.2. List of Partnerships and Collaborations
- 10.2.2.1. Analysis by Year of Partnership
- 10.2.2.2. Analysis by Type of Partnership
- 10.2.2.3. Analysis by Type of Product
- 10.2.2.4. Analysis by Product and Type of Partnership
- 10.2.2.5. Most Active Players: Analysis by Number of Partnerships
- 10.2.2.6. Word Cloud: Emerging Focus Areas
- 10.2.2.7. Regional Analysis
- 10.2.2.8. Intercontinental and Intracontinental Agreements
- 10.3. Automatic Sampling in Biopharmaceutical Applications and the Measurement of CQA: Global Events
- 10.3.1. List of Global Events
- 10.3.1.1. Analysis by Year of Event
- 10.3.1.2. Analysis by Event Platform
- 10.3.1.3. Analysis by Type of Event
- 10.3.1.4. Analysis by Geography
- 10.3.1.5. Word Cloud: Evolutionary Trends in Event Agenda / Key Focus Area
- 10.3.1.6. Most Active Participants: Analysis by Number of Events
- 10.3.1.7. Analysis by Seniority Level of Event Speakers
- 10.3.1. List of Global Events
- 10.4. Concluding Remarks
11. SWOT ANALYSIS
- 11.1. Chapter Overview
- 11.2. Automatic Sampling in Biopharmaceutical Applications and the Measurement of CQA: SWOT Analysis
- 11.2.1. Comparison of SWOT Factors
12. PORTERS FIVE FORCES ANALYSIS
- 12.1. Chapter Overview
- 12.2. Methodology and Assumptions
- 12.3. Key Parameters
- 12.3.1. Threats of New Entrants
- 12.3.2. Bargaining Power of Customers
- 12.3.3. Bargaining Power of Automatic Sampling System Manufacturers
- 12.3.4. Threats of Substitute Products
- 12.3.5. Rivalry Among Existing Competitors
- 12.4. Concluding Remarks
13. MARKET FORECAST AND OPPORTUNITY ANALYSIS
- 13.1. Chapter Overview
- 13.2. Key Assumptions and Methodology
- 13.3. Global Automatic Sampling in Biopharmaceutical Applications and the Measurement of CQA Market, Till 2035
- 13.3.1. Automatic Sampling in Biopharmaceutical Applications and the Measurement of CQA Market: Distribution by Type of Monitoring Method
- 13.3.1.1. Automatic Sampling Market for On-line Monitoring, Till 2035
- 13.3.1.2. Automatic Sampling Market for Off-line Monitoring, Till 2035
- 13.3.1.3. Automatic Sampling Market for At-line Monitoring, Till 2035
- 13.3.2. Automatic Sampling in Biopharmaceutical Applications and the Measurement of CQA Market: Distribution by Type of Bioprocessing Method
- 13.3.2.1. Automatic Sampling Market for Upstream Bioprocessing, Till 2035
- 13.3.2.2. Automatic Sampling Market for Downstream Bioprocessing, Till 2035
- 13.3.3. Automatic Sampling in Biopharmaceutical Applications and the Measurement of CQA Market: Distribution by Working Volume
- 13.3.3.1. Automatic Sampling Market for Systems with less than 10 mL Working Volume, Till 2035
- 13.3.3.2. Automatic Sampling Market for Systems with 10-50 mL Working Volume, Till 2035
- 13.3.3.3. Automatic Sampling Market for Systems with 51-100 mL Working Volume, Till 2035
- 13.3.3.4. Automatic Sampling Market for Systems with more than 100 mL Working Volume, Till 2035
- 13.3.4. Automatic Sampling in Biopharmaceutical Applications and the Measurement of CQA Market: Distribution by Scalability
- 13.3.4.1. Automatic Sampling Market for Lab Scale Operations, Till 2035
- 13.3.4.2. Automatic Sampling Market for Pilot Scale Operations, Till 2035
- 13.3.4.3. Automatic Sampling Market for Commercial Scale Operations, Till 2035
- 13.3.5. Automatic Sampling in Biopharmaceutical Applications and the Measurement of CQA Market: Distribution by Key Geographical Regions
- 13.3.5.1. Automatic Sampling Market in North America, Till 2035
- 13.3.5.2. Automatic Sampling Market in Europe, Till 2035
- 13.3.5.3. Automatic Sampling Market in Asia-Pacific and Rest of the World, Till 2035
- 13.3.1. Automatic Sampling in Biopharmaceutical Applications and the Measurement of CQA Market: Distribution by Type of Monitoring Method
14. INDUSTRIAL REVOLUTION FROM INDUSTRY 1.0 TO INDUSTRY 5.0
- 14.1. Chapter Overview
- 14.2. Transition from Industry 1.0 to Industry 5.0
- 14.2.1. Industry 1.0
- 14.2.2. Industry 2.0
- 14.2.3. Industry 3.0
- 14.2.4. Industry 4.0
- 14.2.5. Industry 5.0
- 14.3. Horizons of Lab Evolution
- 14.4. Benefits of Industry 4.0
- 14.5. Benefits of Industry 5.0
- 14.6. Concluding Remarks
15. CONCLUDING REMARKS
16. EXECUTIVE INSIGHTS
17. APPENDIX 1: TABULATED DATA
18. APPENDIX 2: LIST OF COMPANIES AND ORGANIZATIONS
List of Tables
- Table 4.1 Automatic Sampling Systems: Information on Type of Monitoring Method, Type of Sample Monitored, Type of Sampling Unit(s) and Bioprocessing Method
- Table 4.2 Automatic Sampling Systems: Information on Key Features
- Table 4.3 Automatic Sampling Systems: Information on Usability, Automated Software, Type of Vessel, Vessel Fabrication Material, Type of Analyte Monitored, Certification and Regulatory Compliance
- Table 4.4 Automatic Sampling Systems: Information on Type of Analyzer
- Table 4.5 Automatic Sampling Systems: Information on Product Specifications
- Table 4.6 Automatic Sampling Systems: Information on End User Industry and Scalability
- Table 4.7 Automatic Sampling Systems: Information on Sterilizability and Application(s)
- Table 4.8 List of Automatic Sampling System Manufacturers: Information on Year of Establishment, Employee Count, Company Size, Location and Region of Headquarters
- Table 6.1 Automatic Sampling System Manufacturers: List of Companies Profiled
- Table 6.2 Agilent Technologies: Company Snapshot
- Table 6.3 Agilent Technologies: 850-DS Sampling Station
- Table 6.4 Agilent Technologies: Recent Developments and Future Outlook
- Table 6.5 Cytiva: Company Snapshot
- Table 6.6 Cytiva: ALIAS(TM)
- Table 6.7 Cytiva: Recent Developments and Future Outlook
- Table 6.8 Mettler Toledo: Company Snapshot
- Table 6.9 Mettler Toledo: EasySampler 1210 System
- Table 6.10 Mettler Toledo: Recent Developments and Future Outlook
- Table 6.11 Pall Corporation: Company Snapshot
- Table 6.12 Pall Corporation: Allegro(TM) MVP Single-Use System
- Table 6.13 Pall Corporation: Recent Developments and Future Outlook
- Table 6.14 Shimadzu: Company Snapshot
- Table 6.15 Shimadzu: Perfinity Workstation
- Table 6.16 Shimadzu: Recent Developments and Future Outlook
- Table 6.17 Xylem: Company Snapshot
- Table 6.18 Xylem: YSI 2940/2980
- Table 6.19 Xylem: Recent Developments and Future Outlook
- Table 7.1 Automatic Sample Collection / Preparation Systems: Information on System Category, System Classification and Type of Monitoring Method
- Table 7.2 Automatic Sample Collection / Preparation Systems: Information on Key Features
- Table 7.3 Automatic Sample Collection / Preparation Systems: Information on Product Specifications, Type of Analyzer, Certification and Regulatory Compliance
- Table 7.4 Automatic Sample Collection / Preparation Systems: Information on End User Industry and Scalability
- Table 7.5 List of Automatic Sample Collection / Preparation System Manufacturers: Information on Year of Establishment, Employee Count, Company Size, Location and Region of Headquarters
- Table 8.1 Automatic Sample Collection / Preparation System Manufacturers: List of Companies Profiled
- Table 8.2 Agilent Technologies: Company Snapshot
- Table 8.3 Agilent Technologies: AssayMAP Bravo Protein Sample Prep Platform
- Table 8.4 Agilent Technologies: 7696A Sample Prep Workbench
- Table 8.5 Biotage: Company Snapshot
- Table 8.6 Biotage: Extrahera(TM)
- Table 8.7 Biotage: Extrahera LV-200
- Table 8.8 Biotage: Recent Developments and Future Outlook
- Table 8.9 Flownamics: Company Snapshot
- Table 8.10 Flownamics: Sample-Mod(TM)
- Table 8.11 Flownamics: Seg-Flow(R) Autosampler
- Table 8.12 Flownamics: FlowFraction(TM)
- Table 8.13 Flownamics: Recent Developments and Future Outlook
- Table 8.14 MGI Tech: Company Snapshot
- Table 8.15 MGI Tech: MGISP-960
- Table 8.16 MGI Tech: MGISP-Smart 8
- Table 8.17 MGI Tech: MGISP-100
- Table 8.18 MGI Tech: Recent Developments and Future Outlook
- Table 8.19 SOTAX: Company Snapshot
- Table 8.20 SOTAX: TPW(TM) Automated Sample Preparation Workstation
- Table 8.21 SOTAX: APW(TM) Automated Sample Preparation Workstation
- Table 8.22 SOTAX: CTS Automated Sample Preparation Workstation
- Table 9.1 Patent Analysis: Top 10 CPC Symbol Definitions
- Table 9.2 Patent Analysis: Top Five CPC Symbols
- Table 9.3 Patent Analysis: Top Seven CPC Classification Symbol Definitions
- Table 9.4 Patent Analysis: Summary of Benchmarking Analysis
- Table 9.5 Patent Analysis: Categorization based on Weighted Valuation Scores
- Table 9.6 Patent Portfolio: List of Leading Patents (by Highest Relative Valuation)
- Table 9.7 Patent Portfolio: List of Leading Patents (by Number of Citations)
- Table 10.1 List of Partnerships and Collaborations
- Table 10.2 List of Partnerships and Collaborations: Information on Focus Area and Type of Product
- Table 10.3 List of Global Events related to Automatic Sampling in Biopharmaceutical Applications and the Measurement of CQA
- Table 17.1 Automatic Sampling Systems: Distribution by Type of Monitoring Method
- Table 17.2 Automatic Sampling Systems: Distribution by Type of Sampling Unit
- Table 17.3 Automatic Sampling Systems: Distribution by Availability of Pump / Probe
- Table 17.4 Automatic Sampling Systems: Distribution by Type of Module
- Table 17.5 Automatic Sampling Systems: Distribution by Automated Software
- Table 17.6 Automatic Sampling Systems: Distribution by Type of Vessel
- Table 17.7 Automatic Sampling Systems: Distribution by Vessel Fabrication Material
- Table 17.8 Automatic Sampling Systems: Distribution by Type of Analyte Monitored
- Table 17.9 Automatic Sampling Systems: Distribution by Type of Analyzer
- Table 17.10 Automatic Sampling Systems: Distribution by Number of Sampling Vessels
- Table 17.11 Automatic Sampling Systems: Distribution by Working Volume (mL)
- Table 17.12 Automatic Sampling Systems: Distribution by Operating Temperature (oC)
- Table 17.13 Automatic Sampling Systems: Distribution by End User Industry
- Table 17.14 Automatic Sampling Systems: Distribution by Scalability
- Table 17.15 Automatic Sampling Systems: Distribution by Application(s)
- Table 17.16 Automatic Sampling System Manufacturers: Distribution by Year of Establishment
- Table 17.17 Automatic Sampling System Manufacturers: Distribution by Company Size
- Table 17.18 Automatic Sampling System Manufacturers: Distribution by Region of Headquarters
- Table 17.19 Automatic Sampling System Manufacturers: Distribution by Company Size and Region of Headquarters
- Table 17.20 Automatic Sampling System Manufacturers: Distribution by Location of Headquarters
- Table 17.21 Leading Players: Distribution by Number of Automatic Sampling Systems Manufactured
- Table 17.22 Leading Automatic Sampling System Manufacturers: Distribution by Number of End User Industries
- Table 17.23 Agilent Technologies: Annual Revenues (USD Billion)
- Table 17.24 Mettler Toledo: Annual Revenues (USD Billion)
- Table 17.25 Shimadzu: Annual Revenues (JPY Billion)
- Table 17.26 Xylem: Annual Revenues (USD Billion)
- Table 17.27 Automatic Sample Collection / Preparation Systems: Distribution by System Category
- Table 17.28 Automatic Sample Collection / Preparation Systems: Distribution by System Classification
- Table 17.29 Automatic Sample Collection / Preparation Systems: Distribution by Type of Monitoring Method
- Table 17.30 Automatic Sample Collection / Preparation Systems: Distribution by Type of Sampling Unit
- Table 17.31 Automatic Sample Collection / Preparation Systems: Distribution by Type of Module
- Table 17.32 Automatic Sample Collection / Preparation Systems: Distribution by Working Volume (mL)
- Table 17.33 Automatic Sample Collection / Preparation Systems: Distribution by Type of Analyzer
- Table 17.34 Automatic Sample Collection / Preparation Systems: Distribution by End User Industry
- Table 17.35 Automatic Sample Collection / Preparation Systems: Distribution by Scalability
- Table 17.36 Automatic Sample Collection / Preparation System Manufacturers: Distribution by Year of Establishment
- Table 17.37 Automatic Sample Collection / Preparation System Manufacturers: Distribution by Company Size
- Table 17.38 Automatic Sample Collection / Preparation System Manufacturers: Distribution by Region of Headquarters
- Table 17.39 Automatic Sample Collection / Preparation System Manufacturers: Distribution by Company Size and Region of Headquarters
- Table 17.40 Automatic Sample Collection / Preparation System Manufacturers: Distribution by Location of Headquarters
- Table 17.41 Leading Players: Distribution by Number of Automatic Sample Collection / Preparation Systems Manufactured
- Table 17.42 Patent Analysis: Distribution by Type of Patent
- Table 17.43 Patent Analysis: Cumulative Distribution by Publication Year
- Table 17.44 Patent Analysis: Distribution by Annual Number of Granted Patents and Patent Applications
- Table 17.45 Patent Analysis: Distribution by Geographical Location
- Table 17.46 Patent Analysis: Cumulative Year-wise Distribution by Type of Organization
- Table 17.47 Leading Industry Players: Distribution by Number of Patents
- Table 17.48 Leading Non-Industry Players: Distribution by Number of Patents
- Table 17.49 Leading Individual Assignees: Distribution by Number of Patents
- Table 17.50 Patent Analysis: Year-wise Distribution of Patents by Age
- Table 17.51 Automatic Sampling in Biopharmaceutical Applications and the Measurement of CQA: Patent Valuation Analysis
- Table 17.52 Partnerships and Collaborations: Cumulative Year-wise Trend
- Table 17.53 Partnerships and Collaborations: Distribution by Type of Partnership
- Table 17.54 Partnerships and Collaborations: Distribution by Year and Type of Partnership
- Table 17.55 Partnerships and Collaborations: Distribution by Type of Product
- Table 17.56 Most Active Players: Distribution by Number of Partnerships
- Table 17.57 Partnerships and Collaborations: Regional Distribution
- Table 17.58 Partnerships and Collaborations: Intercontinental and Intracontinental Agreements
- Table 17.59 Global Events: Cumulative Year-wise Trend
- Table 17.60 Global Events: Distribution by Event Platform
- Table 17.61 Global Events: Distribution by Type of Event
- Table 17.62 Global Events: Regional Distribution of Events
- Table 17.63 Most Active Industry Participants: Distribution by Number of Events
- Table 17.64 Global Events: Distribution by Seniority Level of Event Speakers
- Table 17.65 Global Events: Distribution by Affiliated Department of Event Speakers
- Table 17.66 Global Automatic Sampling in Biopharmaceutical Applications and the Measurement of CQA Market, Till 2035: Conservative, Base and Optimistic Scenarios (USD Million)
- Table 17.67 Automatic Sampling in Biopharmaceutical Applications and the Measurement of CQA Market: Distribution by Type of Monitoring Method
- Table 17.68 Automatic Sampling Market for On-line Monitoring, Till 2035: Conservative, Base and Optimistic Scenarios (USD Million)
- Table 17.69 Automatic Sampling Market for Off-line Monitoring, Till 2035: Conservative, Base and Optimistic Scenarios (USD Million)
- Table 17.70 Automatic Sampling Market for At-line Monitoring, Till 2035: Conservative, Base and Optimistic Scenarios (USD Million)
- Table 17.71 Automatic Sampling in Biopharmaceutical Applications and the Measurement of CQA Market: Distribution by Type of Bioprocessing Method
- Table 17.72 Automatic Sampling Market for Upstream Bioprocessing, Till 2035: Conservative, Base and Optimistic Scenarios (USD Million)
- Table 17.73 Automatic Sampling Market for Downstream Bioprocessing, Till 2035: Conservative, Base and Optimistic Scenarios (USD Million)
- Table 17.74 Automatic Sampling in Biopharmaceutical Applications and the Measurement of CQA Market: Distribution by Working Volume
- Table 17.75 Automatic Sampling Market for Systems with less than 10 mL Working Volume, Till 2035: Conservative, Base and Optimistic Scenarios (USD Million)
- Table 17.76 Automatic Sampling Market for Systems with 10-50 mL Working Volume, Till 2035: Conservative, Base and Optimistic Scenarios (USD Million)
- Table 17.77 Automatic Sampling Market for Systems with 51-100 mL Working Volume, Till 2035: Conservative, Base and Optimistic Scenarios (USD Million)
- Table 17.78 Automatic Sampling Market for Systems with more than 100 mL Working Volume, Till 2035: Conservative, Base and Optimistic Scenarios (USD Million)
- Table 17.79 Automatic Sampling in Biopharmaceutical Applications and the Measurement of CQA Market: Distribution by Scalability
- Table 17.80 Automatic Sampling Market for Lab Scale Operations, Till 2035: Conservative, Base and Optimistic Scenarios (USD Million)
- Table 17.81 Automatic Sampling Market for Pilot Scale Operations, Till 2035: Conservative, Base and Optimistic Scenarios (USD Million)
- Table 17.82 Automatic Sampling Market for Commercial Scale Operations, Till 2035: Conservative, Base and Optimistic Scenarios (USD Million)
- Table 17.83 Automatic Sampling in Biopharmaceutical Applications and the Measurement of CQA Market: Distribution by Key Geographical Regions
- Table 17.84 Automatic Sampling Market in North America, Till 2035: Conservative, Base and Optimistic Scenarios (USD Million)
- Table 17.85 Automatic Sampling Market in Europe, Till 2035: Conservative, Base and Optimistic Scenarios (USD Million)
- Table 17.86 Automatic Sampling Market in Asia-Pacific and Rest of the World, Till 2035: Conservative, Base and Optimistic Scenarios (USD Million)
List of Figures
- Figure 2.1 Executive Summary: Automatic Sampling Systems Market Landscape
- Figure 2.2 Executive Summary: Automatic Sample Collection / Preparation Systems Market Landscape
- Figure 2.3 Executive Summary: Patent Analysis
- Figure 2.4 Executive Summary: Recent Developments
- Figure 2.5 Executive Summary: Market Forecast and Opportunity Analysis
- Figure 3.1 Manual Sampling versus Automatic Sampling
- Figure 3.2 Automatic Aseptic Sampling System
- Figure 3.3 Bioprocess Monitoring and Control Methods
- Figure 3.4 Key Considerations for Automatic Sampling
- Figure 3.5 Benefits of Automatic Sampling Systems
- Figure 4.1 Automatic Sampling Systems: Distribution by Type of Monitoring Method
- Figure 4.2 Automatic Sampling Systems: Distribution by Type of Sampling Unit
- Figure 4.3 Automatic Sampling Systems: Distribution by Availability of Pump / Probe
- Figure 4.4 Automatic Sampling Systems: Distribution by Type of Module
- Figure 4.5 Automatic Sampling Systems: Distribution by Automated Software
- Figure 4.6 Automatic Sampling Systems: Distribution by Type of Vessel
- Figure 4.7 Automatic Sampling Systems: Distribution by Vessel Fabrication Material
- Figure 4.8 Automatic Sampling Systems: Distribution by Type of Analyte Monitored
- Figure 4.9 Automatic Sampling Systems: Distribution by Type of Analyzer
- Figure 4.10 Automatic Sampling Systems: Distribution by Number of Sampling Vessels
- Figure 4.11 Automatic Sampling Systems: Distribution by Working Volume (mL)
- Figure 4.12 Automatic Sampling Systems: Distribution by Operating Temperature (oC)
- Figure 4.13 Automatic Sampling Systems: Distribution by End User Industry
- Figure 4.14 Automatic Sampling Systems: Distribution by Scalability
- Figure 4.15 Automatic Sampling Systems: Distribution by Application(s)
- Figure 4.16 Automatic Sampling System Manufacturers: Distribution by Year of Establishment
- Figure 4.17 Automatic Sampling System Manufacturers: Distribution by Company Size
- Figure 4.18 Automatic Sampling System Manufacturers: Distribution by Region of Headquarters
- Figure 4.19 Automatic Sampling System Manufacturers: Distribution by Company Size and Region of Headquarters
- Figure 4.20 Automatic Sampling System Manufacturers: Distribution by Location of Headquarters
- Figure 4.21 Leading Players: Distribution by Number of Automatic Sampling Systems Manufactured
- Figure 4.22 Leading Automatic Sampling System Manufacturers: Distribution by Number of End User Industries
- Figure 5.1 Company Competitiveness Analysis: Automatic Sampling System Manufacturers in North America
- Figure 5.2 Company Competitiveness Analysis: Automatic Sampling System Manufacturers in Europe
- Figure 5.3 Company Competitiveness Analysis: Automatic Sampling System Manufacturers in Asia-Pacific
- Figure 6.1 Agilent Technologies: Annual Revenues (USD Billion)
- Figure 6.2 Mettler Toledo: Annual Revenues (USD Billion)
- Figure 6.3 Shimadzu: Annual Revenues (JPY Billion)
- Figure 6.4 Xylem: Annual Revenues (USD Billion)
- Figure 7.1 Automatic Sample Collection / Preparation Systems: Distribution by System Category
- Figure 7.2 Automatic Sample Collection / Preparation Systems: Distribution by System Classification
- Figure 7.3 Automatic Sample Collection / Preparation Systems: Distribution by Type of Monitoring Method
- Figure 7.4 Automatic Sample Collection / Preparation Systems: Distribution by Type of Sampling Unit
- Figure 7.5 Automatic Sample Collection / Preparation Systems: Distribution by Type of Module
- Figure 7.6 Automatic Sample Collection / Preparation Systems: Distribution by Working Volume (mL)
- Figure 7.7 Automatic Sample Collection / Preparation Systems: Distribution by Type of Analyzer
- Figure 7.8 Automatic Sample Collection / Preparation Systems: Distribution by End User Industry
- Figure 7.9 Automatic Sample Collection / Preparation Systems: Distribution by Scalability
- Figure 7.10 Automatic Sample Collection / Preparation System Manufacturers: Distribution by Year of Establishment
- Figure 7.11 Automatic Sample Collection / Preparation System Manufacturers: Distribution by Company Size
- Figure 7.12 Automatic Sample Collection / Preparation System Manufacturers: Distribution by Region of Headquarters
- Figure 7.13 Automatic Sample Collection / Preparation System Manufacturers: Distribution by Company Size and Region of Headquarters
- Figure 7.14 Automatic Sample Collection / Preparation System Manufacturers: Distribution by Location of Headquarters
- Figure 7.15 Leading Players: Distribution by Number of Automatic Sample Collection / Preparation Systems Manufactured
- Figure 9.1 Patent Analysis: Distribution by Type of Patent
- Figure 9.2 Patent Analysis: Cumulative Distribution by Publication Year
- Figure 9.3 Patent Analysis: Distribution by Annual Number of Granted Patents and Patent Applications
- Figure 9.4 Patent Analysis: Distribution by Geographical Location
- Figure 9.5 Patent Analysis: Distribution by CPC Symbols
- Figure 9.6 Word Cloud: Emerging Focus Areas
- Figure 9.7 Patent Analysis: Cumulative Year-wise Distribution by Type of Organization
- Figure 9.8 Leading Industry Players: Distribution by Number of Patents
- Figure 9.9 Leading Non-Industry Players: Distribution by Number of Patents
- Figure 9.10 Leading Individual Assignees: Distribution by Number of Patents
- Figure 9.11 Leading Players: Benchmarking by Patent Characteristics (CPC Symbols)
- Figure 9.12 Patent Analysis: Year-wise Distribution of Patents by Age
- Figure 9.13 Automatic Sampling in Biopharmaceutical Applications and the Measurement of CQA: Patent Valuation Analysis
- Figure 10.1 Partnerships and Collaborations: Cumulative Year-wise Trend
- Figure 10.2 Partnerships and Collaborations: Distribution by Type of Partnership
- Figure 10.3 Partnerships and Collaborations: Distribution by Year and Type of Partnership
- Figure 10.4 Partnerships and Collaborations: Distribution by Type of Product
- Figure 10.5 Partnerships and Collaborations: Distribution by Product and Type of Partnership
- Figure 10.6 Most Active Players: Distribution by Number of Partnerships
- Figure 10.7 Word Cloud: Emerging Focus Areas
- Figure 10.8 Partnerships and Collaborations: Regional Distribution
- Figure 10.9 Partnerships and Collaborations: Intercontinental and Intracontinental Agreements
- Figure 10.10 Global Events: Cumulative Year-wise Trend
- Figure 10.11 Global Events: Distribution by Event Platform
- Figure 10.12 Global Events: Distribution by Type of Event
- Figure 10.13 Global Events: Regional Distribution of Events
- Figure 10.14 Word Cloud: Evolutionary Trends in Event Agenda / Key Focus Area
- Figure 10.15 Global Events: Historical Trend of Event Agendas
- Figure 10.16 Most Active Industry Participants: Distribution by Number of Events
- Figure 10.17 Global Events: Distribution by Seniority Level of Event Speakers
- Figure 10.18 Global Events: Distribution by Affiliated Department of Event Speakers
- Figure 11.1 Automatic Sampling in Biopharmaceutical Applications and the Measurement of CQA: SWOT Analysis
- Figure 11.2 SWOT Factors: Harvey Ball Analysis
- Figure 12.1 Porters Five Forces: Key Parameters
- Figure 12.2 Porters Five Forces: Harvey Ball Analysis
- Figure 13.1 Global Automatic Sampling in Biopharmaceutical Applications and the Measurement of CQA Market, Till 2035 (USD Million)
- Figure 13.2 Automatic Sampling in Biopharmaceutical Applications and the Measurement of CQA Market: Distribution by Type of Monitoring Method
- Figure 13.3 Automatic Sampling Market for On-line Monitoring, Till 2035 (USD Million)
- Figure 13.4 Automatic Sampling Market for Off-line Monitoring, Till 2035 (USD Million)
- Figure 13.5 Automatic Sampling Market for At-line Monitoring, Till 2035 (USD Million)
- Figure 13.6 Automatic Sampling in Biopharmaceutical Applications and the Measurement of CQA Market: Distribution by Type of Bioprocessing Method
- Figure 13.7 Automatic Sampling Market for Upstream Bioprocessing, Till 2035 (USD Million)
- Figure 13.8 Automatic Sampling Market for Downstream Bioprocessing, Till 2035 (USD Million)
- Figure 13.9 Automatic Sampling in Biopharmaceutical Applications and the Measurement of CQA Market: Distribution by Working Volume
- Figure 13.10 Automatic Sampling Market for Systems with less than 10 mL Working Volume, Till 2035 (USD Million)
- Figure 13.11 Automatic Sampling Market for Systems with 10-50 mL Working Volume, Till 2035 (USD Million)
- Figure 13.12 Automatic Sampling Market for Systems with 51-100 mL Working Volume, Till 2035 (USD Million)
- Figure 13.13 Automatic Sampling Market for Systems with more than 100 mL Working Volume, Till 2035 (USD Million)
- Figure 13.14 Automatic Sampling in Biopharmaceutical Applications and the Measurement of CQA Market: Distribution by Scalability
- Figure 13.15 Automatic Sampling Market for Lab Scale Operations, Till 2035 (USD Million)
- Figure 13.16 Automatic Sampling Market for Pilot Scale Operations, Till 2035 (USD Million)
- Figure 13.17 Automatic Sampling Market for Commercial Scale Operations, Till 2035 (USD Million)
- Figure 13.18 Automatic Sampling in Biopharmaceutical Applications and the Measurement of CQA Market: Distribution by Key Geographical Regions
- Figure 13.19 Automatic Sampling Market in North America, Till 2035 (USD Million)
- Figure 13.20 Automatic Sampling Market in Europe, Till 2035 (USD Million)
- Figure 13.21 Automatic Sampling Market in Asia-Pacific and Rest of the World, Till 2035 (USD Million)
- Figure 14.1 Transition from Industry 1.0 to Industry 5.0
- Figure 14.2 Horizons of Lab Evolution
- Figure 14.3 Benefits of Industry 4.0
- Figure 14.4 Benefits of Industry 5.0
- Figure 15.1 Concluding Remarks: Automatic Sampling Systems Market Landscape
- Figure 15.2 Concluding Remarks: Automatic Sample Collection / Preparation Systems Market Landscape
- Figure 15.3 Concluding Remarks: Patent Analysis
- Figure 15.4 Concluding Remarks: Partnerships and Collaborations
- Figure 15.5 Concluding Remarks: Global Events
- Figure 15.6 Concluding Remarks:Porter's Five Forces Analysis
- Figure 15.7 Concluding Remarks: Market Forecast and Opportunity Analysi

