
PUBLISHER: Roots Analysis | PRODUCT CODE: 1803900

PUBLISHER: Roots Analysis | PRODUCT CODE: 1803900
Virtual Tourism Market till 2035: Distribution by Type of Product, Device, Areas of Application, Type of Tours, Direct Suppliers, Type of Indirect Suppliers, Company Size, and Key Geographical Regions: Industry Trends and Global Forecasts
Virtual Tourism Market Overview
As per Roots Analysis, the global virtual tourism market size is estimated to grow from USD 4.51 billion in the current year to USD 45.65 billion by 2035, at a CAGR of 23.41% during the forecast period, till 2035.
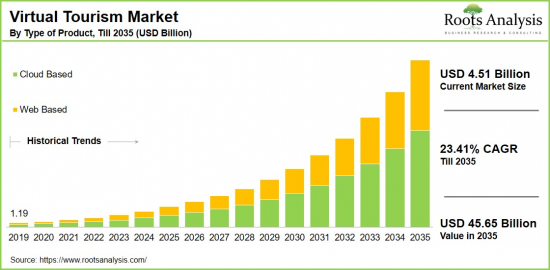
The opportunity for virtual tourism market has been distributed across the following segments:
Type of Product
- Cloud Based
- Web Based
Type of Device
- Head Mounted
- Gesture Tracking
Areas of Application
- Art Galleries & Museums
- Automotive
- Education
- Marketing Professionals
- Real Estate Professionals
- Tourism Industries
Type of Tours
- 360-degree virtual tours
- 3D Virtual Tours
- Virtual Reality Tours
Type of Direct Suppliers
- Airlines
- Government Bodies
- Hotel Campaigns
- Tour Operators
Type of Indirect Suppliers
- Aggregators
- Corporate Buyers
- Online Travel Agency
- Traditional Travel Agencies
- Travel Management Companies
Company Size
- Large Enterprises
- Small and Medium Enterprises
Geographical Regions
- North America
- US
- Canada
- Mexico
- Other North American countries
- Europe
- Austria
- Belgium
- Denmark
- France
- Germany
- Ireland
- Italy
- Netherlands
- Norway
- Russia
- Spain
- Sweden
- Switzerland
- UK
- Other European countries
- Asia
- China
- India
- Japan
- Singapore
- South Korea
- Other Asian countries
- Latin America
- Brazil
- Chile
- Colombia
- Venezuela
- Other Latin American countries
- Middle East and North Africa
- Egypt
- Iran
- Iraq
- Israel
- Kuwait
- Saudi Arabia
- UAE
- Other MENA countries
- Rest of the World
- Australia
- New Zealand
- Other countries
Virtual Tourism Market: Growth and Trends
With the rise of virtual reality, virtual tours provide an immersive experience of a place, activity, or destination through a series of panoramic images that are combined, resulting in a virtual representation of an area. Applications that offer virtual tours are widely used for viewing properties, vehicles, tourist attractions, and more. These applications utilize images, audio, video clips, and 3D maps to create a 360-degree perspective of the location. Currently, virtual tours are accessible for numerous exotic sites, from cultural institutions to natural beauty spots such as the islands of Thailand.
The growing awareness of environmental issues plays a significant role in boosting the virtual tourism market, as it serves as an eco-friendly substitute for traditional travel. A prominent trend within this industry is the reduction of carbon footprints enabled by virtual tourism, which eliminates the need for flights, road travel, and extensive tourism infrastructure. Virtual tourism helps lessen the environmental effects of travel while still offering individuals the chance to discover popular destinations.
It also makes travel more accessible, catering to individuals with diverse physical disabilities and financial circumstances. Although VR headsets are considered extravagant for most people, they are expected to become more affordable as the technology develops. Owing to the above mentioned factors, the virtual tourism market is expected to experience significant growth during the forecast period.
Virtual Tourism Market: Key Segments
Market Share by Type of Service
Based on type of service, the global virtual tourism market is segmented into cloud based and web based. According to our estimates, currently, the cloud based segment captures the majority share of the market. This is due to the benefits of cloud based systems, such as real-time updates, increased efficiency, flexible pricing options, improved collaboration, and easy data recovery.
Conversely, the web-based segment is expected to grow at a relatively higher CAGR during the forecast period. This surge can be attributed to the segment's cost-effectiveness and its ability to meet the increasing demand for interactive experiences.
Market Share by Type of Device
Based on type of device, the virtual tourism market is segmented into head mounted and gesture tracking. According to our estimates, currently, the head mounted devices capture the majority of the market. This can be attributed to the widespread recognition of head-mounted devices as the most iconic element of virtual reality. Since visuals are more engaging for humans, HMDs are commonly favored for their capacity to distinguish immersive virtual reality systems from typical user interfaces.
Market Share by Areas of Application
Based on areas of application, the virtual tourism market is segmented into art galleries & museums, automotive, education, marketing professionals, real estate professionals, tourism industries. According to our estimates, currently, tourism industry captures the majority share of the market. This growth can be attributed to the increasing adoption of VR technologies, which make global destinations accessible to a wider audience that may otherwise face financial or logistical barriers to travel.
However, the real estate segment is expected to grow at a higher CAGR during the forecast period, due to the growing demand from home buyers for virtual property tours, enabling online property listings to be more immersive and accessible.
Market Share by Type of Tours
Based on type of tours, the virtual tourism market is segmented into 360 degree virtual tours, 3D virtual tours, and virtual reality tours. According to our estimates, currently, 3D virtual tours segment captures the majority share of the market. This growth can be attributed to the immersive experience these tours offer, allowing users to explore destinations from the comfort of their homes through detailed 360-degree views and interactive features
However, the virtual reality tours segment is expected to grow at a higher CAGR during the forecast period, driven by the unique and engaging experiences VR technology offers to users.
Market Share by Type of Direct Suppliers
Based on type of direct suppliers, the virtual tourism market is segmented into airlines, government bodies, hotel campaigns, and tour operators. According to our estimates, currently, the tour operators captures the majority share of the market. This growth can be attributed to the significant role that tour operators play in delivering virtual travel experiences and promoting destinations through digital platforms
However, the airlines segment is expected to grow at a higher CAGR during the forecast period, driven by growing investments in virtual tourism technologies aimed at boosting customer engagement and offering immersive pre-travel experiences.
Market Share by Type of Indirect Suppliers
Based on type of indirect suppliers, the virtual tourism market is segmented into aggregators, corporate buyers, online travel agency, traditional travel agencies, travel management companies. According to our estimates, currently, the online travel agency segment captures the majority share of the market, owing to their vital role in distributing virtual tourism experiences and expanding their influence in the market
However, the aggregators segment is expected to grow at a higher CAGR during the forecast period, due to its ability to compile a wide range of virtual tour options, offering consumers greater variety, convenience, and accessibility.
Market Share by Company Size
Based on company size, the virtual tourism market is segmented into large and small and medium enterprises. According to our estimates, currently, the large enterprise segment captures the majority share of the market. However, the small & medium enterprises are expected to grow at a higher CAGR during the forecast period. This accelerated growth can be attributed to their flexibility, innovative approaches, targeted focus on niche markets, and adaptability to evolving customer preferences and market dynamics.
Market Share by Geographical Regions
Based on geographical regions, the virtual tourism market is segmented into North America, Europe, Asia, Latin America, Middle East and North Africa, and the rest of the world. According to our estimates, currently, North America captures the majority share of the market, driven by its advanced technological infrastructure, widespread adoption of cutting-edge AI technologies, and substantial investments in virtual tourism from major industry players.
The presence of prominent technology companies and AI innovators fuels ongoing advancements and new developments within the virtual tourism space. Additionally, the emphasis on integrating AI into sectors like VR travel, real estate, and education further accelerates the market growth in this region.
Example Players in Virtual Tourism Market
- 360 Cities
- 360 Imagery
- 360 Pano VR Solutions
- Airbnb
- Ascape VR
- Blue Raven
- Comp11
- Concept3D
- Dubai 360
- Exsight 360
- Expedia Group
- First Airlines
- Google Earth VR
- Invision Studio
- Klapty
- Kuula
- Matterport
- MI 360
- Pan 3Sixty
- RealTourVision
- Roundme
- SeekBeak
- Starts360
- TourVista
- TripAdvisor
- Unimersiv
- Visit Wales
- VeeR VR
- Wanderlust VR
- YouVisit
Virtual Tourism Market: Research Coverage
The report on the virtual tourism market features insights on various sections, including:
- Market Sizing and Opportunity Analysis: An in-depth analysis of the virtual tourism market, focusing on key market segments, including [A] type of product, [B] type of device, [C] areas of application, [D] type of tours, [E] type of direct suppliers, [F] type of indirect suppliers, [G] company size, and [H] key geographical regions.
- Competitive Landscape: A comprehensive analysis of the companies engaged in the virtual tourism market, based on several relevant parameters, such as [A] year of establishment, [B] company size, [C] location of headquarters and [D] ownership structure.
- Company Profiles: Elaborate profiles of prominent players engaged in the virtual tourism market, providing details on [A] location of headquarters, [B] company size, [C] company mission, [D] company footprint, [E] management team, [F] contact details, [G] financial information, [H] operating business segments, [I] virtual tourism portfolio, [J] moat analysis, [K] recent developments, and an informed future outlook.
- Megatrends: An evaluation of ongoing megatrends in virtual tourism industry.
- Patent Analysis: An insightful analysis of patents filed / granted in the virtual tourism domain, based on relevant parameters, including [A] type of patent, [B] patent publication year, [C] patent age and [D] leading players.
- Recent Developments: An overview of the recent developments made in the virtual tourism market, along with analysis based on relevant parameters, including [A] year of initiative, [B] type of initiative, [C] geographical distribution and [D] most active players.
- Porter's Five Forces Analysis: An analysis of five competitive forces prevailing in the virtual tourism market, including threats of new entrants, bargaining power of buyers, bargaining power of suppliers, threats of substitute products and rivalry among existing competitors.
- SWOT Analysis: An insightful SWOT framework, highlighting the strengths, weaknesses, opportunities and threats in the domain. Additionally, it provides Harvey ball analysis, highlighting the relative impact of each SWOT parameter.
- Value Chain Analysis: A comprehensive analysis of the value chain, providing information on the different phases and stakeholders involved in the virtual tourism market
Key Questions Answered in this Report
- How many companies are currently engaged in virtual tourism market?
- Which are the leading companies in this market?
- What factors are likely to influence the evolution of this market?
- What is the current and future market size?
- What is the CAGR of this market?
- How is the current and future market opportunity likely to be distributed across key market segments?
Reasons to Buy this Report
- The report provides a comprehensive market analysis, offering detailed revenue projections of the overall market and its specific sub-segments. This information is valuable to both established market leaders and emerging entrants.
- Stakeholders can leverage the report to gain a deeper understanding of the competitive dynamics within the market. By analyzing the competitive landscape, businesses can make informed decisions to optimize their market positioning and develop effective go-to-market strategies.
- The report offers stakeholders a comprehensive overview of the market, including key drivers, barriers, opportunities, and challenges. This information empowers stakeholders to stay abreast of market trends and make data-driven decisions to capitalize on growth prospects.
Additional Benefits
- Complimentary Excel Data Packs for all Analytical Modules in the Report
- 15% Free Content Customization
- Detailed Report Walkthrough Session with Research Team
- Free Updated report if the report is 6-12 months old or older
TABLE OF CONTENTS
SECTION I: REPORT OVERVIEW
1. PREFACE
- 1.1. Introduction
- 1.2. Market Share Insights
- 1.3. Key Market Insights
- 1.4. Report Coverage
- 1.5. Key Questions Answered
- 1.6. Chapter Outlines
2. RESEARCH METHODOLOGY
- 2.1. Chapter Overview
- 2.2. Research Assumptions
- 2.3. Database Building
- 2.3.1. Data Collection
- 2.3.2. Data Validation
- 2.3.3. Data Analysis
- 2.4. Project Methodology
- 2.4.1. Secondary Research
- 2.4.1.1. Annual Reports
- 2.4.1.2. Academic Research Papers
- 2.4.1.3. Company Websites
- 2.4.1.4. Investor Presentations
- 2.4.1.5. Regulatory Filings
- 2.4.1.6. White Papers
- 2.4.1.7. Industry Publications
- 2.4.1.8. Conferences and Seminars
- 2.4.1.9. Government Portals
- 2.4.1.10. Media and Press Releases
- 2.4.1.11. Newsletters
- 2.4.1.12. Industry Databases
- 2.4.1.13. Roots Proprietary Databases
- 2.4.1.14. Paid Databases and Sources
- 2.4.1.15. Social Media Portals
- 2.4.1.16. Other Secondary Sources
- 2.4.2. Primary Research
- 2.4.2.1. Introduction
- 2.4.2.2. Types
- 2.4.2.2.1. Qualitative
- 2.4.2.2.2. Quantitative
- 2.4.2.3. Advantages
- 2.4.2.4. Techniques
- 2.4.2.4.1. Interviews
- 2.4.2.4.2. Surveys
- 2.4.2.4.3. Focus Groups
- 2.4.2.4.4. Observational Research
- 2.4.2.4.5. Social Media Interactions
- 2.4.2.5. Stakeholders
- 2.4.2.5.1. Company Executives (CXOs)
- 2.4.2.5.2. Board of Directors
- 2.4.2.5.3. Company Presidents and Vice Presidents
- 2.4.2.5.4. Key Opinion Leaders
- 2.4.2.5.5. Research and Development Heads
- 2.4.2.5.6. Technical Experts
- 2.4.2.5.7. Subject Matter Experts
- 2.4.2.5.8. Scientists
- 2.4.2.5.9. Doctors and Other Healthcare Providers
- 2.4.2.6. Ethics and Integrity
- 2.4.2.6.1. Research Ethics
- 2.4.2.6.2. Data Integrity
- 2.4.3. Analytical Tools and Databases
- 2.4.1. Secondary Research
3. MARKET DYNAMICS
- 3.1. Forecast Methodology
- 3.1.1. Top-Down Approach
- 3.1.2. Bottom-Up Approach
- 3.1.3. Hybrid Approach
- 3.2. Market Assessment Framework
- 3.2.1. Total Addressable Market (TAM)
- 3.2.2. Serviceable Addressable Market (SAM)
- 3.2.3. Serviceable Obtainable Market (SOM)
- 3.2.4. Currently Acquired Market (CAM)
- 3.3. Forecasting Tools and Techniques
- 3.3.1. Qualitative Forecasting
- 3.3.2. Correlation
- 3.3.3. Regression
- 3.3.4. Time Series Analysis
- 3.3.5. Extrapolation
- 3.3.6. Convergence
- 3.3.7. Forecast Error Analysis
- 3.3.8. Data Visualization
- 3.3.9. Scenario Planning
- 3.3.10. Sensitivity Analysis
- 3.4. Key Considerations
- 3.4.1. Demographics
- 3.4.2. Market Access
- 3.4.3. Reimbursement Scenarios
- 3.4.4. Industry Consolidation
- 3.5. Robust Quality Control
- 3.6. Key Market Segmentations
- 3.7. Limitations
4. MACRO-ECONOMIC INDICATORS
- 4.1. Chapter Overview
- 4.2. Market Dynamics
- 4.2.1. Time Period
- 4.2.1.1. Historical Trends
- 4.2.1.2. Current and Forecasted Estimates
- 4.2.2. Currency Coverage
- 4.2.2.1. Overview of Major Currencies Affecting the Market
- 4.2.2.2. Impact of Currency Fluctuations on the Industry
- 4.2.3. Foreign Exchange Impact
- 4.2.3.1. Evaluation of Foreign Exchange Rates and Their Impact on Market
- 4.2.3.2. Strategies for Mitigating Foreign Exchange Risk
- 4.2.4. Recession
- 4.2.4.1. Historical Analysis of Past Recessions and Lessons Learnt
- 4.2.4.2. Assessment of Current Economic Conditions and Potential Impact on the Market
- 4.2.5. Inflation
- 4.2.5.1. Measurement and Analysis of Inflationary Pressures in the Economy
- 4.2.5.2. Potential Impact of Inflation on the Market Evolution
- 4.2.6. Interest Rates
- 4.2.6.1. Overview of Interest Rates and Their Impact on the Market
- 4.2.6.2. Strategies for Managing Interest Rate Risk
- 4.2.7. Commodity Flow Analysis
- 4.2.7.1. Type of Commodity
- 4.2.7.2. Origins and Destinations
- 4.2.7.3. Values and Weights
- 4.2.7.4. Modes of Transportation
- 4.2.8. Global Trade Dynamics
- 4.2.8.1. Import Scenario
- 4.2.8.2. Export Scenario
- 4.2.9. War Impact Analysis
- 4.2.9.1. Russian-Ukraine War
- 4.2.9.2. Israel-Hamas War
- 4.2.10. COVID Impact / Related Factors
- 4.2.10.1. Global Economic Impact
- 4.2.10.2. Industry-specific Impact
- 4.2.10.3. Government Response and Stimulus Measures
- 4.2.10.4. Future Outlook and Adaptation Strategies
- 4.2.11. Other Indicators
- 4.2.11.1. Fiscal Policy
- 4.2.11.2. Consumer Spending
- 4.2.11.3. Gross Domestic Product (GDP)
- 4.2.11.4. Employment
- 4.2.11.5. Taxes
- 4.2.11.6. R&D Innovation
- 4.2.11.7. Stock Market Performance
- 4.2.11.8. Supply Chain
- 4.2.11.9. Cross-Border Dynamics
- 4.2.1. Time Period
SECTION II: QUALITATIVE INSIGHTS
5. EXECUTIVE SUMMARY
6. INTRODUCTION
- 6.1. Chapter Overview
- 6.2. Overview of Virtual Tourism Market
- 6.2.1. Type of Product
- 6.2.2. Type of Device
- 6.2.3. Areas of Application
- 6.2.4. Type of Tours
- 6.2.5. Type of Direct Suppliers
- 6.2.6. Type of Indirect Suppliers
- 6.3. Future Perspective
7. REGULATORY SCENARIO
SECTION III: MARKET OVERVIEW
8. COMPREHENSIVE DATABASE OF LEADING PLAYERS
9. COMPETITIVE LANDSCAPE
- 9.1. Chapter Overview
- 9.2. Virtual tourism: Overall Market Landscape
- 9.2.1. Analysis by Year of Establishment
- 9.2.2. Analysis by Company Size
- 9.2.3. Analysis by Location of Headquarters
- 9.2.4. Analysis by Ownership Structure
10. WHITE SPACE ANALYSIS
11. COMPANY COMPETITIVENESS ANALYSIS
12. STARTUP ECOSYSTEM IN THE VIRTUAL TOURISM MARKET
- 12.1. Virtual tourism market: Market Landscape of Startups
- 12.1.1. Analysis by Year of Establishment
- 12.1.2. Analysis by Company Size
- 12.1.3. Analysis by Company Size and Year of Establishment
- 12.1.4. Analysis by Location of Headquarters
- 12.1.5. Analysis by Company Size and Location of Headquarters
- 12.1.6. Analysis by Ownership Structure
- 12.2. Key Findings
SECTION IV: COMPANY PROFILES
13. COMPANY PROFILES
- 13.1. Chapter Overview
- 13.2. 360 Cities*
- 13.2.1. Company Overview
- 13.2.2. Company Mission
- 13.2.3. Company Footprint
- 13.2.4. Management Team
- 13.2.5. Contact Details
- 13.2.6. Financial Performance
- 13.2.7. Operating Business Segments
- 13.2.8. Service / Product Portfolio (project specific)
- 13.2.9. MOAT Analysis
- 13.2.10. Recent Developments and Future Outlook
- 13.3. 360 Imagery
- 13.4. 360 Pano VR Solutions
- 13.5. Airbnb
- 13.6. Ascape VR
- 13.7. Blue Raven
- 13.8. Comp11
- 13.9. Concept 3D
- 13.10. Dubai 360
- 13.11. Exsight 360
- 13.12. Expedia Group
- 13.13. First Airlines
- 13.14. Google Earth VR
- 13.15. Google
- 13.16. Invision Studio
- 13.17. Klapty
- 13.18. Kuula
- 13.19. Matterport
SECTION V: MARKET TRENDS
14. MEGA TRENDS ANALYSIS
15. UNMEET NEED ANALYSIS
16. PATENT ANALYSIS
17. RECENT DEVELOPMENTS
- 17.1. Chapter Overview
- 17.2. Recent Funding
- 17.3. Recent Partnerships
- 17.4. Other Recent Initiatives
SECTION VI: MARKET OPPORTUNITY ANALYSIS
18. GLOBAL VIRTUAL TOURISM MARKET
- 18.1. Chapter Overview
- 18.2. Key Assumptions and Methodology
- 18.3. Trends Disruption Impacting Market
- 18.4. Demand Side Trends
- 18.5. Supply Side Trends
- 18.6. Global Virtual tourism market, Historical Trends (Since 2019) and Forecasted Estimates (Till 2035)
- 18.7. Multivariate Scenario Analysis
- 18.7.1. Conservative Scenario
- 18.7.2. Optimistic Scenario
- 18.8. Investment Feasibility Index
- 18.9. Key Market Segmentations
19. MARKET OPPORTUNITIES BASED ON TYPE OF PRODUCT
- 19.1. Chapter Overview
- 19.2. Key Assumptions and Methodology
- 19.3. Revenue Shift Analysis
- 19.4. Market Movement Analysis
- 19.5. Penetration-Growth (P-G) Matrix
- 19.6. Virtual tourism market for Cloud Based: Historical Trends (Since 2019) and Forecasted Estimates (Till 2035)
- 19.7. Virtual tourism market for Web Based: Historical Trends (Since 2019) and Forecasted Estimates (Till 2035)
- 19.8. Data Triangulation and Validation
- 19.8.1. Secondary Sources
- 19.8.2. Primary Sources
- 19.8.3. Statistical Modeling
20. MARKET OPPORTUNITIES BASED ON TYPE OF DEVICE
- 20.1. Chapter Overview
- 20.2. Key Assumptions and Methodology
- 20.3. Revenue Shift Analysis
- 20.4. Market Movement Analysis
- 20.5. Penetration-Growth (P-G) Matrix
- 20.6. Virtual tourism market for Head Mounted: Historical Trends (Since 2019) and Forecasted Estimates (Till 2035)
- 20.7. Virtual tourism market for Gesture Tracking: Historical Trends (Since 2019) and Forecasted Estimates (Till 2035)
- 20.8. Data Triangulation and Validation
- 20.8.1. Secondary Sources
- 20.8.2. Primary Sources
- 20.8.3. Statistical Modeling
21. MARKET OPPORTUNITIES BASED ON AREAS OF APPLICATION
- 21.1. Chapter Overview
- 21.2. Key Assumptions and Methodology
- 21.3. Revenue Shift Analysis
- 21.4. Market Movement Analysis
- 21.5. Penetration-Growth (P-G) Matrix
- 21.6. Virtual tourism market for Art Galleries & Museums: Historical Trends (Since 2019) and Forecasted Estimates (Till 2035)
- 21.7. Virtual tourism market for Automotive: Historical Trends (Since 2019) and Forecasted Estimates (Till 2035)
- 21.8. Virtual tourism market for Education: Historical Trends (Since 2019) and Forecasted Estimates (Till 2035)
- 21.9. Virtual tourism market for Marketing Professionals: Historical Trends (Since 2019) and Forecasted Estimates (Till 2035)
- 21.10. Virtual tourism market for Real Estate Professionals: Historical Trends (Since 2019) and Forecasted Estimates (Till 2035)
- 21.11. Virtual tourism market for Tourism Industries: Historical Trends (Since 2019) and Forecasted Estimates (Till 2035)
- 21.12. Data Triangulation and Validation
- 21.12.1. Secondary Sources
- 21.12.2. Primary Sources
- 21.12.3. Statistical Modeling
22. MARKET OPPORTUNITIES BASED ON TYPE OF TOURS
- 22.1. Chapter Overview
- 22.2. Key Assumptions and Methodology
- 22.3. Revenue Shift Analysis
- 22.4. Market Movement Analysis
- 22.5. Penetration-Growth (P-G) Matrix
- 22.6. Virtual tourism market for 360-Degree Virtual Tours: Historical Trends (Since 2019) and Forecasted Estimates (Till 2035)
- 22.7. Virtual tourism market for 3D Virtual Tours: Historical Trends (Since 2019) and Forecasted Estimates (Till 2035)
- 22.8. Virtual tourism market for Virtual Reality Tours: Historical Trends (Since 2019) and Forecasted Estimates (Till 2035)
- 22.9. Data Triangulation and Validation
- 22.9.1. Secondary Sources
- 22.9.2. Primary Sources
- 22.9.3. Statistical Modeling
23. MARKET OPPORTUNITIES BASED ON TYPE OF DIRECT SUPPLIERS
- 23.1. Chapter Overview
- 23.2. Key Assumptions and Methodology
- 23.3. Revenue Shift Analysis
- 23.4. Market Movement Analysis
- 23.5. Penetration-Growth (P-G) Matrix
- 23.6. Virtual tourism market for Airlines: Historical Trends (Since 2019) and Forecasted Estimates (Till 2035)
- 23.7. Virtual tourism market for Government Bodies: Historical Trends (Since 2019) and Forecasted Estimates (Till 2035)
- 23.8. Virtual tourism market for Hotel Campaigns: Historical Trends (Since 2019) and Forecasted Estimates (Till 2035)
- 23.9. Virtual tourism market for Tour Operators: Historical Trends (Since 2019) and Forecasted Estimates (Till 2035)
- 23.10. Data Triangulation and Validation
- 23.10.1. Secondary Sources
- 23.10.2. Primary Sources
- 23.10.3. Statistical Modeling
24. MARKET OPPORTUNITIES BASED ON TYPE OF INDIRECT SUPPLIERS
- 24.1. Chapter Overview
- 24.2. Key Assumptions and Methodology
- 24.3. Revenue Shift Analysis
- 24.4. Market Movement Analysis
- 24.5. Penetration-Growth (P-G) Matrix
- 24.6. Virtual tourism market for Aggregators: Historical Trends (Since 2019) and Forecasted Estimates (Till 2035)
- 24.7. Virtual tourism market for Corporate Buyers: Historical Trends (Since 2019) and Forecasted Estimates (Till 2035)
- 24.8. Virtual tourism market for Online Travel Agency: Historical Trends (Since 2019) and Forecasted Estimates (Till 2035)
- 24.9. Virtual tourism market for Travel Management Companies: Historical Trends (Since 2019) and Forecasted Estimates (Till 2035)
- 24.10. Virtual tourism market for Hotel Campaigns: Historical Trends (Since 2019) and Forecasted Estimates (Till 2035)
- 24.11. Data Triangulation and Validation
- 24.11.1. Secondary Sources
- 24.11.2. Primary Sources
- 24.11.3. Statistical Modeling
25. MARKET OPPORTUNITIES FOR VIRTUAL TOURISM IN NORTH AMERICA
- 25.1. Chapter Overview
- 25.2. Key Assumptions and Methodology
- 25.3. Revenue Shift Analysis
- 25.4. Market Movement Analysis
- 25.5. Penetration-Growth (P-G) Matrix
- 25.6. Virtual tourism market in North America: Historical Trends (Since 2019) and Forecasted Estimates (Till 2035)
- 25.6.1. Virtual tourism market in the US: Historical Trends (Since 2019) and Forecasted Estimates (Till 2035)
- 25.6.2. Virtual tourism market in Canada: Historical Trends (Since 2019) and Forecasted Estimates (Till 2035)
- 25.6.3. Virtual tourism market in Mexico: Historical Trends (Since 2019) and Forecasted Estimates (Till 2035)
- 25.6.4. Virtual tourism market in Other North American Countries: Historical Trends (Since 2019) and Forecasted Estimates (Till 2035)
- 25.7. Data Triangulation and Validation
26. MARKET OPPORTUNITIES FOR VIRTUAL TOURISM IN EUROPE
- 26.1. Chapter Overview
- 26.2. Key Assumptions and Methodology
- 26.3. Revenue Shift Analysis
- 26.4. Market Movement Analysis
- 26.5. Penetration-Growth (P-G) Matrix
- 26.6. Virtual tourism market in Europe: Historical Trends (Since 2019) and Forecasted Estimates (Till 2035)
- 26.6.1. Virtual tourism market in Austria: Historical Trends (Since 2019) and Forecasted Estimates (Till 2035)
- 26.6.2. Virtual tourism market in Belgium: Historical Trends (Since 2019) and Forecasted Estimates (Till 2035)
- 26.6.3. Virtual tourism market in Denmark: Historical Trends (Since 2019) and Forecasted Estimates (Till 2035)
- 26.6.4. Virtual tourism market in France: Historical Trends (Since 2019) and Forecasted Estimates (Till 2035)
- 26.6.5. Virtual tourism market in Germany: Historical Trends (Since 2019) and Forecasted Estimates (Till 2035)
- 26.6.6. Virtual tourism market in Ireland: Historical Trends (Since 2019) and Forecasted Estimates (Till 2035)
- 26.6.7. Virtual tourism market in Italy: Historical Trends (Since 2019) and Forecasted Estimates (Till 2035)
- 26.6.8. Virtual tourism market in Netherlands: Historical Trends (Since 2019) and Forecasted Estimates (Till 2035)
- 26.6.9. Virtual tourism market in Norway: Historical Trends (Since 2019) and Forecasted Estimates (Till 2035)
- 26.6.10. Virtual tourism market in Russia: Historical Trends (Since 2019) and Forecasted Estimates (Till 2035)
- 26.6.11. Virtual tourism market in Spain: Historical Trends (Since 2019) and Forecasted Estimates (Till 2035)
- 26.6.12. Virtual tourism market in Sweden: Historical Trends (Since 2019) and Forecasted Estimates (Till 2035)
- 26.6.13. Virtual tourism market in Sweden: Historical Trends (Since 2019) and Forecasted Estimates (Till 2035)
- 26.6.14. Virtual tourism market in Switzerland: Historical Trends (Since 2019) and Forecasted Estimates (Till 2035)
- 26.6.15. Virtual tourism market in the UK: Historical Trends (Since 2019) and Forecasted Estimates (Till 2035)
- 26.6.16. Virtual tourism market in Other European Countries: Historical Trends (Since 2019) and Forecasted Estimates (Till 2035)
- 26.7. Data Triangulation and Validation
27. MARKET OPPORTUNITIES FOR VIRTUAL TOURISM IN ASIA
- 27.1. Chapter Overview
- 27.2. Key Assumptions and Methodology
- 27.3. Revenue Shift Analysis
- 27.4. Market Movement Analysis
- 27.5. Penetration-Growth (P-G) Matrix
- 27.6. Virtual tourism market in Asia: Historical Trends (Since 2019) and Forecasted Estimates (Till 2035)
- 27.6.1. Virtual tourism market in China: Historical Trends (Since 2019) and Forecasted Estimates (Till 2035)
- 27.6.2. Virtual tourism market in India: Historical Trends (Since 2019) and Forecasted Estimates (Till 2035)
- 27.6.3. Virtual tourism market in Japan: Historical Trends (Since 2019) and Forecasted Estimates (Till 2035)
- 27.6.4. Virtual tourism market in Singapore: Historical Trends (Since 2019) and Forecasted Estimates (Till 2035)
- 27.6.5. Virtual tourism market in South Korea: Historical Trends (Since 2019) and Forecasted Estimates (Till 2035)
- 27.6.6. Virtual tourism market in Other Asian Countries: Historical Trends (Since 2019) and Forecasted Estimates (Till 2035)
- 27.7. Data Triangulation and Validation
28. MARKET OPPORTUNITIES FOR VIRTUAL TOURISM IN MIDDLE EAST AND NORTH AFRICA (MENA)
- 28.1. Chapter Overview
- 28.2. Key Assumptions and Methodology
- 28.3. Revenue Shift Analysis
- 28.4. Market Movement Analysis
- 28.5. Penetration-Growth (P-G) Matrix
- 28.6. Virtual tourism market in Middle East and North Africa (MENA): Historical Trends (Since 2019) and Forecasted Estimates (Till 2035)
- 28.6.1. Virtual tourism market in Egypt: Historical Trends (Since 2019) and Forecasted Estimates (Till 205)
- 28.6.2. Virtual tourism market in Iran: Historical Trends (Since 2019) and Forecasted Estimates (Till 2035)
- 28.6.3. Virtual tourism market in Iraq: Historical Trends (Since 2019) and Forecasted Estimates (Till 2035)
- 28.6.4. Virtual tourism market in Israel: Historical Trends (Since 2019) and Forecasted Estimates (Till 2035)
- 28.6.5. Virtual tourism market in Kuwait: Historical Trends (Since 2019) and Forecasted Estimates (Till 2035)
- 28.6.6. Virtual tourism market in Saudi Arabia: Historical Trends (Since 2019) and Forecasted Estimates (Till 2035)
- 28.6.7. Virtual tourism market in United Arab Emirates (UAE): Historical Trends (Since 2019) and Forecasted Estimates (Till 2035)
- 28.6.8. Virtual tourism market in Other MENA Countries: Historical Trends (Since 2019) and Forecasted Estimates (Till 2035)
- 28.7. Data Triangulation and Validation
29. MARKET OPPORTUNITIES FOR VIRTUAL TOURISM IN LATIN AMERICA
- 29.1. Chapter Overview
- 29.2. Key Assumptions and Methodology
- 29.3. Revenue Shift Analysis
- 29.4. Market Movement Analysis
- 29.5. Penetration-Growth (P-G) Matrix
- 29.6. Virtual tourism market in Latin America: Historical Trends (Since 2019) and Forecasted Estimates (Till 2035)
- 29.6.1. Virtual tourism market in Argentina: Historical Trends (Since 2019) and Forecasted Estimates (Till 2035)
- 29.6.2. Virtual tourism market in Brazil: Historical Trends (Since 2019) and Forecasted Estimates (Till 2035)
- 29.6.3. Virtual tourism market in Chile: Historical Trends (Since 2019) and Forecasted Estimates (Till 2035)
- 29.6.4. Virtual tourism market in Colombia Historical Trends (Since 2019) and Forecasted Estimates (Till 2035)
- 29.6.5. Virtual tourism market in Venezuela: Historical Trends (Since 2019) and Forecasted Estimates (Till 2035)
- 29.6.6. Virtual tourism market in Other Latin American Countries: Historical Trends (Since 2019) and Forecasted Estimates (Till 2035)
- 29.7. Data Triangulation and Validation
30. MARKET OPPORTUNITIES FOR VIRTUAL TOURISM IN REST OF THE WORLD
- 30.1. Chapter Overview
- 30.2. Key Assumptions and Methodology
- 30.3. Revenue Shift Analysis
- 30.4. Market Movement Analysis
- 30.5. Penetration-Growth (P-G) Matrix
- 30.6. Virtual tourism market in Rest of the World: Historical Trends (Since 2019) and Forecasted Estimates (Till 2035)
- 30.6.1. Virtual tourism market in Australia: Historical Trends (Since 2019) and Forecasted Estimates (Till 2035)
- 30.6.2. Virtual tourism market in New Zealand: Historical Trends (Since 2019) and Forecasted Estimates (Till 2035)
- 30.6.3. Virtual tourism market in Other Countries
- 30.7. Data Triangulation and Validation
31. MARKET CONCENTRATION ANALYSIS: DISTRIBUTION BY LEADING PLAYERS
- 31.1. Leading Player 1
- 31.2. Leading Player 2
- 31.3. Leading Player 3
- 31.4. Leading Player 4
- 31.5. Leading Player 5
- 31.6. Leading Player 6
- 31.7. Leading Player 7
- 31.8. Leading Player 8
32. ADJACENT MARKET ANALYSIS
SECTION VII: STRATEGIC TOOLS
33. KEY WINNING STRATEGIES
34. PORTER'S FIVE FORCES ANALYSIS
35. SWOT ANALYSIS
36. VALUE CHAIN ANALYSIS
37. ROOTS STRATEGIC RECOMMENDATIONS
- 37.1. Chapter Overview
- 37.2. Key Business-related Strategies
- 37.2.1. Research & Development
- 37.2.2. Product Manufacturing
- 37.2.3. Commercialization / Go-to-Market
- 37.2.4. Sales and Marketing
- 37.3. Key Operations-related Strategies
- 37.3.1. Risk Management
- 37.3.2. Workforce
- 37.3.3. Finance
- 37.3.4. Others
SECTION VIII: OTHER EXCLUSIVE INSIGHTS
38. INSIGHTS FROM PRIMARY RESEARCH
39. REPORT CONCLUSION
SECTION IX: APPENDIX
40. TABULATED DATA
41. LIST OF COMPANIES AND ORGANIZATIONS
42. CUSTOMIZATION OPPORTUNITIES
43. ROOTS SUBSCRIPTION SERVICES
44. AUTHOR DETAIL

