
PUBLISHER: Roots Analysis | PRODUCT CODE: 1830063

PUBLISHER: Roots Analysis | PRODUCT CODE: 1830063
Vaccine Development Companies Landscape: Competitive Landscape, Recent Expansions, Partnerships and Collaborations, Big Pharma Initiatives and Cost Price Analysis
Vaccine Developers Market: Overview
The vaccine development companies produced an estimated 7 billion doses of vaccines globally, in the year 2024 and are expected to produce around 8 billion doses in 2025.
Vaccine Developers Market: Growth and Trends
Vaccine is a specialized medical product formulated to activate the body's immune system, enabling it to recognize and protect against specific diseases over the long term. The development of vaccines typically involves using either weakened or inactivated forms of the disease-causing microorganism, or including crucial antigenic components from the pathogen, such as structural proteins and inactivated toxins. By introducing these components, vaccines assist the immune system in recognizing and combating the real pathogen if encountered in the future.
According to World Health Organization, vaccines are categorized into two types, namely preventive (prophylactic) vaccines, which are administered to protect individuals from contracting diseases, and therapeutic vaccines, which are utilized as treatment regimens to help the body fight existing illnesses. Currently, pharmaceutical companies offer numerous vaccines, and many are undergoing clinical trials or are in various stages of development, targeting a wide range of serious and debilitating conditions.
Recently, the Coalition for Epidemic Preparedness Innovations (CEPI) has made a significant new investment of USD 24 million in the Vaccine and Infectious Disease Organization (VIDO), aiming to bolster global preparedness for future infectious disease outbreaks as the world continues to combat the last pandemic.
Significantly, the development and approval of innovative vaccines, by vaccine development companies, such as mRNA, DNA, and recombinant vaccines, are significant trends influencing the competitive landscape of vaccines market.
Vaccine Developers Market: Key Insights
The report delves into the current state of the vaccine developers market and identifies potential growth opportunities within industry. Some key findings from the report include:
- The current market landscape is highly fragmented, featuring the presence of both new entrants and established players; of these, close to 25% of the vaccine developers are large and very large players.
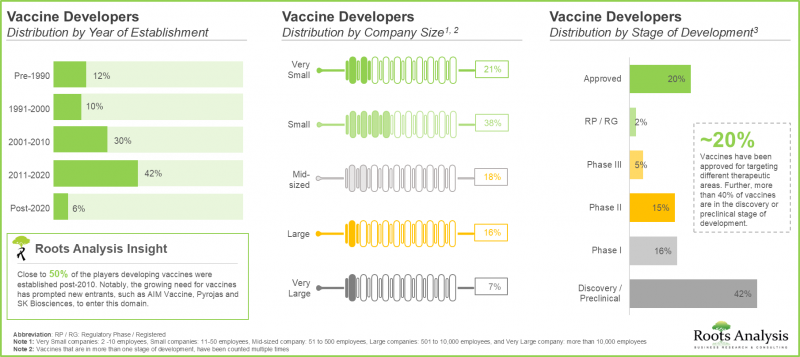
- 35% vaccines are being evaluated across different phases of clinical trials; notably, more than 40% of the vaccines are under discovery / preclinical stage.
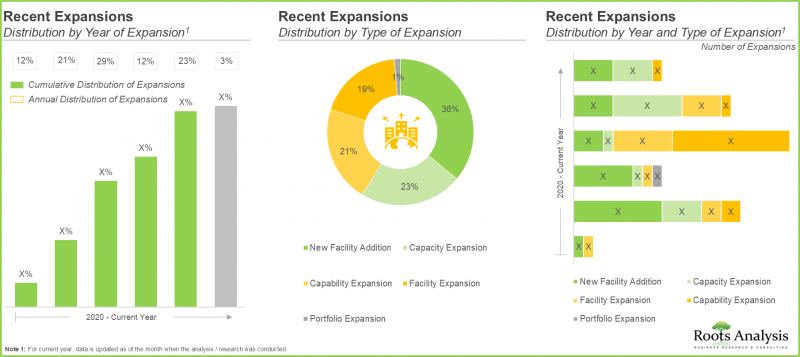
- Most of the expansion initiatives were undertaken in the past few years; of these, nearly 55% of the instances were focused on enhancing the existing vaccine development capabilities to meet increasing demand.
- Majority of the recent expansions (~40%) were undertaken in facilities located in Asia-Pacific; notably, India and Singapore emerged as the key regions where most of the expansions were undertaken.
- Close to 50% of the vaccines-related partnerships were inked in the year 2024; of these, more than 15% of the agreements were manufacturing and product development agreements.
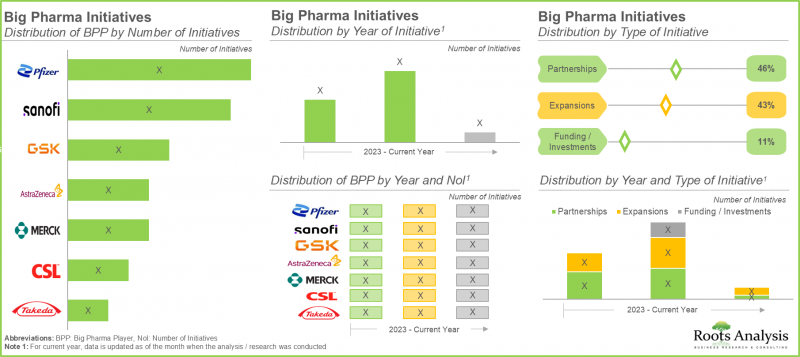
- Over 45% of the big pharma players have signed various partnerships to enhance their existing vaccine portfolios, followed by players (43%) undertaking several expansion initiatives.
Vaccine Developers Market: Key Segments
Competitive Landscape of Vaccine Development Companies
The current market landscape takes into account more than 200 vaccine developers including very large, large, mid-sized and small companies. These vaccine developers have the required expertise to develop different types of vaccines, such as cancer vaccines, mRNA vaccines, RSV vaccines and DNA vaccine across different key geographical regions. Notably, most companies are based in North America, followed by Asia-Pacific; this is reflective of the high market potential in these regions. Notable examples of recently established vaccine developers (established post-2020, in alphabetical order) include AbVacc, Auro Vaccines, HilleVax, Innovac Therapeutics, Nuravax, Pyrojas and Vernagen.
Rising Partnerships and Collaborations Activity to Foster Progress and Innovation in Expanding their Capabilities
The vaccine development market has witnessed a decent partnership activity in the past few years. Notably, in the last five years, companies based in North America and Europe have inked majority of the partnerships to strengthen their development processes of vaccines. Most of the partnerships signed in this domain are manufacturing agreements, followed by product development agreements. This is indicative of the persistent efforts of vaccine developers to advance their research and development activities for the development of different types of vaccines.
Recent Facility Expansions to Improve Capacity
The vaccine development players have witnessed significant facility expansions to meet growing global demand and advance manufacturing capabilities. In March 2025, Merck opened a USD 1 billion state-of-the-art vaccine manufacturing plant in North Carolina, incorporating cutting-edge technologies, such as AI and 3D printing. Other key players, including Lonza and WuXi Biologics, have also expanded their new mRNA vaccines in development and viral vector vaccine capacities worldwide. These investments emphasize the sector's commitment to increasing production, boosting innovation, and reinforcing supply chains to fulfill future vaccine needs.
Example Players in the Vaccine Development Companies Landscape
- AstraZeneca
- CSL
- GlaxoSmithKline
- Merck
- Pfizer
- Sanofi
- Takeda
Vaccine Development Companies Landscape: Research Coverage
- Market Landscape: An in-depth assessment of the companies involved in the vaccine development market, based on several relevant parameters, such as [A] year of establishment, [B] company size, [C] location of headquarters, [D] purpose of vaccine, [E] type of vaccine [F] type of subunit vaccine, [G] therapeutic area, and [H] type of infectious diseases targeted.
- Recent Expansions: A detailed analysis of the expansion initiatives undertaken in the vaccine development domain, on the basis of [A] year of expansion, [B] type of expansion, [C] location of expanded facility, [D] area of expanded facility, [E] amount invested and [F] purpose of expansion.
- Partnerships and Collaborations: An in-depth analysis of the partnership's activity reported in this domain, based on parameters such as [A] year of partnership, [B] type of partnership [C] type of partner, [D] type of vaccine, [D] therapeutic area and [E] geographical distribution.
- Big Pharma Initiatives: A detailed analysis of big pharma initiatives reported in the domain, on the basis of [A] year of initiative, [B] type of partnership, [C] type of expansion, and [D] type of vaccine focused.
- Cost Price Analysis: An in-depth cost price analysis depicting [A] key historical trends in vaccine production costs, [B] vaccine cost structure, [C] factors influencing vaccine prices, [D] investment considerations associated with vaccines production and [E] cost-saving strategies in vaccine development and manufacturing processes.
Key Questions Answered in this Report
- How many companies are currently engaged in this market?
- Which are the leading companies in this market?
- What factors are likely to influence the evolution of this market?
- How is the current and future market opportunity likely to be distributed across key market segments?
Reasons to Buy this Report
- The report provides a comprehensive market analysis, offering detailed revenue projections of the overall market and its specific sub-segments. This information is valuable to both established market leaders and emerging entrants.
- Stakeholders can leverage the report to gain a deeper understanding of the competitive dynamics within the market. By analyzing the competitive landscape, businesses can make informed decisions to optimize their market positioning and develop effective go-to-market strategies.
- The report offers stakeholders a comprehensive overview of the market, including key drivers, barriers, opportunities, and challenges. This information empowers stakeholders to stay abreast of market trends and make data-driven decisions to capitalize on growth prospects.
Additional Benefits
- Complimentary Excel Data Packs for all Analytical Modules in the Report
- 15% Free Content Customization
- Detailed Report Walkthrough Session with Research Team
- Free Updated report if the report is 6-12 months old or older
TABLE OF CONTENTS
1. BACKGROUND
- 1.1. Context
- 1.2. Project Objectives
2. RESEARCH METHODOLOGY
- 2.1. Chapter Overview
- 2.2. Research Assumptions
- 2.2.1. Market Landscape and Market Trends
- 2.2.2. Market Forecast and Opportunity Analysis
- 2.2.3. Comparative Analysis
- 2.3. Database Building
- 2.3.1. Data Collection
- 2.3.2. Data Validation
- 2.3.3. Data Analysis
- 2.4. Project Methodology
- 2.4.1. Secondary Research
- 2.4.1.1. Annual Reports
- 2.4.1.2. Academic Research Papers
- 2.4.1.3. Company Websites
- 2.4.1.4. Investor Presentations
- 2.4.1.5. Regulatory Filings
- 2.4.1.6. White Papers
- 2.4.1.7. Industry Publications
- 2.4.1.8. Conferences and Seminars
- 2.4.1.9. Government Portals
- 2.4.1.10. Media and Press Releases
- 2.4.1.11. Newsletters
- 2.4.1.12. Industry Databases
- 2.4.1.13. Roots Proprietary Databases
- 2.4.1.14. Paid Databases and Sources
- 2.4.1.15. Social Media Portals
- 2.4.1.16. Other Secondary Sources
- 2.4.2. Primary Research
- 2.4.2.1. Types of Primary Research
- 2.4.2.1.1. Qualitative Research
- 2.4.2.1.2. Quantitative Research
- 2.4.2.1.3. Hybrid Approach
- 2.4.2.2. Advantages of Primary Research
- 2.4.2.3. Techniques for Primary Research
- 2.4.2.3.1. Interviews
- 2.4.2.3.2. Surveys
- 2.4.2.3.3. Focus Groups
- 2.4.2.3.4. Observational Research
- 2.4.2.3.5. Social Media Interactions
- 2.4.2.4. Key Opinion Leaders Considered in Primary Research
- 2.4.2.4.1. Company Executives (CXOs)
- 2.4.2.4.2. Board of Directors
- 2.4.2.4.3. Company Presidents and Vice Presidents
- 2.4.2.4.4. Research and Development Heads
- 2.4.2.4.5. Technical Experts
- 2.4.2.4.6. Subject Matter Experts
- 2.4.2.4.7. Scientists
- 2.4.2.4.8. Doctors and Other Healthcare Providers
- 2.4.2.5. Ethics and Integrity
- 2.4.2.5.1. Research Ethics
- 2.4.2.5.2. Data Integrity
- 2.4.2.1. Types of Primary Research
- 2.4.3. Analytical Tools and Databases
- 2.4.1. Secondary Research
- 2.5. Robust Quality Control
3. MARKET DYNAMICS
- 3.1. Chapter Overview
- 3.2. Forecast Methodology
- 3.2.1. Top-down Approach
- 3.2.2. Bottom-up Approach
- 3.2.3. Hybrid Approach
- 3.3. Market Assessment Framework
- 3.3.1. Total Addressable Market (TAM)
- 3.3.2. Serviceable Addressable Market (SAM)
- 3.3.3. Serviceable Obtainable Market (SOM)
- 3.3.4. Currently Acquired Market (CAM)
- 3.4. Forecasting Tools and Techniques
- 3.4.1. Qualitative Forecasting
- 3.4.2. Correlation
- 3.4.3. Regression
- 3.4.4. Extrapolation
- 3.4.5. Convergence
- 3.4.6. Sensitivity Analysis
- 3.4.7. Scenario Planning
- 3.4.8. Data Visualization
- 3.4.9. Time Series Analysis
- 3.4.10. Forecast Error Analysis
- 3.5. Key Considerations
- 3.5.1. Demographics
- 3.5.2. Government Regulations
- 3.5.3. Reimbursement Scenarios
- 3.5.4. Market Access
- 3.5.5. Supply Chain
- 3.5.6. Industry Consolidation
- 3.5.7. Pandemic / Unforeseen Disruptions Impact
- 3.6. Limitations
4. MACRO-ECONOMIC INDICATORS
- 4.1. Chapter Overview
- 4.2. Market Dynamics
- 4.2.1. Time Period
- 4.2.1.1. Historical Trends
- 4.2.1.2. Current and Forecasted Estimates
- 4.2.2. Currency Coverage
- 4.2.2.1. Major Currencies Affecting the Market
- 4.2.2.2. Factors Affecting Currency Fluctuations
- 4.2.2.3. Impact of Currency Fluctuations on the Industry
- 4.2.3. Foreign Currency Exchange Rate
- 4.2.3.1. Impact of Foreign Exchange Rate Volatility on the Market
- 4.2.3.2. Strategies for Mitigating Foreign Exchange Risk
- 4.2.4. Recession
- 4.2.4.1. Assessment of Current Economic Conditions and Potential Impact on the Market
- 4.2.4.2. Historical Analysis of Past Recessions and Lessons Learnt
- 4.2.5. Inflation
- 4.2.5.1. Measurement and Analysis of Inflationary Pressures in the Economy
- 4.2.5.2. Potential Impact of Inflation on Market Evolution
- 4.2.6. Interest Rates
- 4.2.6.1. Interest Rates and Their Impact on Market
- 4.2.6.2. Strategies for Managing Interest Rate Risk
- 4.2.7. Commodity Flow Analysis
- 4.2.7.1. Type of Commodity
- 4.2.7.2. Origins and Destinations
- 4.2.7.3. Values and Weights
- 4.2.7.4. Modes of Transportation
- 4.2.8. Global Trade Dynamics
- 4.2.8.1. Import Scenario
- 4.2.8.2. Export Scenario
- 4.2.8.3. Trade Policies
- 4.2.8.4. Strategies for Mitigating the Risks Associated with Trade Barriers
- 4.2.8.5. Impact of Trade Barriers on the Market
- 4.2.9. War Impact Analysis
- 4.2.9.1. Russian-Ukraine War
- 4.2.9.2. Israel-Hamas War
- 4.2.10. COVID Impact / Related Factors
- 4.2.10.1. Global Economic Impact
- 4.2.10.2. Industry-specific Impact
- 4.2.10.3. Government Response and Stimulus Measures
- 4.2.10.4. Future Outlook and Adaptation Strategies
- 4.2.11. Other Indicators
- 4.2.11.1. Fiscal Policy
- 4.2.11.2. Consumer Spending
- 4.2.11.3. Gross Domestic Product (GDP)
- 4.2.11.4. Employment
- 4.2.11.5. Taxes
- 4.2.11.6. Stock Market Performance
- 4.2.11.7. Cross-Border Dynamics
- 4.2.1. Time Period
- 4.3. Conclusion
5. EXECUTIVE SUMMARY
6. INTRODUCTION
- 6.1. An Overview of Vaccines
- 6.2. Types of Vaccines
- 6.3. Advantages of Vaccines
- 6.4. Challenges Associated with Vaccines
- 6.5. Future Perspectives
7. MARKET LANDSCAPE
- 7.1. Chapter Overview and Methodology
- 7.2. Key Parameters
- 7.3. Vaccine Developers: Overall Market Landscape
- 7.3.1. Analysis by Year of Establishment
- 7.3.2. Analysis by Company Size
- 7.3.3. Analysis by Stage of Development
- 7.3.4. Analysis by Location of Headquarters
- 7.3.5. Analysis by Company Size and Location of Headquarters
- 7.3.6. Analysis by Purpose of Vaccine
- 7.3.7. Analysis by Type of Vaccine
- 7.3.8. Analysis by Type of Subunit Vaccine
- 7.3.9. Analysis by Therapeutic Area
- 7.3.10. Analysis by Type of Infectious Diseases Targeted
8. RECENT EXPANSIONS
- 8.1. Chapter Overview
- 8.2. Expansion Models
- 8.3. Vaccine Developers: Recent Expansions
- 8.3.1. Analysis by Year of Expansion
- 8.3.2. Analysis by Type of Expansion
- 8.3.3. Analysis by Year and Type of Expansion
- 8.3.4. Analysis by Location of Expanded Facility
- 8.3.5. Analysis by Area of Expanded Facility
- 8.3.6. Analysis by Type of Expansion and Location of Expanded Facility
- 8.3.7. Analysis by Amount Invested
- 8.3.8. Analysis by Type of Expansion and Amount Invested
- 8.3.9. Analysis by Purpose of Expansion
- 8.3.9.1. Most Active Players: Analysis by Number of Initiative
- 8.3.9.2. Most Active Players: Analysis by Amount Invested
9. PARTNERSHIPS AND COLLABORATIONS
- 9.1. Chapter Overview
- 9.2. Partnership Models
- 9.3. Vaccine Developers: Partnerships and Collaborations
- 9.3.1. Analysis by Year of Partnership
- 9.3.2. Analysis by Type of Partnership
- 9.3.3. Analysis by Year and Type of Partnership
- 9.3.4. Analysis by Type of Partner
- 9.3.5. Analysis by Type of Vaccine
- 9.3.6. Analysis by Therapeutic Area
- 9.3.7. Most Active Players: Analysis by Number of Partnerships
- 9.3.8. Analysis by Geography
- 9.3.8.1. Local and International Agreements
- 9.3.8.2. Intracontinental and Intercontinental Agreements
10. BIG PHARMA INITIATIVES
- 10.1. Chapter Overview and Methodology
- 10.2. Key Initiatives and Scoring Criteria
- 10.3. Big Pharma Players: Vaccine-related Initiatives
- 10.3.1. Analysis of Big Pharma Players by Number of Initiatives
- 10.3.2. Analysis by Year of Initiative
- 10.3.3. Analysis of Big Pharma Players by Year and Number of Initiatives
- 10.3.4. Analysis by Type of Initiative
- 10.3.5. Analysis by Year and Type of Initiative
- 10.3.6. Analysis by Type of Partnership
- 10.3.7. Analysis by Type of Expansion
- 10.3.8. Analysis by Type of Vaccine Focused
- 10.3.9. Benchmarking of Initiatives by Big Pharma Players: Spider Web Analysis
11. COST PRICE ANALYSIS
- 11.1. An Overview of Cost and Price Analysis
- 11.2. Key Historical Trends in Vaccine Production Costs
- 11.3. Vaccine Cost Structure
- 11.4. Factors Influencing Vaccine Prices
- 11.5. Investment Considerations Associated with Vaccines Production
- 11.6. Cost Saving Analysis
- 11.6.1. Key Components of Cost Saving Analysis
- 11.6.2. Benefits of Cost Saving Analysis
- 11.7. Cost-Saving Strategies in Vaccine Development and Manufacturing Processes
- 11.7.1. Developers Optimizing R&D and Delivery Systems
- 11.7.2. Manufacturers Adopting Cost-Saving Measures
12. APPENDIX I: TABULATED DATA
13. APPENDIX II: LIST OF COMPANIES AND ORGANIZATIONS
List of Tables
- Table 7.1 Vaccine Developers Market: Vaccine Developers
- Table 8.1 Vaccine Developers Market: Recent Expansions
- Table 9.1 Vaccine Developers Market: Partnerships and Collaborations
- Table 10.1 Big Pharma Players: Vaccine -related Initiatives, since 2023
- Table 12.1 Vaccine Developers: Distribution by Year of Establishment
- Table 12.2 Vaccine Developers: Distribution by Company Size
- Table 12.3 Vaccine Developers: Distribution by Stage of Development
- Table 12.4 Vaccine Developers: Distribution by Year of Establishment
- Table 12.5 Vaccine Developers: Distribution by Location of Headquarters
- Table 12.6 Vaccine Developers: Company Size and Location of Headquarters
- Table 12.7 Vaccine Developers: Distribution by Purpose of Vaccine
- Table 12.8 Vaccine Developers: Distribution by Type of Vaccine
- Table 12.9 Vaccine Developers: Distribution by Type of Subunit Vaccine
- Table 12.10 Vaccine Developers: Distribution by Type of Infectious Diseases Targeted
- Table 12.11 Recent Expansions: Distribution by Year of Expansion, Since 2020
- Table 12.12 Recent Expansions: Distribution by Type of Expansion
- Table 12.13 Recent Expansions: Distribution by Year and Type of Expansion, Since 2020
- Table 12.14 Recent Expansions: Distribution by Location of Expanded Facility
- Table 12.15 Recent Expansions: Distribution by Area of Expanded Facility
- Table 12.16 Recent Expansions: Distribution by Type of Expansion and Location of Expanded Facility
- Table 12.17 Recent Expansions: Distribution by Amount Invested
- Table 12.18 Recent Expansions: Distribution by Type of Expansion and Amount Invested
- Table 12.19 Recent Expansions: Distribution by Purpose of Expansion
- Table 12.20 Most Active Players: Distribution by Distribution by Number of Initiatives
- Table 12.21 Most Active Players: Distribution by Distribution by Amount Invested
- Table 12.22 Partnerships and Collaborations: Distribution by Year of Partnership, Since 2023
- Table 12.23 Partnerships and Collaborations: Distribution by Type of Partnership
- Table 12.24 Partnerships and Collaborations: Distribution by Year and Type of Partnership, Since 2023
- Table 12.25 Partnerships and Collaborations: Distribution by Type of Partner
- Table 12.26 Partnerships and Collaborations: Distribution by Type of Vaccine
- Table 12.27 Partnerships and Collaborations: Distribution by Therapeutic Area
- Table 12.28 Most Active Players: Distribution by Distribution by Number of Partnerships
- Table 12.29 Partnerships and Collaborations: Distribution by Local and International Agreements
- Table 12.30 Partnerships and Collaborations: Distribution by Intracontinental and Intercontinental Agreements
- Table 12.31 Big Pharma Initiatives: Distribution by Number of Initiatives
- Table 12.32 Big Pharma Initiatives: Distribution by Year of Initiative, Since 2023
- Table 12.33 Big Pharma Initiatives: Distribution by Year and Number of Initiative, Since 2023
- Table 12.34 Big Pharma Initiatives: Distribution by Type of Initiative
- Table 12.35 Big Pharma Initiatives: Distribution by Year and Type of Initiative, Since 2023
- Table 12.36 Big Pharma Initiatives: Distribution by Type of Partnership
- Table 12.37 Big Pharma Initiatives: Distribution by Type of Expansion
- Table 12.38 Big Pharma Initiatives: Distribution by Type of Vaccine Focused
List of Figures
- Figure 2.1 Research Methodology: Project Methodology
- Figure 2.2 Research Methodology: Data Sources for Secondary Research
- Figure 2.3 Research Methodology: Robust Quality Control
- Figure 4.1 Historical Analysis of Past Recessions and Lessons Learnt
- Figure 5.1 Executive Summary: Overall Vaccine Developers Market Landscape
- Figure 5.2 Executive Summary: Market Trends
- Figure 6.1 Types of Vaccines
- Figure 6.2 Advantages of Vaccines
- Figure 6.3 Challenges Associated with Vaccines
- Figure 6.4 Future Perspectives
- Figure 7.1 Vaccine Developers: Distribution by Year of Establishment
- Figure 7.2 Vaccine Developers: Distribution by Company Size
- Figure 7.3 Vaccine Developers: Distribution by Stage of Development
- Figure 7.4 Vaccine Developers: Distribution by Year of Establishment
- Figure 7.5 Vaccine Developers: Distribution by Location of Headquarters
- Figure 7.6 Vaccine Developers: Company Size and Location of Headquarters
- Figure 7.7 Vaccine Developers: Distribution by Purpose of Vaccine
- Figure 7.8 Vaccine Developers: Distribution by Type of Vaccine
- Figure 7.9 Vaccine Developers: Distribution by Type of Subunit Vaccine
- Figure 7.10 Vaccine Developers: Distribution by Type of Infectious Diseases Targeted
- Figure 8.1 Recent Expansions: Distribution by Year of Expansion, Since 2020
- Figure 8.2 Recent Expansions: Distribution by Type of Expansion
- Figure 8.3 Recent Expansions: Distribution by Year and Type of Expansion, Since 2020
- Figure 8.4 Recent Expansions: Distribution by Location of Expanded Facility
- Figure 8.5 Recent Expansions: Distribution by Area of Expanded Facility
- Figure 8.6 Recent Expansions: Distribution by Type of Expansion and Location of Expanded Facility
- Figure 8.7 Recent Expansions: Distribution by Amount Invested
- Figure 8.8 Recent Expansions: Distribution by Type of Expansion and Amount Invested
- Figure 8.9 Recent Expansions: Distribution by Purpose of Expansion
- Figure 8.10 Most Active Players: Distribution by Distribution by Number of Initiatives
- Figure 8.11 Most Active Players: Distribution by Distribution by Amount Invested
- Figure 9.1 Partnerships and Collaborations: Distribution by Year of Partnership, Since 2023
- Figure 9.2 Partnerships and Collaborations: Distribution by Type of Partnership
- Figure 9.3 Partnerships and Collaborations: Distribution by Year and Type of Partnership, Since 2023
- Figure 9.4 Partnerships and Collaborations: Distribution by Type of Partner
- Figure 9.5 Partnerships and Collaborations: Distribution by Type of Vaccine
- Figure 9.6 Partnerships and Collaborations: Distribution by Therapeutic Area
- Figure 9.7 Most Active Players: Distribution by Distribution by Number of Partnerships
- Figure 9.8 Partnerships and Collaborations: Distribution by Local and International Agreements
- Figure 9.9 Partnerships and Collaborations: Distribution by Intracontinental and Intercontinental Agreements
- Figure 10.1 Big Pharma Initiatives: Distribution by Number of Initiatives
- Figure 10.2 Big Pharma Initiatives: Distribution by Year of Initiative, Since 2023
- Figure 10.3 Big Pharma Initiatives: Distribution by Year and Number of Initiative, Since 2023
- Figure 10.4 Big Pharma Initiatives: Distribution by Type of Initiative
- Figure 10.5 Big Pharma Initiatives: Distribution by Year and Type of Initiative, Since 2023
- Figure 10.6 Big Pharma Initiatives: Distribution by Type of Partnership
- Figure 10.7 Big Pharma Initiatives: Distribution by Type of Expansion
- Figure 10.8 Big Pharma Initiatives: Distribution by Type of Vaccine Focused
- Figure 10.9 Benchmarking of Initiatives of Big Pharma Players: Spider Web Analysis
- Figure 11.1 Cost Price Analysis: Key Historical Trends in Vaccine Production Costs
- Figure 11.2 Cost Price Analysis: Vaccine Cost Structure
- Figure 11.3 Cost Price Analysis: Factors Influencing Vaccine Prices
- Figure 11.4 Cost Price Analysis: Investment Considerations Associated with Vaccines Production
- Figure 11.5 Cost Price Analysis: Key Components of Cost Saving Analysis
- Figure 11.6 Cost Price Analysis: Benefits of Cost Saving Analysis
- Figure 11.7 Cost Price Analysis: Developers Optimizing R&D and Delivery Systems
- Figure 11.8 Cost Price Analysis: Manufacturers Adopting Cost-Saving Measures

