
PUBLISHER: Roots Analysis | PRODUCT CODE: 1830068

PUBLISHER: Roots Analysis | PRODUCT CODE: 1830068
Anti-Aging Drugs Market: Industry Trends and Global Forecasts, Till 2040: Distribution by Type of Molecule, Type of Aging, and Geographical Regions and Sales Forecast of Drugs
Anti-Aging Drugs Market: Overview
As per Roots Analysis, the anti-aging drugs market is estimated to grow from USD 79 million in the current year to USD 2,807 million by 2040, representing a higher CAGR of 27% during the forecast period.
The market sizing and opportunity analysis has been segmented across the following parameters:
Type of Molecule
- Biologics
- Small Molecules
Type of Aging
- Cellular Aging
- Immune Aging
- Metabolic Aging
- Others
Geographical Regions
- North America
- Europe
- Asia Pacific
- Rest of the World
Anti-Aging Therapeutics Market: Growth and Trends
Researchers and innovators worldwide are focusing their efforts on the development of therapeutics that can extend life expectancy of an individual by targeting the pathophysiology of aging. Numerous start-ups and academic / research institutes globally are exploring a variety of anti-aging therapies at various stages of development. It is worth mentioning that anti-aging drug providing companies are using various methods, such as advancements in rigorous clinical trial services to expedite market approval procedure and incorporation of artificial intelligence to develop better anti-aging drugs. Additionally, technological advancements like organ-on-chip (promising alternative to conventional testing procedures) in the anti-aging domain has resulted in the development of targeted and effective longevity drugs. With the growing geriatric population, the ongoing R&D initiatives and the increasing funding investments, the anti-aging therapeutics market is expected to experience significant growth in the foreseen future.
With the growing geriatric population, the ongoing R&D initiatives and the increasing funding investments, the anti-aging therapeutics market is expected to experience significant growth in the foreseen future.
Anti-Aging Therapeutics Market: Key Insights
The report delves into the current state of the anti-aging therapeutics market and identifies potential growth opportunities within industry. Some key findings from the report include:
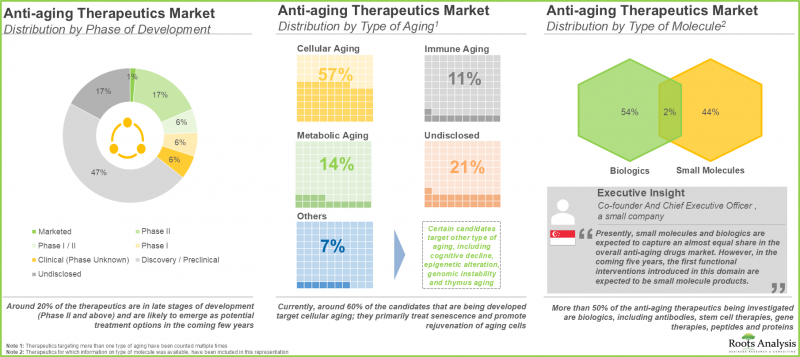
- Presently, more than 65 anti-aging therapeutics are being developed worldwide; majority of the developers are small firms based in North America.
- These therapeutics, ranging from a variety of biologics and small molecules, are currently being investigated across different phases of development.
- More than 55% of partnership agreements were inked in the past two years.
- ~USD 4 billion has been invested by both private and public investors, since 2018
- Over 660 patents related to anti-aging therapeutics have recently been filed / granted, indicating the growing intellectual capital in this domain.
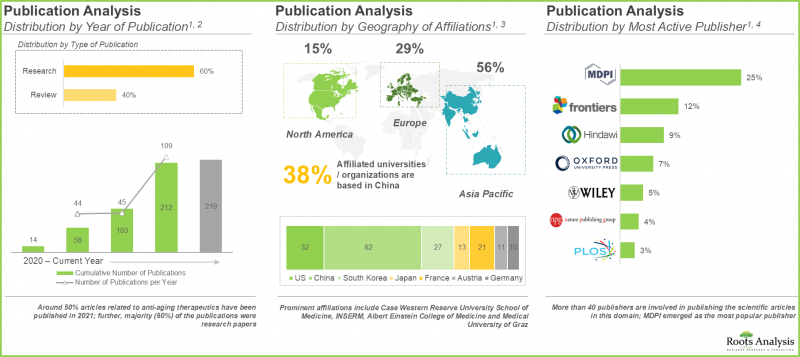
- 230+ articles related to anti-aging therapeutics have been published over the last four years.
- The market is expected to grow at an annualized rate of over 15%; the overall opportunity is anticipated to be well distributed across different types of molecules, types of aging and key geographical regions.
- Europe and Asia Pacific are anticipated to capture more than 75% of the market share, by 2040.
Anti-Aging Therapeutics Market: Key Segments
Small Molecules Holds the Largest Market Share of the Overall Anti-Aging Therapeutics Market
In terms of type of molecule, the anti-aging therapeutics market is segmented across biologics and small molecules. Our estimates suggest that small molecules are likely to capture most of the market share in the current year. Further, this segment is likely to grow at a relatively higher CAGR during the forecast period.
Asia-Pacific is Expected to Propel in the Anti-aging Drugs Market in the Coming Years
In terms of geographical regions, the anti-aging therapeutics market is segmented across North America, Europe, Asia-Pacific and rest of the world. Currently, North America captures the majority of the market, and this trend is likely to remain the same in the future. Further, the market in Asia-Pacific is likely to grow at a relatively higher CAGR during the forecast period.
Example Players in the Anti-aging Therapeutics Market
- AgelessRx
- ANOVA Institute of Regenerative Medicine
- Betterhumans
- BioAge Labs
- bioXcellerator
- Cambrian Biopharma
- Gero.ai, Mayo Clinic
- Rejuvenate Bio
- UT Health San Antonio
Anti-Aging Therapeutics Market: Research Coverage
- Market Sizing and Opportunity Analysis: The report features a thorough analysis of the global anti-aging therapeutics market, in terms of the key market segments, namely [A] type of molecule [B] type of aging, [C] geographical regions and [C] sales forecast of drugs.
- Market Landscape: An in-depth assessment of the companies involved in anti-aging therapeutics market, based on several relevant parameters, such as [A] year of establishment, [B] company size, [C] location of headquarters, [D] phase of development, [E] type of aging, [F] type of molecule, [G] mechanism of action, [H] type of developer.
- Company Competitiveness Analysis: A comprehensive competitive analysis of anti-aging therapeutics market, examining factors, such as [A] developer strength and [B] portfolio strength and [C] portfolio diversity.
- Company Profiles: Detailed profiles of key developers engaged in the anti-aging therapeutics market, focused on [A] overview of the company, [B] financial information (if available), [C] drug portfolio, and [D] recent developments and an informed future outlook.
- Patent Analysis: An insightful analysis of the various patents filed / granted in anti-aging therapeutics market, based on various parameters, such as [A] type of patent [B] patent publication year [C] geography, [D] CPC Symbols, [E] type of applicant, [F] emerging focus area, [G] patent age, [H] patent benchmarking [I] patent characteristics [J] patent valuation.
- Publication Analysis: An insightful analysis of the overall publications reported in this domain, based on various parameters, such as [A] year of publication [B] type of publication and [C] geography.
Key Questions Answered in this Report
- How many companies are currently engaged in this market?
- Which are the leading companies in this market?
- What factors are likely to influence the evolution of this market?
- What is the current and future market size?
- What is the CAGR of this market?
- How is the current and future market opportunity likely to be distributed across key market segments?
Reasons to Buy this Report
- The report provides a comprehensive market analysis, offering detailed revenue projections of the overall market and its specific sub-segments. This information is valuable to both established market leaders and emerging entrants.
- Stakeholders can leverage the report to gain a deeper understanding of the competitive dynamics within the market. By analyzing the competitive landscape, businesses can make informed decisions to optimize their market positioning and develop effective go-to-market strategies.
- The report offers stakeholders a comprehensive overview of the market, including key drivers, barriers, opportunities, and challenges. This information empowers stakeholders to stay abreast of market trends and make data-driven decisions to capitalize on growth prospects.
Additional Benefits
- Complimentary Excel Data Packs for all Analytical Modules in the Report
- 15% Free Content Customization
- Detailed Report Walkthrough Session with Research Team
- Free Updated report if the report is 6-12 months old or older
TABLE OF CONTENTS
1. PREFACE
- 1.1. Introduction
- 1.2. Key Market Insights
- 1.3. Scope of the Report
- 1.4. Research Methodology
- 1.5. Frequently Asked Questions
- 1.6. Chapter Outlines
2. EXECUTIVE SUMMARY
3. INTRODUCTION
- 3.1. Overview of Aging
- 3.2. Types of Aging
- 3.3. Causes of Aging
- 3.4 Mechanism of Action of Anti-aging drugs market
- 3.5 Age-related Diseases
- 3.6 Key Facts Associated with Aging
- 3.7 Future Perspectives of Anti-aging drugs
4. MARKET LANDSCAPE
- 4.1. Anti-aging Drugs: Overall Market Landscape
- 4.1.1. Analysis by Phase of Development
- 4.1.2. Analysis by Type of Aging
- 4.1.3. Analysis by Phase of Development and Type of Aging
- 4.1.4. Analysis by Type of Molecule
- 4.1.5. Analysis by Mechanism of Action
- 4.1.6. Analysis by Type of Developers
- 4.2. Anti-aging Drugs: Developer Landscape
- 4.2.1. Analysis by Year of Establishment
- 4.2.2. Analysis by Company Size and Location of Headquarters
- 4.2.3. Leading Developers by Number of Therapeutics
- 4.2.4. Regional Landscape of Developers
5. COMPANY COMPETITIVENESS ANALYSIS
- 5.1. Chapter Overview
- 5.2. Assumptions and Key Parameters
- 5.3. Methodology
- 5.4. Anti-aging Drugs: Company Competitiveness Analysis
- 5.4.1. Small Companies
- 5.4.2. Mid-sized and Large Companies
6. PARTNERSHIPS AND COLLABORATIONS
- 6.1. Chapter Overview
- 6.2. Anti-aging Drugs: Partnerships and Collaborations
- 6.2.1 Analysis by Year of Partnership
- 6.2.2. Analysis by Type of Partnership
- 6.2.3. Analysis by Year and Type of Partnership
- 6.2.4. Leading Players: Analysis by Number of Partnerships
- 6.2.5. Analysis by Type of Partner
- 6.2.6. Analysis by Type of Agreement
- 6.2.7. Analysis by Region
- 6.2.7.1. Intercontinental and Intracontinental Deals
- 6.2.7.2. International and Local Deals
7. FUNDING AND INVESTMENTS
- 7.1. Chapter Overview
- 7.2. Anti-aging Drugs: Funding and Investments
- 7.2.1. Analysis of Instances by Year
- 7.2.2. Analysis of Amount Invested by Year
- 7.2.3 Analysis of Instances by Type of Funding
- 7.2.4. Analysis of Amount Invested by Type of Funding
- 7.2.5. Analysis by Type of Investor
- 7.2.6. Analysis by Focus Area
- 7.2.7. Analysis of Amount Invested by Region
- 7.2.8. Analysis of Amount Invested by Country
- 7.2.9. Most Active Investors: Analysis by Number of Instances
- 7.2.10. Most Active Players: Analysis by Number of Instances
- 7.2.11. Most Active Players: Analysis by Amount Invested
8. PATENT ANALYSIS
- 8.1. Chapter Overview
- 8.2. Scope and Methodology
- 8.3. Anti-aging Drugs: Patent Analysis
- 8.3.1. Analysis by Type of Patent
- 8.3.2. Analysis by Patent Publication Year
- 8.3.3. Analysis of Granted Patents by Year
- 8.3.4. Analysis by Geography
- 8.3.5. Analysis by CPC Symbols
- 8.3.6. Analysis by Type of Applicant
- 8.3.7. Analysis by Emerging Focus Areas
- 8.3.8. Analysis by Patent Age
- 8.3.9. Leading Industry Players: Analysis by Number of Patents
- 8.3.10. Leading Non-Industry Players: Analysis by Number of Patents
- 8.3.11. Leading Individual Assignees: Analysis by Number of Patents
- 8.4. Anti-aging Drugs: Patent Benchmarking
- 8.4.1. Analysis by Patent Characteristics
- 8.5. Anti-aging Drugs: Patent Valuation
9. PUBLICATION ANALYSIS
- 9.1. Chapter Overview
- 9.2. Scope and Methodology
- 9.3. Anti-aging Drugs: Publication Analysis
- 9.3.1. Analysis by Year of Publication
- 9.3.2. Analysis by Type of Publication
- 9.3.3. Most Popular Journals: Analysis by Number of Publications
- 9.3.4. Most Popular Journals: Analysis by Impact Factor
- 9.3.5. Analysis by Most Popular Keywords
- 9.3.6. Most Popular Funding Institutes: Analysis by Number of Publications
- 9.3.7. Most Active Publisher: Analysis by Number of Publications
- 9.3.8. Most Popular Affiliation: Analysis by Number of Publications
- 9.3.9. Analysis by Geography
10. PORTER'S FIVE FORCES ANALYSIS
- 10.1. Chapter Overview
- 10.2. Methodology and Key Parameters
- 10.3. Porter's Five Forces
- 10.3.1. Threat of New Entrants
- 10.3.2. Bargaining Power of End Users
- 10.3.3. Bargaining Power of Drug Developers
- 10.3.4. Threat of Substitute Products
- 10.3.5. Rivalry Among Existing Competitors
11. COMPANY PROFILES
- 11.1. AgelessRx
- 11.1.1. Company Overview
- 11.1.2. Product Portfolio
- 11.1.3. Recent Developments and Future Outlook
- 11.2. ANOVA Institute for Regenerative Medicine
- 11.2.1. Company Overview
- 11.2.2. Product Portfolio
- 11.2.3. Recent Developments and Future Outlook
- 11.3. Betterhumans
- 11.3.1. Company Overview
- 11.3.2. Product Portfolio
- 11.3.3. Recent Developments and Future Outlook
- 11.4. BioAge Labs
- 11.4.1. Company Overview
- 11.4.2. Product Portfolio
- 11.4.3. Recent Developments and Future Outlook
- 11.5. bioXcellerator
- 11.5.1. Company Overview
- 11.5.2. Product Portfolio
- 11.5.3. Recent Developments and Future Outlook
- 11.6. Cambrian Biopharma
- 11.6.1. Company Overview
- 11.6.2. Product Portfolio
- 11.6.3. Recent Developments and Future Outlook
- 11.7. Gero.ai
- 11.7.1. Company Overview
- 11.7.2. Product Portfolio
- 11.7.3. Recent Developments and Future Outlook
- 11.8. Mayo Clinic
- 11.8.1. Company Overview
- 11.8.2. Product Portfolio
- 11.8.3. Recent Developments and Future Outlook
- 11.9. Rejuvenate Bio
- 11.9.1. Company Overview
- 11.9.2. Product Portfolio
- 11.9.3. Recent Developments and Future Outlook
- 11.10. UT Health San Antonio
- 11.10.1. Company Overview
- 11.10.2. Product Portfolio
- 11.10.3. Recent Developments and Future Outlook
12. MARKET FORECAST AND OPPORTUNITY ANALYSIS
- 12.1. Forecast Methodology and Key Assumptions
- 12.2. Global Anti-aging Drugs Market, 2022-2040
- 12.2.1. Anti-aging Drugs Market: Analysis by Type of Molecule
- 12.2.2. Anti-aging v Market: Analysis by Type of Aging
- 12.2.3. Anti-aging Drugs Market: Analysis by Geography
- 12.2.3.1. Anti-aging Drugs Market in North America, 2022-2040
- 12.2.3.2. Anti-aging Drugs Market in Europe, 2022-2040
- 12.2.3.3. Anti-aging Drugs Market in Asia Pacific, 2022-2040
- 12.2.3.4. Anti-aging Drugs Market in Rest of the World, 2022-2040
- 12.2.4. Anti-aging Drugs: Forecast of Individual Product Sales
- 12.2.4.1. bioXgel (PRP) (bioXcellerator): Estimated Sales Revenues
- 12.2.4.2. AR-100 (Rejenevie Therapeutics): Estimated Sales Revenues
- 12.2.4.3. BGE-117 (BioAge Labs): Estimated Sales Revenues
- 12.2.4.4. Dasatinib and Quercetin (TruDiagnostic): Estimated Sales Revenues
- 12.2.4.5. MYMD-1 (MyMD Pharmaceuticals): Estimated Sales Revenues
- 12.2.4.6. TRIIM Treatment (Intervene Immune): Estimated Sales Revenues
- 12.2.4.7. Rapamycin (AgelessRx): Estimated Sales Revenues
- 12.2.4.8. Sarconeos (BIO101) (Biophytis): Estimated Sales Revenues
13. EXECUTIVE INSIGHTS
- 13.1. Chapter Overview
- 13.2. Gero.ai
- 13.2.1 Company Snapshot
- 13.2.2. Interview Transcript: Co-founder and Chief Executive Officer
- 13.3. Betterhumans
- 13.3.1. Company Snapshot
- 13.3.2. Interview Transcript: President
- 13.4. CytoMed Therapeutics
- 13.4.1. Company Snapshot
- 13.4.2. Interview Transcript: Chief Operating Officer
- 13.5. Cambrian Biopharma
- 13.5.1 Company Snapshot
- 13.5.2. Interview Transcript: Senior Director of Global Corporate Communications
- 13.6. Landmark Medical Centre
- 13.6.1 Company Snapshot
- 13.6.2. Interview Transcript: Director and Consultant Obstetrician and Gynaecologist
14. APPENDIX I: TABULATED DATA
15. APPENDIX I1: LIST OF COMAPANIES AND ORGANIZATIONS
List of Tables
- Table 4.1 List of Anti-aging Drugs
- Table 4.2 List of Anti-aging Drugs Developers
- Table 6.1 Anti-aging Drugs: List of Partnerships and Collaborations
- Table 7.1 Anti-aging Drugs: List of Funding and Investments
- Table 8.1 Anti-aging Drugs: List of Patents
- Table 8.2 Patent Analysis: Categorization based on Weighted Valuation Scores
- Table 9.1 Anti-aging Drugs: List of Publications
- Table 11.1 AgelessRx: Product Portfolio
- Table 11.2 AgelessRx: Recent Developments and Future Outlook
- Table 11.3 ANOVA Institute for Regenerative Medicine: Product Portfolio
- Table 11.4 Betterhumans: Product Portfolio
- Table 11.5 Betterhumans: Recent Developments and Future Outlook
- Table 11.6 BioAge Labs: Product Portfolio
- Table 11.7 BioAge Labs: Recent Developments and Future Outlook
- Table 11.8 bioXcellerator: Product Portfolio
- Table 11.9 Cambrian Biopharma: Product Portfolio
- Table 11.10 Cambrian Biopharma: Recent Developments and Future Outlook
- Table 11.11 Gero.ai: Product Portfolio
- Table 11.12 Gero.ai: Recent Developments and Future Outlook
- Table 11.13 Mayo Clinic: Product Portfolio
- Table 11.14 Mayo Clinic: Recent Developments and Future Outlook
- Table 11.15 Rejuvenate Bio: Product Portfolio
- Table 11.16 Rejuvenate Bio: Recent Developments and Future Outlook
- Table 11.17 UT Health San Antonio: Product Portfolio
- Table 11.18 UT Health San Antonio: Recent Developments and Future Outlook
- Table 14.1 Market Landscape: Distribution by Phase of Development
- Table 14.2 Market Landscape: Distribution by Type of Aging
- Table 14.3 Market Landscape: Distribution by Phase of Development and Type of Aging
- Table 14.4 Market Landscape: Distribution by Type of Molecule
- Table 14.5 Market Landscape: Distribution by Mechanism of Action
- Table 14.6 Developer Landscape: Distribution by Type of Developers
- Table 14.7 Developer Landscape: Distribution by Year of Establishment
- Table 14.8 Developer Landscape: Distribution by Company Size and Location of Headquarters
- Table 14.9 Leading Developers: Distribution by Number of Therapeutics
- Table 14.10 Partnerships and Collaborations: Distribution by Year of Partnership
- Table 14.11 Partnerships and Collaborations: Distribution by Type of Partnership
- Table 14.12 Partnerships and Collaborations: Distribution by Year and Type of Partnership
- Table 14.13 Leading Players: Distribution by Number of Partnerships
- Table 14.14 Partnerships and Collaborations: Distribution by Type of Partner
- Table 14.15 Partnerships and Collaborations: Distribution by Type of Agreement
- Table 14.16 Partnerships and Collaborations: Intercontinental and Intracontinental Deals
- Table 14.17 Partnerships and Collaborations: International and Local Deals
- Table 14.18 Funding and Investments: Distribution of Instances by Year
- Table 14.19 Funding and Investments: Distribution of Amount Invested by Year
- Table 14.20 Funding and Investments: Year-wise Distribution of Amount Invested by Type of Funding
- Table 14.21 Funding and Investments: Distribution of Instances by Type of Funding
- Table 14.22 Funding and Investments: Distribution of Amount Invested by Type of Funding
- Table 14.23 Funding and Investments: Distribution by Type of Investor
- Table 14.24 Funding and Investments: Distribution by Focus Area
- Table 14.25 Funding and Investments: Distribution of Amount Invested by Region
- Table 14.26 Funding and Investments: Distribution of Amount Invested by Country
- Table 14.27 Most Active Investors: Distribution by Number of Instances
- Table 14.28 Most Active Players: Distribution by Number of Instances
- Table 14.29 Most Active Players: Distribution by Amount Invested
- Table 14.30 Patent Analysis: Distribution by Type of Patent
- Table 14.31 Patent Analysis: Distribution by Patent Publication Year
- Table 14.32 Patent Analysis: Distribution of Granted Patents by Year
- Table 14.33 Patent Analysis: Distribution by Geography
- Table 14.34 Patent Analysis: Distribution by Type of Applicant
- Table 14.35 Patent Analysis: Distribution by Patent Age
- Table 14.36 Leading Industry Players: Distribution by Number of Patents
- Table 14.37 Leading Non-Industry Players: Distribution by Number of Patents
- Table 14.38 Leading Individual Assignees: Distribution by Number of Patents
- Table 14.39 Anti-aging Drugs: Patent Valuation
- Table 14.40 Publication Analysis: Distribution by Year of Publication
- Table 14.41 Publication Analysis: Distribution by Type of Publication
- Table 14.42 Most Popular Journals: Distribution by Number of Publications
- Table 14.43 Most Popular Journals: Distribution by Impact Factor
- Table 14.44 Most Popular Funding Institutes: Distribution by Number of Publications
- Table 14.45 Most Active Publisher: Distribution by Number of Publications
- Table 14.46 Most Popular Affiliation: Distribution by Number of Publications
- Table 14.47 Publication Analysis: Distribution by Geography
- Table 14.48 Global Anti-aging Drugs Market, Conservative, Base and Optimistic Scenarios, 2035-2040 (USD Million)
- Table 14.49 Anti-aging Drugs Market: Distribution by Type of Molecule, 2022 and 2040 (USD Million)
- Table 14.50 Anti-aging Drugs Market: Distribution by Type of Aging, 2022 and 2040 (USD Million)
- Table 14.51 Anti-aging Drugs Market: Distribution by Geography, 2022 and 2040 (USD Million)
- Table 14.52 Anti-aging Drugs Market in North America, 2022-2040 (USD Million)
- Table 14.53 Anti-aging Drugs Market in Europe, 2022-2040 (USD Million)
- Table 14.54 Anti-aging Drugs Market in Asia Pacific, 2022-2040 (USD Million)
- Table 14.55 Anti-aging Drugs Market in Rest of the World, 2022-2040 (USD Million)
- Table 14.56 bioXgel (PRP) (bioXcellerator): Sales Forecast, Conservative, Base and Optimistic Scenarios, till 2040 (USD Million)
- Table 14.57 AR-100 (Rejenevie Therapeutics): Sales Forecast, Conservative, Base and Optimistic Scenarios, till 2040 (USD Million)
- Table 14.58 BGE-117 (BioAge Labs): Sales Forecast, Conservative, Base and Optimistic Scenarios, till 2040 (USD Million)
- Table 14.59 Dasatinib and Quercetin (TruDiagnostic): Sales Forecast, Conservative, Base and Optimistic Scenarios, till 2040 (USD Million)
- Table 14.60 MYMD-1 (MyMD Pharmaceuticals): Sales Forecast, Conservative, Base and Optimistic Scenarios, till 2040 (USD Million)
- Table 14.61 TRIIM Treatment (Intervene Immune): Sales Forecast, Conservative, Base and Optimistic Scenarios, till 2040 (USD Million)
- Table 14.62 Rapamycin (AgelessRx): Sales Forecast, Conservative, Base and Optimistic Scenarios, till 2040 (USD Million)
- Table 14.63 Sarconeos (BIO101) (Biophytis): Sales Forecast, Conservative, Base and Optimistic Scenarios, till 2040 (USD Million)
List of Figures
- Figure 2.1 Executive Summary: Overall Market Landscape
- Figure 2.2 Executive Summary: Partnerships and Collaborations
- Figure 2.3 Executive Summary: Funding and Investment Analysis
- Figure 2.4 Executive Summary: Patent Analysis
- Figure 2.5 Executive Summary: Publication Analysis
- Figure 2.6 Executive Summary: Market Forecast
- Figure 3.1 Types of Aging
- Figure 3.2 Causes of Aging
- Figure 3.3 Mechanism of Action of Anti-aging Drugs
- Figure 3.4 Age-related Diseases
- Figure 4.1 Anti-aging Drugs: Distribution by Phase of Development
- Figure 4.2 Anti-aging Drugs: Distribution by Type of Aging
- Figure 4.3 Anti-aging Drugs: Distribution by Phase of Development and Type of Aging
- Figure 4.4 Anti-aging Drugs: Distribution by Type of Molecule
- Figure 4.5 Anti-aging Drugs: Distribution by Mechanism of Action
- Figure 4.6 Anti-aging Drugs Developers: Distribution by Type of Developers
- Figure 4.7 Anti-aging Drugs Developers: Distribution by Year of Establishment
- Figure 4.8 Anti-aging Therapeutics Developers: Distribution by Company Size and Location of Headquarters
- Figure 4.9 Leading Developers: Distribution by Number of Therapeutics
- Figure 4.10 Anti-aging Drugs Developers: Regional Landscape
- Figure 5.1 Company Competitiveness Analysis: Small Companies
- Figure 5.2 Company Competitiveness Analysis: Mid-sized and Large Companies
- Figure 6.1 Partnerships and Collaborations: Distribution by Year of Partnership
- Figure 6.2 Partnerships and Collaborations: Distribution by Type of Partnership
- Figure 6.3 Partnerships and Collaborations: Distribution by Year and Type of Partnership
- Figure 6.4 Leading Players: Distribution by Number of Partnerships
- Figure 6.5 Partnerships and Collaborations: Distribution by Type of Partner
- Figure 6.6 Partnerships and Collaborations: Distribution by Type of Agreement
- Figure 6.7 Partnerships and Collaborations: Intercontinental and Intracontinental Deals
- Figure 6.8 Partnerships and Collaborations: International and Local Deals
- Figure 7.1 Funding and Investments: Distribution of Instances by Year
- Figure 7.2 Funding and Investments: Distribution of Amount Invested by Year
- Figure 7.3 Funding and Investments: Year-wise Distribution of Amount Invested by Type of Funding
- Figure 7.4 Funding and Investments: Distribution of Instances by Type of Funding
- Figure 7.5 Funding and Investments: Distribution of Amount Invested by Type of Funding
- Figure 7.6 Funding and Investments: Distribution by Type of Investor
- Figure 7.7 Funding and Investments: Distribution by Focus Area
- Figure 7.8 Funding and Investments: Distribution of Amount Invested by Region
- Figure 7.9 Funding and Investments: Distribution of Amount Invested by Country
- Figure 7.10 Most Active Investors: Distribution by Number of Instances
- Figure 7.11 Most Active Players: Distribution by Number of Instances
- Figure 7.12 Most Active Players: Distribution by Amount Invested
- Figure 8.1 Patent Analysis: Distribution by Type of Patent
- Figure 8.2 Patent Analysis: Distribution by Patent Publication Year
- Figure 8.3 Patent Analysis: Distribution of Granted Patents by Year
- Figure 8.4 Patent Analysis: Distribution by Geography
- Figure 8.5 Patent Analysis: Distribution by CPC Symbols
- Figure 8.6 Patent Analysis: Distribution by Type of Applicant
- Figure 8.7 Patent Analysis: Emerging Focus Area
- Figure 8.8 Patent Analysis: Distribution by Patent Age
- Figure 8.9 Leading Industry Players: Distribution by Number of Patents
- Figure 8.10 Leading Non-Industry Players: Distribution by Number of Patents
- Figure 8.11 Leading Individual Assignees: Distribution by Number of Patents
- Figure 8.12 Patent Benchmarking: Distribution of Leading Industry Players by Patent Characteristics (CPC Symbols)
- Figure 8.13 Anti-aging Drugs: Patent Valuation
- Figure 9.1 Publication Analysis: Distribution by Year of Publication
- Figure 9.2 Publication Analysis: Distribution by Type of Publication
- Figure 9.3 Most Popular Journals: Distribution by Number of Publications
- Figure 9.4 Most Popular Journals: Distribution by Impact Factor
- Figure 9.5 Publication Analysis: Most Popular Keywords
- Figure 9.6 Most Popular Funding Institutes: Distribution by Number of Publications
- Figure 9.7 Most Active Publisher: Distribution by Number of Publications
- Figure 9.8 Most Popular Affiliation: Distribution by Number of Publications
- Figure 9.9 Publication Analysis: Distribution by Geography
- Figure 10.1 Anti-aging Drugs: Porter's Five Forces Analysis
- Figure 12.1 Global Anti-aging Drugs Market, 2035-2040 (USD Million)
- Figure 12.2 Anti-aging Drugs Market: Distribution by Type of Molecule, 2022 and 2040 (USD Million)
- Figure 12.3 Anti-aging Drugs Market: Distribution by Type of Aging, 2022 and 2040 (USD Million)
- Figure 12.4 Anti-aging Drugs Market: Distribution by Geography, 2022 and 2040 (USD Million)
- Figure 12.5 Anti-aging Drugs Market in North America, 2022-2040 (USD Million)
- Figure 12.6 Anti-aging Drugs Market in Europe, 2022-2040 (USD Million)
- Figure 12.7 Anti-aging Drugs Market in Asia Pacific, 2022-2040 (USD Million)
- Figure 12.8 Anti-aging Drugs Market in Rest of the World, 2022-2040 (USD Million)
- Figure 12.9 bioXgel (PRP) (bioXcellerator): Sales Forecast, Conservative, Base and Optimistic Scenarios, till 2040 (USD Million)
- Figure 12.10 AR-100 (Rejenevie Therapeutics): Sales Forecast, Conservative, Base and Optimistic Scenarios, till 2040 (USD Million)
- Figure 12.11 BGE-117 (BioAge Labs): Sales Forecast, Conservative, Base and Optimistic Scenarios, till 2040 (USD Million)
- Figure 12.12 Dasatinib and Quercetin (TruDiagnostic): Sales Forecast, Conservative, Base and Optimistic Scenarios, till 2040 (USD Million)
- Figure 12.13 MYMD-1 (MyMD Pharmaceuticals): Sales Forecast, Conservative, Base and Optimistic Scenarios, till 2040 (USD Million)
- Figure 12.14 TRIIM Treatment (Intervene Immune): Sales Forecast, Conservative, Base and Optimistic Scenarios, till 2040 (USD Million)
- Figure 12.15 Rapamycin (AgelessRx): Sales Forecast, Conservative, Base and Optimistic Scenarios, till 2040 (USD Million)
- Figure 12.16 Sarconeos (BIO101) (Biophytis): Sales Forecast, Conservative, Base and Optimistic Scenarios, till 2040 (USD Million)

