
PUBLISHER: Roots Analysis | PRODUCT CODE: 1836224

PUBLISHER: Roots Analysis | PRODUCT CODE: 1836224
Pea Starch Market Till 2035: Distribution by Type of Source, Type of Grade, Areas of Application, Type of Function, Type of Modification Method, Type of Form, Company Size, and Key Geographical Regions: Industry Trends and Global Forecasts
Pea Starch Market Overview
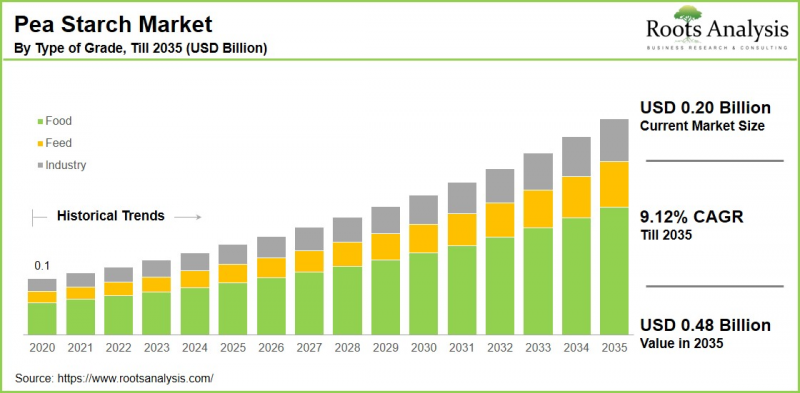
As per Roots Analysis, the global pea starch market size is estimated to grow from USD 0.20 billion in the current year USD 0.48 billion by 2035, at a CAGR of 9.12% during the forecast period, till 2035.
The opportunity for pea starch market has been distributed across the following segments:
Type of Source
- Inorganic
- Organic
Type of Grade
- Feed
- Food
- Industrial
Areas of Application
- Animal Feed and Pet Food
- Food and Beverage
- Personal Care and Cosmetics
Type of Function
- Binding & Thickening
- Film Forming
- Gelling
- Texturizing
Type of Modification Methods
- Chemical Modification
- Physical Modification
Type of Form
- Liquid
- Power
Company Size
- Large Enterprises
- Small and Medium Enterprises
Geographical Regions
- North America
- US
- Canada
- Mexico
- Other North American countries
- Europe
- Austria
- Belgium
- Denmark
- France
- Germany
- Ireland
- Italy
- Netherlands
- Norway
- Russia
- Spain
- Sweden
- Switzerland
- UK
- Other European countries
- Asia
- China
- India
- Japan
- Singapore
- South Korea
- Other Asian countries
- Latin America
- Brazil
- Chile
- Colombia
- Venezuela
- Other Latin American countries
- Middle East and North Africa
- Egypt
- Iran
- Iraq
- Israel
- Kuwait
- Saudi Arabia
- UAE
- Other MENA countries
- Rest of the World
- Australia
- New Zealand
- Other countries
Pea Starch Market: Growth and Trends
Pea starch is a polysaccharide that serves as a carbohydrate reserve and is extensively utilized across various sectors, including food and beverages, animal feed, pharmaceuticals, cosmetics, textiles, and more. Dried peas are also utilized for the extraction of pea protein and starch. The starch obtained from dried peas possesses a range of functional characteristics that can be applied in multiple uses. Pea starch is differentiated from other native starches by its elevated amylose content within the granules. Consequently, pea starch exhibits a strong gelling capacity, enabling it to form gels in water at significantly lower quantities compared to other starches, making it an excellent choice for gelling applications.
One of the key drivers of market growth is the changing dietary trends, particularly the increase in vegetarian and vegan diets influenced by health issues, ethical concerns, and the growing need for sustainable food additives. As more consumers shift towards alternative protein sources and plant-based products, there is an increasing demand for ingredients such as pea starch that meet these trends and provide unique functional benefits for food production.
Additionally, its gelling, thickening, and texturizing attributes render it suitable for use in pharmaceuticals and nutraceuticals, particularly for forming films and coating tablets and capsules. Moreover, extracts derived from peas are incorporated into personal care and cosmetic products, further enhancing the growth of the market.
Pea starch Market: Key Segments
Market Share by Type of Source
Based on type of source, the global pea starch market is segmented into inorganic and organic. According to our estimates, currently, the organic pea starch segment captures the majority of the market share, due to the rising consumer inclination towards natural and chemical-free products. Additionally, this can be attributed to the growing awareness of health and environmental concerns linked to synthetic chemicals, resulting in an increased demand for organic products across multiple sectors, including food and beverages, as well as cosmetics and personal care.
Conversely, the inorganic segment is expected to grow at a relatively higher CAGR during the forecast period. This increase is driven by technological advancements and the creation of new, efficient inorganic compounds that provide enhanced performance and cost advantages. Sectors such as agriculture, pharmaceuticals, and construction are progressively embracing inorganic products to improve productivity and comply with stringent regulatory requirements, thereby driving market growth.
Market Share by Type of Grade
Based on type of grade, the global pea starch market is segmented into feed, food and industrial. According to our estimates, currently, the food segment captures the majority of the market share. This growth is fueled by the utilization of pea starch in various food products, including baked goods, sauces, soups, dairy products, and snacks.
Further, the growing health awareness among consumers has spurred a higher demand for natural and functional ingredients. Pea starch is viewed as a healthier option compared to synthetic additives and gluten-containing components, making it particularly attractive for consumers with specific dietary needs.
Market Share by Areas of Application
Based on areas of application, the global pea starch market is segmented into animal feed and pet food, food and beverage, personal care and cosmetics. According to our estimates, currently, the food and beverage segment captures the majority of the market share. Additionally, this segment is expected to grow at a relatively higher CAGR during the forecast period. This growth can be attributed to the widespread use of pea starch as a natural thickening agent, stabilizer, and emulsifier in various products such as sauces, soups, dairy alternatives, and gluten-free baked goods.
Market Share by Types of Function
Based on types of function, the global pea starch market is segmented binding and thickening, film forming, gelling and texturizing. According to our estimates, currently, the binding and thickening segment captures the majority of the market share. This growth can be attributed to the extensive use of binding and thickening agents across numerous sectors, particularly in food and beverages. These agents play a crucial role in enhancing the texture, consistency, and stability of products, making them indispensable in the formulation of a variety of consumer goods.
Conversely, the gelling category is projected to experience the highest CAGR during the forecast period. This increase is driven by the rising demand for novel food items that offer distinctive textures and sensory experiences, especially within the confectionery and dairy sectors.
Market Share by Type of Modification Method
Based on type of modification method, the global pea starch market is segmented into chemical modification and physical modification. According to our estimates, currently, the chemical modification segment captures the majority of the market share, owing to the superior functional properties that chemically altered pea starch offers, such as enhanced stability, texture, and performance across different applications. Chemical modifications facilitate a wider array of functionalities, making it ideal for various uses in food products, pharmaceuticals, and industrial applications.
Conversely, the physical modification segment is projected to experience the highest CAGR during the forecast period. This growth is linked to the rising demand for clean-label products and a growing consumer preference for minimally processed ingredients.
Market Share by Type of Form
Based on type of form, the global pea starch market is segmented into liquid and powder. According to our estimates, currently, the powder segment captures the majority of the market share. This increase can be attributed to its versatility and convenience in a variety of applications. Powdered pea starch is extensively used in the food and beverage sector as a thickening, stabilizing, and gelling agent in items like soups, sauces, baked goods, and snacks.
Conversely, the liquid segment is projected to experience the highest CAGR during the forecast period. This growth is linked to its uses in sectors like textiles, adhesives, and paper production, where a thick and adhesive solution is necessary. Further, advancements in liquid formulations that enhance viscosity and rheological properties are increasing its attractiveness to industrial consumers.
Market Share by Company Size
Based on company size, the global pea starch market is segmented into large and small and medium enterprise. According to our estimates, currently, the large enterprises capture the majority of the market share. In contrast, the small and medium enterprise segments are expected to experience a comparatively higher growth rate during the forecast period. This can be attributed to their agility, innovative approaches, focus on niche markets, and capacity to respond to evolving customer preferences and market dynamics.
Market Share by Geographical Regions
Based on geographical regions, the pea starch market is segmented into North America, Europe, Asia, Latin America, Middle East and North Africa, and the rest of the world. According to our estimates, currently, North America captures the majority share of the market. This can be attributed to a significant trend towards healthier eating habits and an increasing awareness of the advantages associated with a diet rich in plant-based and gluten-free pea starch products. The food and beverage sector in North America is concentrating on introducing innovative types of plant-based foods, which is further establishing pea starch as a key ingredient in a variety of food items, driving market growth in this region.
Example Players in Pea Starch Market
- Agridient.nl
- AGT Food and Ingredients
- American Key Food Products
- Axiom Foods
- Cosucra Groupe
- Cargill
- Dakota Dry Bean
- Emsland
- EMFOOD TRADING
- Healy
- Ingredion
- Inner Mongolia Qiaqia Food
- Meelunie
- NISCO
- Nutri-Pea
- Parrheim Foods
- Prairie Fava
- Puris
- Qingdao CBH
- Roquette Freres
- Royal Ingredients
- Sanstar Bio-Polymers
- Scoular
- Shandong Jianyuan
- Tereos
- Vestkorn Milling
- Yantai Oriental Protein
- Yantai Shuangta Food
Pea Starch Market: Research Coverage
The report on the pea starch market features insights on various sections, including:
- Market Sizing and Opportunity Analysis: An in-depth analysis of the pea starch market, focusing on key market segments, including [A] type of source, [B] type of grade, [C] areas of application, [D] type of function, [E] type of modification method, [F] type of form, [G] company size, and [H] key geographical regions.
- Competitive Landscape: A comprehensive analysis of the companies engaged in the pea starch market, based on several relevant parameters, such as [A] year of establishment, [B] company size, [C] location of headquarters and [D] ownership structure.
- Company Profiles: Elaborate profiles of prominent players engaged in the pea starch market, providing details on [A] location of headquarters, [B] company size, [C] company mission, [D] company footprint, [E] management team, [F] contact details, [G] financial information, [H] operating business segments, [I] Pea starch portfolio, [J] moat analysis, [K] recent developments, and an informed future outlook.
- Megatrends: An evaluation of ongoing megatrends in the pea starch industry.
- Patent Analysis: An insightful analysis of patents filed / granted in the pea starch domain, based on relevant parameters, including [A] type of patent, [B] patent publication year, [C] patent age and [D] leading players.
- Recent Developments: An overview of the recent developments made in the pea starch market, along with analysis based on relevant parameters, including [A] year of initiative, [B] type of initiative, [C] geographical distribution and [D] most active players.
- Porter's Five Forces Analysis: An analysis of five competitive forces prevailing in the pea starch market, including threats of new entrants, bargaining power of buyers, bargaining power of suppliers, threats of substitute products and rivalry among existing competitors.
- SWOT Analysis: An insightful SWOT framework, highlighting the strengths, weaknesses, opportunities and threats in the domain. Additionally, it provides Harvey ball analysis, highlighting the relative impact of each SWOT parameter.
- Value Chain Analysis: A comprehensive analysis of the value chain, providing information on the different phases and stakeholders involved in the pea starch market.
Key Questions Answered in this Report
- How many companies are currently engaged in pea starch market?
- Which are the leading companies in this market?
- What factors are likely to influence the evolution of this market?
- What is the current and future market size?
- What is the CAGR of this market?
- How is the current and future market opportunity likely to be distributed across key market segments?
Reasons to Buy this Report
- The report provides a comprehensive market analysis, offering detailed revenue projections of the overall market and its specific sub-segments. This information is valuable to both established market leaders and emerging entrants.
- Stakeholders can leverage the report to gain a deeper understanding of the competitive dynamics within the market. By analyzing the competitive landscape, businesses can make informed decisions to optimize their market positioning and develop effective go-to-market strategies.
- The report offers stakeholders a comprehensive overview of the market, including key drivers, barriers, opportunities, and challenges. This information empowers stakeholders to stay abreast of market trends and make data-driven decisions to capitalize on growth prospects.
Additional Benefits
- Complimentary Excel Data Packs for all Analytical Modules in the Report
- 15% Free Content Customization
- Detailed Report Walkthrough Session with Research Team
- Free Updated report if the report is 6-12 months old or older
TABLE OF CONTENTS
SECTION I: REPORT OVERVIEW
1. PREFACE
- 1.1. Introduction
- 1.2. Market Share Insights
- 1.3. Key Market Insights
- 1.4. Report Coverage
- 1.5. Key Questions Answered
- 1.6. Chapter Outlines
2. RESEARCH METHODOLOGY
- 2.1. Chapter Overview
- 2.2. Research Assumptions
- 2.3. Database Building
- 2.3.1. Data Collection
- 2.3.2. Data Validation
- 2.3.3. Data Analysis
- 2.4. Project Methodology
- 2.4.1. Secondary Research
- 2.4.1.1. Annual Reports
- 2.4.1.2. Academic Research Papers
- 2.4.1.3. Company Websites
- 2.4.1.4. Investor Presentations
- 2.4.1.5. Regulatory Filings
- 2.4.1.6. White Papers
- 2.4.1.7. Industry Publications
- 2.4.1.8. Conferences and Seminars
- 2.4.1.9. Government Portals
- 2.4.1.10. Media and Press Releases
- 2.4.1.11. Newsletters
- 2.4.1.12. Industry Databases
- 2.4.1.13. Roots Proprietary Databases
- 2.4.1.14. Paid Databases and Sources
- 2.4.1.15. Social Media Portals
- 2.4.1.16. Other Secondary Sources
- 2.4.2. Primary Research
- 2.4.2.1. Introduction
- 2.4.2.2. Types
- 2.4.2.2.1. Qualitative
- 2.4.2.2.2. Quantitative
- 2.4.2.3. Advantages
- 2.4.2.4. Techniques
- 2.4.2.4.1. Interviews
- 2.4.2.4.2. Surveys
- 2.4.2.4.3. Focus Groups
- 2.4.2.4.4. Observational Research
- 2.4.2.4.5. Social Media Interactions
- 2.4.2.5. Stakeholders
- 2.4.2.5.1. Company Executives (CXOs)
- 2.4.2.5.2. Board of Directors
- 2.4.2.5.3. Company Presidents and Vice Presidents
- 2.4.2.5.4. Key Opinion Leaders
- 2.4.2.5.5. Research and Development Heads
- 2.4.2.5.6. Technical Experts
- 2.4.2.5.7. Subject Matter Experts
- 2.4.2.5.8. Scientists
- 2.4.2.5.9. Doctors and Other Healthcare Providers
- 2.4.2.6. Ethics and Integrity
- 2.4.2.6.1. Research Ethics
- 2.4.2.6.2. Data Integrity
- 2.4.3. Analytical Tools and Databases
- 2.4.1. Secondary Research
3. MARKET DYNAMICS
- 3.1. Forecast Methodology
- 3.1.1. Top-Down Approach
- 3.1.2. Bottom-Up Approach
- 3.1.3. Hybrid Approach
- 3.2. Market Assessment Framework
- 3.2.1. Total Addressable Market (TAM)
- 3.2.2. Serviceable Addressable Market (SAM)
- 3.2.3. Serviceable Obtainable Market (SOM)
- 3.2.4. Currently Acquired Market (CAM)
- 3.3. Forecasting Tools and Techniques
- 3.3.1. Qualitative Forecasting
- 3.3.2. Correlation
- 3.3.3. Regression
- 3.3.4. Time Series Analysis
- 3.3.5. Extrapolation
- 3.3.6. Convergence
- 3.3.7. Forecast Error Analysis
- 3.3.8. Data Visualization
- 3.3.9. Scenario Planning
- 3.3.10. Sensitivity Analysis
- 3.4. Key Considerations
- 3.4.1. Demographics
- 3.4.2. Market Access
- 3.4.3. Reimbursement Scenarios
- 3.4.4. Industry Consolidation
- 3.5. Robust Quality Control
- 3.6. Key Market Segmentations
- 3.7. Limitations
4. MACRO-ECONOMIC INDICATORS
- 4.1. Chapter Overview
- 4.2. Market Dynamics
- 4.2.1. Time Period
- 4.2.1.1. Historical Trends
- 4.2.1.2. Current and Forecasted Estimates
- 4.2.2. Currency Coverage
- 4.2.2.1. Overview of Major Currencies Affecting the Market
- 4.2.2.2. Impact of Currency Fluctuations on the Industry
- 4.2.3. Foreign Exchange Impact
- 4.2.3.1. Evaluation of Foreign Exchange Rates and Their Impact on Market
- 4.2.3.2. Strategies for Mitigating Foreign Exchange Risk
- 4.2.4. Recession
- 4.2.4.1. Historical Analysis of Past Recessions and Lessons Learnt
- 4.2.4.2. Assessment of Current Economic Conditions and Potential Impact on the Market
- 4.2.5. Inflation
- 4.2.5.1. Measurement and Analysis of Inflationary Pressures in the Economy
- 4.2.5.2. Potential Impact of Inflation on the Market Evolution
- 4.2.6. Interest Rates
- 4.2.6.1. Overview of Interest Rates and Their Impact on the Market
- 4.2.6.2. Strategies for Managing Interest Rate Risk
- 4.2.7. Commodity Flow Analysis
- 4.2.7.1. Type of Commodity
- 4.2.7.2. Origins and Destinations
- 4.2.7.3. Values and Weights
- 4.2.7.4. Modes of Transportation
- 4.2.8. Global Trade Dynamics
- 4.2.8.1. Import Scenario
- 4.2.8.2. Export Scenario
- 4.2.9. War Impact Analysis
- 4.2.9.1. Russian-Ukraine War
- 4.2.9.2. Israel-Hamas War
- 4.2.10. COVID Impact / Related Factors
- 4.2.10.1. Global Economic Impact
- 4.2.10.2. Industry-specific Impact
- 4.2.10.3. Government Response and Stimulus Measures
- 4.2.10.4. Future Outlook and Adaptation Strategies
- 4.2.11. Other Indicators
- 4.2.11.1. Fiscal Policy
- 4.2.11.2. Consumer Spending
- 4.2.11.3. Gross Domestic Product (GDP)
- 4.2.11.4. Employment
- 4.2.11.5. Taxes
- 4.2.11.6. R&D Innovation
- 4.2.11.7. Stock Market Performance
- 4.2.11.8. Supply Chain
- 4.2.11.9. Cross-Border Dynamics
- 4.2.1. Time Period
SECTION II: QUALITATIVE INSIGHTS
5. EXECUTIVE SUMMARY
6. INTRODUCTION
- 6.1. Chapter Overview
- 6.2. Overview of Pea Starch Market
- 6.2.1. Type of Source
- 6.2.2. Types of Grades
- 6.2.3. Areas of Application
- 6.2.4. Type of Function
- 6.2.5. Type of Modification Methods
- 6.2.6. Type of Form
- 6.3. Future Perspective
7. REGULATORY SCENARIO
SECTION III: MARKET OVERVIEW
8. COMPREHENSIVE DATABASE OF LEADING PLAYERS
9. COMPETITIVE LANDSCAPE
- 9.1. Chapter Overview
- 9.2. Pea Starch Market: Overall Market Landscape
- 9.2.1. Analysis by Year of Establishment
- 9.2.2. Analysis by Company Size
- 9.2.3. Analysis by Location of Headquarters
- 9.2.4. Analysis by Ownership Structure
10. WHITE SPACE ANALYSIS
11. COMPANY COMPETITIVENESS ANALYSIS
12. STARTUP ECOSYSTEM IN THE PEA STARCH MARKET
- 12.1. Pea Starch Market: Market Landscape of Startups
- 12.1.1. Analysis by Year of Establishment
- 12.1.2. Analysis by Company Size
- 12.1.3. Analysis by Company Size and Year of Establishment
- 12.1.4. Analysis by Location of Headquarters
- 12.1.5. Analysis by Company Size and Location of Headquarters
- 12.1.6. Analysis by Ownership Structure
- 12.2. Key Findings
SECTION IV: COMPANY PROFILES
13. COMPANY PROFILES
- 13.1. Chapter Overview
- 13.2. Agridient.nl*
- 13.2.1. Company Overview
- 13.2.2. Company Mission
- 13.2.3. Company Footprint
- 13.2.4. Management Team
- 13.2.5. Contact Details
- 13.2.6. Financial Performance
- 13.2.7. Operating Business Segments
- 13.2.8. Service / Product Portfolio (project specific)
- 13.2.9. MOAT Analysis
- 13.2.10. Recent Developments and Future Outlook
- 13.3. AGT Food and Ingredients
- 13.4. American Key Food Products
- 13.5. Axiom Foods
- 13.6. Cosucra Groupe
- 13.7. Cargill
- 13.8. Dakota Dry Bean
- 13.9. Emsland
- 13.10. EMFOOD TRADING
- 13.11. Healy
- 13.12. Ingredion
- 13.13. Inner Mongolia Oiagia Food
- 13.14. Meelunie
- 13.15. NISCO
- 13.16. Nutri-Pea
- 13.17. Parrheim Foods
SECTION V: MARKET TRENDS
14. MEGA TRENDS ANALYSIS
15. UNMET NEED ANALYSIS
16. PATENT ANALYSIS
17. RECENT DEVELOPMENTS
- 17.1. Chapter Overview
- 17.2. Recent Funding
- 17.3. Recent Partnerships
- 17.4. Other Recent Initiatives
SECTION VI: MARKET OPPORTUNITY ANALYSIS
18. GLOBAL PEA STARCH MARKET
- 18.1. Chapter Overview
- 18.2. Key Assumptions and Methodology
- 18.3. Trends Disruption Impacting Market
- 18.4. Demand Side Trends
- 18.5. Supply Side Trends
- 18.6. Global Pea Starch Market, Historical Trends (Since 2020) and Forecasted Estimates (Till 2035)
- 18.7. Multivariate Scenario Analysis
- 18.7.1. Conservative Scenario
- 18.7.2. Optimistic Scenario
- 18.8. Investment Feasibility Index
- 18.9. Key Market Segmentations
19. MARKET OPPORTUNITIES BASED ON TYPE OF SOURCE
- 19.1. Chapter Overview
- 19.2. Key Assumptions and Methodology
- 19.3. Revenue Shift Analysis
- 19.4. Market Movement Analysis
- 19.5. Penetration-Growth (P-G) Matrix
- 19.6. Pea Starch Market for Inorganic: Historical Trends (Since 2020) and Forecasted Estimates (Till 2035)
- 19.7. Pea Starch Market for Organic: Historical Trends (Since 2020) and Forecasted Estimates (Till 2035)
- 19.8. Data Triangulation and Validation
- 19.8.1. Secondary Sources
- 19.8.2. Primary Sources
- 19.8.3. Statistical Modeling
20. MARKET OPPORTUNITIES BASED ON TYPE OF GRADE
- 20.1. Chapter Overview
- 20.2. Key Assumptions and Methodology
- 20.3. Revenue Shift Analysis
- 20.4. Market Movement Analysis
- 20.5. Penetration-Growth (P-G) Matrix
- 20.6. Pea Starch Market for Feed: Historical Trends (Since 2020) and Forecasted Estimates (Till 2035)
- 20.7. Pea Starch Market for Food: Historical Trends (Since 2020) and Forecasted Estimates (Till 2035)
- 20.8. Pea Starch Market for Industrial: Historical Trends (Since 2020) and Forecasted Estimates (Till 2035)
- 20.9. Data Triangulation and Validation
- 20.9.1. Secondary Sources
- 20.9.2. Primary Sources
- 20.9.3. Statistical Modeling
21. MARKET OPPORTUNITIES BASED ON AREAS OF APPLICATION
- 21.1. Chapter Overview
- 21.2. Key Assumptions and Methodology
- 21.3. Revenue Shift Analysis
- 21.4. Market Movement Analysis
- 21.5. Penetration-Growth (P-G) Matrix
- 21.6. Pea Starch Market for Animal Feed and Pet Food: Historical Trends (Since 2020) and Forecasted Estimates (Till 2035)
- 21.7. Pea Starch Market for Food and Beverage: Historical Trends (Since 2020) and Forecasted Estimates (Till 2035)
- 21.8. Pea Starch Market for Personal Care and Cosmetics: Historical Trends (Since 2020) and Forecasted Estimates (Till 2035)
- 21.9. Data Triangulation and Validation
- 21.9.1. Secondary Sources
- 21.9.2. Primary Sources
- 21.9.3. Statistical Modeling
22. MARKET OPPORTUNITIES BASED ON TYPE OF FUNCTION
- 22.1. Chapter Overview
- 22.2. Key Assumptions and Methodology
- 22.3. Revenue Shift Analysis
- 22.4. Market Movement Analysis
- 22.5. Penetration-Growth (P-G) Matrix
- 22.6. Pea Starch Market for Binding & Thickening: Historical Trends (Since 2020) and Forecasted Estimates (Till 2035)
- 22.7. Pea Starch Market for Film Forming: Historical Trends (Since 2020) and Forecasted Estimates (Till 2035)
- 22.8. Pea Starch Market for Gelling: Historical Trends (Since 2020) and Forecasted Estimates (Till 2035)
- 22.9. Pea Starch Market for Texturizing: Historical Trends (Since 2020) and Forecasted Estimates (Till 2035)
- 22.10. Data Triangulation and Validation
- 22.10.1. Secondary Sources
- 22.10.2. Primary Sources
- 22.10.3. Statistical Modeling
23. MARKET OPPORTUNITIES BASED ON TYPE OF MODIFICATION METHOD
- 23.1. Chapter Overview
- 23.2. Key Assumptions and Methodology
- 23.3. Revenue Shift Analysis
- 23.4. Market Movement Analysis
- 23.5. Penetration-Growth (P-G) Matrix
- 23.6. Pea Starch Market for Chemical Modification: Historical Trends (Since 2020) and Forecasted Estimates (Till 2035)
- 23.7. Pea Starch Market for Physical Modification: Historical Trends (Since 2020) and Forecasted Estimates (Till 2035)
- 23.8. Data Triangulation and Validation
- 23.8.1. Secondary Sources
- 23.8.2. Primary Sources
- 23.8.3. Statistical Modeling
24. MARKET OPPORTUNITIES BASED ON TYPE OF FORM
- 24.1. Chapter Overview
- 24.2. Key Assumptions and Methodology
- 24.3. Revenue Shift Analysis
- 24.4. Market Movement Analysis
- 24.5. Penetration-Growth (P-G) Matrix
- 24.6. Pea Starch Market for Liquid: Historical Trends (Since 2020) and Forecasted Estimates (Till 2035)
- 24.7. Pea Starch Market for Power: Historical Trends (Since 2020) and Forecasted Estimates (Till 2035)
- 24.8. Data Triangulation and Validation
- 24.8.1. Secondary Sources
- 24.8.2. Primary Sources
- 24.8.3. Statistical Modeling
25. MARKET OPPORTUNITIES BASED ON COMPANY SIZE
- 25.1. Chapter Overview
- 25.2. Key Assumptions and Methodology
- 25.3. Revenue Shift Analysis
- 25.4. Market Movement Analysis
- 25.5. Penetration-Growth (P-G) Matrix
- 25.6. Pea Starch Market for Large Enterprises: Historical Trends (Since 2020) and Forecasted Estimates (Till 2035)
- 25.7. Pea Starch Market for Small and Medium Enterprises: Historical Trends (Since 2020) and Forecasted Estimates (Till 2035)
- 25.8. Data Triangulation and Validation
- 25.8.1. Secondary Sources
- 25.8.2. Primary Sources
- 25.8.3. Statistical Modeling
26. MARKET OPPORTUNITIES FOR PEA STARCH IN NORTH AMERICA
- 26.1. Chapter Overview
- 26.2. Key Assumptions and Methodology
- 26.3. Revenue Shift Analysis
- 26.4. Market Movement Analysis
- 26.5. Penetration-Growth (P-G) Matrix
- 26.6. Pea Starch Market in North America: Historical Trends (Since 2020) and Forecasted Estimates (Till 2035)
- 26.6.1. Pea Starch Market in the US: Historical Trends (Since 2020) and Forecasted Estimates (Till 2035)
- 26.6.2. Pea Starch Market in Canada: Historical Trends (Since 2020) and Forecasted Estimates (Till 2035)
- 26.6.3. Pea Starch Market in Mexico: Historical Trends (Since 2020) and Forecasted Estimates (Till 2035)
- 26.6.4. Pea Starch Market in Other North American Countries: Historical Trends (Since 2020) and Forecasted Estimates (Till 2035)
- 26.7. Data Triangulation and Validation
27. MARKET OPPORTUNITIES FOR PEA STARCH MARKET IN EUROPE
- 27.1. Chapter Overview
- 27.2. Key Assumptions and Methodology
- 27.3. Revenue Shift Analysis
- 27.4. Market Movement Analysis
- 27.5. Penetration-Growth (P-G) Matrix
- 27.6. Pea Starch Market in Europe: Historical Trends (Since 2020) and Forecasted Estimates (Till 2035)
- 27.6.1. Pea Starch Market in Austria: Historical Trends (Since 2020) and Forecasted Estimates (Till 2035)
- 27.6.2. Pea Starch Market in Belgium: Historical Trends (Since 2020) and Forecasted Estimates (Till 2035)
- 27.6.3. Pea Starch Market in Denmark: Historical Trends (Since 2020) and Forecasted Estimates (Till 2035)
- 27.6.4. Pea Starch Market in France: Historical Trends (Since 2020) and Forecasted Estimates (Till 2035)
- 27.6.5. Pea Starch Market in Germany: Historical Trends (Since 2020) and Forecasted Estimates (Till 2035)
- 27.6.6. Pea Starch Market in Ireland: Historical Trends (Since 2020) and Forecasted Estimates (Till 2035)
- 27.6.7. Pea Starch Market in Italy: Historical Trends (Since 2020) and Forecasted Estimates (Till 2035)
- 27.6.8. Pea Starch Market in Netherlands: Historical Trends (Since 2020) and Forecasted Estimates (Till 2035)
- 27.6.9. Pea Starch Market in Norway: Historical Trends (Since 2020) and Forecasted Estimates (Till 2035)
- 27.6.10. Pea Starch Market in Russia: Historical Trends (Since 2020) and Forecasted Estimates (Till 2035)
- 27.6.11. Pea Starch Market in Spain: Historical Trends (Since 2020) and Forecasted Estimates (Till 2035)
- 27.6.12. Pea Starch Market in Sweden: Historical Trends (Since 2020) and Forecasted Estimates (Till 2035)
- 27.6.13. Pea Starch Market in Switzerland: Historical Trends (Since 2020) and Forecasted Estimates (Till 2035)
- 27.6.14. Pea Starch Market in the UK: Historical Trends (Since 2020) and Forecasted Estimates (Till 2035)
- 27.6.15. Pea Starch Market in Other European Countries: Historical Trends (Since 2020) and Forecasted Estimates (Till 2035)
- 27.7. Data Triangulation and Validation
28. MARKET OPPORTUNITIES FOR PEA STARCH IN ASIA
- 28.1. Chapter Overview
- 28.2. Key Assumptions and Methodology
- 28.3. Revenue Shift Analysis
- 28.4. Market Movement Analysis
- 28.5. Penetration-Growth (P-G) Matrix
- 28.6. Pea Starch Market in Asia: Historical Trends (Since 2020) and Forecasted Estimates (Till 2035)
- 28.6.1. Pea Starch Market in China: Historical Trends (Since 2020) and Forecasted Estimates (Till 2035)
- 28.6.2. Pea Starch Market in India: Historical Trends (Since 2020) and Forecasted Estimates (Till 2035)
- 28.6.3. Pea Starch Market in Japan: Historical Trends (Since 2020) and Forecasted Estimates (Till 2035)
- 28.6.4. Pea Starch Market in Singapore: Historical Trends (Since 2020) and Forecasted Estimates (Till 2035)
- 28.6.5. Pea Starch Market in South Korea: Historical Trends (Since 2020) and Forecasted Estimates (Till 2035)
- 28.6.6. Pea Starch Market in Other Asian Countries: Historical Trends (Since 2020) and Forecasted Estimates (Till 2035)
- 28.7. Data Triangulation and Validation
29. MARKET OPPORTUNITIES FOR PEA STARCH IN MIDDLE EAST AND NORTH AFRICA (MENA)
- 29.1. Chapter Overview
- 29.2. Key Assumptions and Methodology
- 29.3. Revenue Shift Analysis
- 29.4. Market Movement Analysis
- 29.5. Penetration-Growth (P-G) Matrix
- 29.6. Pea Starch Market in Middle East and North Africa (MENA): Historical Trends (Since 2020) and Forecasted Estimates (Till 2035)
- 29.6.1. Pea Starch Market in Egypt: Historical Trends (Since 2020) and Forecasted Estimates (Till 205)
- 29.6.2. Pea Starch Market in Iran: Historical Trends (Since 2020) and Forecasted Estimates (Till 2035)
- 29.6.3. Pea Starch Market in Iraq: Historical Trends (Since 2020) and Forecasted Estimates (Till 2035)
- 29.6.4. Pea Starch Market in Israel: Historical Trends (Since 2020) and Forecasted Estimates (Till 2035)
- 29.6.5. Pea Starch Market in Kuwait: Historical Trends (Since 2020) and Forecasted Estimates (Till 2035)
- 29.6.6. Pea Starch Market in Saudi Arabia: Historical Trends (Since 2020) and Forecasted Estimates (Till 2035)
- 29.6.7. Pea Starch Market in United Arab Emirates (UAE): Historical Trends (Since 2020) and Forecasted Estimates (Till 2035)
- 29.6.8. Pea Starch Market in Other MENA Countries: Historical Trends (Since 2020) and Forecasted Estimates (Till 2035)
- 29.7. Data Triangulation and Validation
30. MARKET OPPORTUNITIES FOR PEA STARCH IN LATIN AMERICA
- 30.1. Chapter Overview
- 30.2. Key Assumptions and Methodology
- 30.3. Revenue Shift Analysis
- 30.4. Market Movement Analysis
- 30.5. Penetration-Growth (P-G) Matrix
- 30.6. Pea Starch Market in Latin America: Historical Trends (Since 2020) and Forecasted Estimates (Till 2035)
- 30.6.1. Pea Starch Market in Argentina: Historical Trends (Since 2020) and Forecasted Estimates (Till 2035)
- 30.6.2. Pea Starch Market in Brazil: Historical Trends (Since 2020) and Forecasted Estimates (Till 2035)
- 30.6.3. Pea Starch Market in Chile: Historical Trends (Since 2020) and Forecasted Estimates (Till 2035)
- 30.6.4. Pea Starch Market in Colombia Historical Trends (Since 2020) and Forecasted Estimates (Till 2035)
- 30.6.5. Pea Starch Market in Venezuela: Historical Trends (Since 2020) and Forecasted Estimates (Till 2035)
- 30.6.6. Pea Starch Market in Other Latin American Countries: Historical Trends (Since 2020) and Forecasted Estimates (Till 2035)
- 30.7. Data Triangulation and Validation
31. MARKET OPPORTUNITIES FOR PEA STARCH IN REST OF THE WORLD
- 31.1. Chapter Overview
- 31.2. Key Assumptions and Methodology
- 31.3. Revenue Shift Analysis
- 31.4. Market Movement Analysis
- 31.5. Penetration-Growth (P-G) Matrix
- 31.6. Pea Starch Market in Rest of the World: Historical Trends (Since 2020) and Forecasted Estimates (Till 2035)
- 31.6.1. Pea Starch Market in Australia: Historical Trends (Since 2020) and Forecasted Estimates (Till 2035)
- 31.6.2. Pea Starch Market in New Zealand: Historical Trends (Since 2020) and Forecasted Estimates (Till 2035)
- 31.6.3. Pea Starch Market in Other Countries
- 31.7. Data Triangulation and Validation
32. MARKET CONCENTRATION ANALYSIS: DISTRIBUTION BY LEADING PLAYERS
- 32.1. Leading Player 1
- 32.2. Leading Player 2
- 32.3. Leading Player 3
- 32.4. Leading Player 4
- 32.5. Leading Player 5
- 32.6. Leading Player 6
- 32.7. Leading Player 7
- 32.8. Leading Player 8
33. ADJACENT MARKET ANALYSIS
SECTION VII: STRATEGIC TOOLS
34. KEY WINNING STRATEGIES
35. PORTER'S FIVE FORCES ANALYSIS
36. SWOT ANALYSIS
37. VALUE CHAIN ANALYSIS
38. ROOTS STRATEGIC RECOMMENDATIONS
- 38.1. Chapter Overview
- 38.2. Key Business-related Strategies
- 38.2.1. Research & Development
- 38.2.2. Product Manufacturing
- 38.2.3. Commercialization / Go-to-Market
- 38.2.4. Sales and Marketing
- 38.3. Key Operations-related Strategies
- 38.3.1. Risk Management
- 38.3.2. Workforce
- 38.3.3. Finance
- 38.3.4. Others
SECTION VIII: OTHER EXCLUSIVE INSIGHTS
39. INSIGHTS FROM PRIMARY RESEARCH
40. REPORT CONCLUSION
SECTION IX: APPENDIX
41. TABULATED DATA
42. LIST OF COMPANIES AND ORGANIZATIONS
43. CUSTOMIZATION OPPORTUNITIES
44. ROOTS SUBSCRIPTION SERVICES
45. AUTHOR DETAILS

