
PUBLISHER: Roots Analysis | PRODUCT CODE: 1849802

PUBLISHER: Roots Analysis | PRODUCT CODE: 1849802
Next Generation Sequencing Market: Industry Trends and Global Forecasts, Till 2035: Distribution by Type of Component, Type of NGS Technique, Technology Used, Application Area, Target Therapeutic Area, Purpose, End Users and Geographical Regions
Next Generation Sequencing Market: Overview
The next generation sequencing market is estimated to grow from USD 8.6 billion in the current year and reach USD 46.5 billion by 2040, representing a higher CAGR of 18.4% during the forecast period.
The opportunity for next generation sequencing market has been distributed across the following segments:
Type of NGS Technique
- Targeted Sequencing
- Whole Genome Sequencing / Whole Exome Sequencing
- RNA Sequencing
- Other Techniques
Type of Technology Used
- Sequencing by Synthesis Technology
- Ion Semiconductor Technology
- Nanopore Sequencing Technology
- Other Technologies
Application Area
- Clinical Applications
- Research and Applied Applications
Target Therapeutic Area
- Oncological Disorders
- Genetic Disorders
- Reproductive Disorders
- Other Therapeutic Areas
Purpose
- Diagnosis
- Risk Assessment
- Presymptomatic Assessment
- Screening
- Other Purposes
End users
- Academic and Research Institutes
- Hospitals and Clinics
- Pharmaceutical and Biotechnology Companies
- Other End Users
Geographical Regions
- North America
- Europe
- Asia-Pacific
- Middle East and North Africa
- Latin America
Market in North America
- US
- Canada
Market in Europe
- Germany
- UK
- France
- Italy
- UK
- Spain
Market in Asia-Pacific
- China
- South Korea
- India
- Australia
- Rest of the Asia-Pacific
Market in Middle East and North Africa
- Saudi Arabia
- UAE
- Rest of the Middle East and North Africa
Market in Latin America
- Brazil
- Argentina
- Rest of Latin America
Next Generation Sequencing Market: Growth and Trends
Next generation sequencing involves the sequencing of whole genomes to understand genetic variations associated with a wide range of diseases. The ability to sequence entire genomes at the same time has created wide possibilities for both research and the molecular diagnosis of diseases.
The prevalence of chronic diseases has significantly increased over the years, raising serious concerns. According to the report of , nearly six out of 10 Americans are suffering from at least one chronic disease, indicating the growing risk of chronic diseases. In order to mitigate this concern, researchers are leveraging next generation sequencing for analyzing diseases at molecular level through metagenomics studies. In addition to disease diagnosis, next generation sequencing helps to design , identify and develop targeted therapies.
Currently, next generation sequencing platforms experience limited adoption because of high installation costs, the need for skilled personnel, and inadequate in-house infrastructure to carry out NGS workflows. To tackle these issues, various industry companies (such as Illumina and PacBio) are providing next generation sequencing services.
Outsourcing NGS solutions is economical, shortens analysis duration, and ensures precision in producing sequencing data. Such advantages of outsourcing next generation sequencing have attracted the interest of various government agencies and industry leaders who are currently involved in several initiatives related to multiple national genome mapping. Moreover, next-generation technologies have demonstrated great effectiveness in clinical trials, leading to a rise in volunteer participation in these trials, which assists researchers in making more informed decisions regarding the assessed drug or technology.
Ongoing research and innovation in this domain are expected to lead to a significant rise in the adoption of these sequencing techniques, propelling the growth of the next generation sequencing market.
Next Generation Sequencing Market: Key Insights
The report delves into the current state of the next generation sequencing market and identifies potential growth opportunities within the industry. The key takeaways of the report are:
- Over 45% of the next generation sequencing service providers are small players; this is indicative of the increase in number of new entrants within the market.
- ~95% of the next generation sequencing service providers offer whole genome sequencing services; of these, around 85% of the service providers offer additional services for bioinformatics.
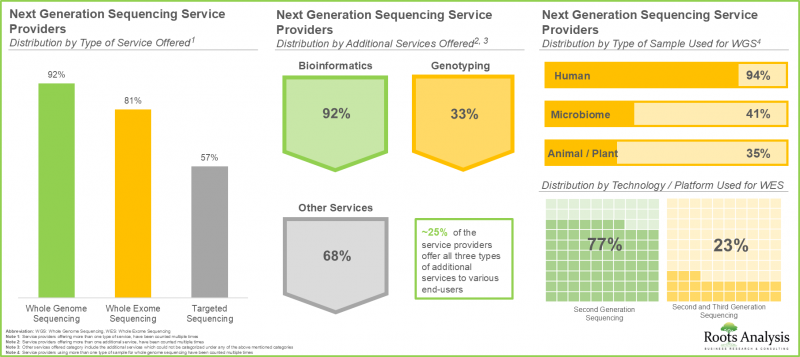
- Close to 40% of the companies engaged in offering next generation sequencing technologies are mid-sized firms; further, ~75% of the firms are based in North America.
- The rising demand for NGS technologies has led to a notable increase in its application sectors, with around 25 technologies currently used for both whole genome sequencing and targeted sequencing.
- Since 2020, more than 3,060 patents have been filed / granted focused on the research and development of next generation technologies / platforms across the globe.
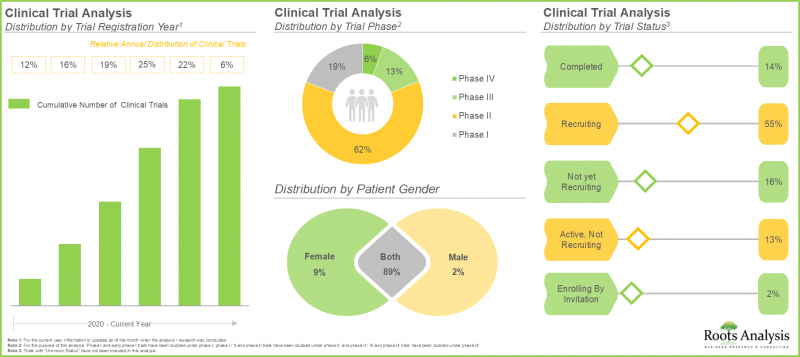
- In recent years, a significant increase in the number of registered clinical trials has been observed in this domain; over 60% of the trials focused on next generation sequencing are currently in phase II.
- The rising interest of big pharma players in the field of next generation sequencing is reflected by the wide array of initiatives established in the recent past; ~75% of the initiatives were focused collaborations with other players.
- The next generation sequencing market is anticipated to grow at a CAGR of 18.4% till 2035; majority of the market share is likely to be occupied by North America, followed by Europe.
- The market opportunity is projected to be well distributed across various segments, such as type of component, type of NGS technique, technology used, application area, target therapeutic area, purpose and end users.
Next Generation Sequencing Market: Key Segments
Consumables Segment Capture the Majority of the Next Generation Sequencing Market
In terms of type of component, the next generation sequencing market is segmented in consumables and services and instruments. In the current year, the consumables segment captures the majority share (67%) in the overall market and this trend is likely to remain unchanged in the future as well (CAGR of 18.7%).
Targeted Sequencing Segment Captures the Maximum Share of the Next Generation Sequencing Market
This next generation sequencing market report highlights the segmentation of the market size into targeted sequencing, whole genome sequencing / whole exome sequencing, RNA sequencing and other techniques, based on the type of NGS technique. Currently, the targeted sequencing segment captures the maximum share (45%) in the overall market. However, whole genome sequencing / whole exome sequencing segment is expected to grow at a relatively higher CAGR (19.5%), during the forecast period, till 2035.
Nanopore Sequencing Technology Segment is Likely to Grow at a Higher CAGR
This market report highlights the segmentation of the market into sequencing by synthesis technology, ion semiconductor technology, nanopore sequencing technology and other technologies, based on the type of technology used. Currently, the sequencing by synthesis technology segment captures the maximum next generation sequencing market share (82%) and this trend is likely to remain unchanged in the future as well. However, nanopore sequencing technology segment is expected to grow at a relatively higher CAGR (20.5%), during the forecast period, till 2035.
Clinical Applications Segment Leads the Next Generation Sequencing Market
The next generation sequencing market size is further divided into various sub-segments based on the application area, such as clinical applications, and research and applied applications. Currently, the clinical applications segment captures the maximum share (57%) in the overall market. This segment is expected to grow at a relatively higher CAGR (21.1%), during the forecast period, till 2035.
Oncological Disorders Capture the Highest Market Share
This segment highlights the distribution of market across various target therapeutic area such as, oncological disorders, genetic disorders, reproductive disorders and other therapeutic area. Currently, oncological disorders occupy the highest next generation sequencing market share (50%), and this trend is likely to remain unchanged. This can be attributed to the growing preference of next generation sequencing technologies for early diagnosis and prevention of cancer at molecular level. However, the other therapeutic areas segment is likely to grow at a relatively higher CAGR (26.6%) during the forecast period, till 2035.
Diagnosis Segment Captures the Highest Market Share
The next generation sequencing market is further divided into various sub-segments based on the purpose such as diagnosis, risk assessment, presymptomatic assessment, screening and other purposes. Currently, the market is driven by the diagnosis segment (58%) in the overall market, and this trend is likely to remain unchanged. However, other purposes segment is expected to grow at a relatively higher CAGR (20.1%), during the forecast period, till 2035.
Academic And Research Institutes Hold the Majority of the Market Share
The global market is segmented into different end users, including academic and research institutes, hospitals and clinics, pharmaceutical and biotechnology companies, and other end users. Currently, the academic and research institutes segment captures the maximum next generation sequencing market share (45%), and this trend is likely to remain unchanged in the future as well. However, we anticipate hospitals and clinics segment to grow at a relatively higher CAGR (21.7%) during the forecast period, till 2035.
North America will Propel the Next Generation Sequencing Market
Next generation sequencing market is distributed across various geographies, such as North America, Europe and Asia-Pacific, Middle East and North Africa and Latin America., North America is likely to capture the majority (51%) of the current market share, and this trend is likely to remain unchanged in the future.
Example Players in the Next Generation Sequencing Market
- Illumina
- MGI Tech
- Oxford Nanopore Technologies
- Pacific Biosciences
- Thermo Fisher Scientific
Next Generation Sequencing Market: Research Coverage
The report on next generation sequencing market features insights into various sections, including:
- Market Sizing and Opportunity Analysis: An in-depth analysis of current market opportunity and the future growth potential of next generation sequencing market , focusing on key market segments, including [A] type of component, [B] type of NGS technique, [C] type of technology used, [D] application area, [E] target therapeutic area and [F] geographical regions.
- Market Impact Analysis: A thorough analysis of various factors, such as [A] drivers, [B] restraints, [C] opportunities, and [D] existing challenges that are likely to impact market growth.
- Market Landscape: The report features a list of service providers involved in the next generation domain, along with analyses based on [A] type of sample used for whole genome sequencing, [B] type of technology / platform used for whole genome sequencing and [C] analysis by type of sample used for whole exome sequencing [D] analysis by type of technology / platform used for whole exome sequencing [E] analysis by type of sample used for targeted sequencing, [F] analysis by type of technology / platform used for targeted sequencing [G] year of establishment, [H] company size [I] location of headquarters.
- Technology Landscape: An insightful technology landscape analysis, presenting information on [A] type of application, [B] technology / platform run time [C] maximum output [D] maximum quality, [E] sequencing technique used, [F] year of establishment, [G] company size [H] location of headquarters.
- Technology Competitiveness Analysis: An insightful technology competitiveness, based on various relevant parameters, such as [A] technology provider strength, and [B] platform strength.
- Company Profiles: Comprehensive profiles of prominent players that are engaged in offering next generation sequencing services and next generation sequencing technologies, featuring information on [A] company overview, [B] financial information (if available), [C] next generation sequencing service portfolio, [D] recent developments, and [E] future outlook statements.
- Patent Analysis: A detailed analysis of patents filed / granted since 2020 in the next generation sequencing domain, based on several relevant parameters, such as [A] type of patent, [B] patent publication year, [C] patent application year, [D] patent jurisdiction, [E] cooperative patent classification (CPC) symbols, and [F] type of applicant.
- Clinical Trial Analysis: A detailed clinical trial analysis of completed / ongoing clinical trials related to next-generation sequencing relevant information across parameters, such as [A] trial registration year, number of patients enrolled, [B] trial phase, [C] trial status, [D] target patient population, [E] patient gender, [F] type of sponsor / collaborator and [G] study design
Key Questions Answered in this Report
- How many companies are currently engaged in this market?
- Which are the leading companies in this market?
- What factors are likely to influence the evolution of this market?
- What is the current and future market size?
- What is the CAGR of this market?
- How is the current and future market opportunity likely to be distributed across key market segments?
Reasons to Buy this Report
- The report provides a comprehensive market analysis, offering detailed revenue projections of the overall market and its specific sub-segments. This information is valuable to both established market leaders and emerging entrants.
- Stakeholders can leverage the report to gain a deeper understanding of the competitive dynamics within the market. By analyzing the competitive landscape, businesses can make informed decisions to optimize their market positioning and develop effective go-to-market strategies.
- The report offers stakeholders a comprehensive overview of the market, including key drivers, barriers, opportunities, and challenges. This information empowers stakeholders to stay abreast of market trends and make data-driven decisions to capitalize on growth prospects.
Additional Benefits
- Complimentary PPT Insights Packs
- Complimentary Excel Data Packs for all Analytical Modules in the Report
- 15% Free Content Customization
- Detailed Report Walkthrough Session with Research Team
- Free Updated report if the report is 6-12 months old or older
TABLE OF CONTENTS
1. PREFACE
- 1.1. Introduction
- 1.2. Market Share Insights
- 1.3. Key Market Insights
- 1.4. Report Coverage
- 1.5. Key Questions Answered
- 1.6. Chapter Outlines
2. RESEARCH METHODOLOGY
- 2.1. Chapter Overview
- 2.2. Research Assumptions
- 2.2.1. Market Landscape and Market Trends
- 2.2.2. Market Forecast and Opportunity Analysis
- 2.2.3. Comparative Analysis
- 2.3. Database Building
- 2.3.1. Data Collection
- 2.3.2. Data Validation
- 2.3.3. Data Analysis
- 2.4. Project Methodology
- 2.4.1. Secondary Research
- 2.4.1.1. Annual Reports
- 2.4.1.2. Academic Research Papers
- 2.4.1.3. Company Websites
- 2.4.1.4. Investor Presentations
- 2.4.1.5. Regulatory Filings
- 2.4.1.6. White Papers
- 2.4.1.7. Industry Publications
- 2.4.1.8. Conferences and Seminars
- 2.4.1.9. Government Portals
- 2.4.1.10. Media and Press Releases
- 2.4.1.11. Newsletters
- 2.4.1.12. Industry Databases
- 2.4.1.13. Roots Proprietary Databases
- 2.4.1.14. Paid Databases and Sources
- 2.4.1.15. Social Media Portals
- 2.4.1.16. Other Secondary Sources
- 2.4.2. Primary Research
- 2.4.2.1. Types of Primary Research
- 2.4.2.1.1. Qualitative Research
- 2.4.2.1.2. Quantitative Research
- 2.4.2.1.3. Hybrid Approach
- 2.4.2.2. Advantages of Primary Research
- 2.4.2.3. Techniques for Primary Research
- 2.4.2.3.1. Interviews
- 2.4.2.3.2. Surveys
- 2.4.2.3.3. Focus Groups
- 2.4.2.3.4. Observational Research
- 2.4.2.3.5. Social Media Interactions
- 2.4.2.4. Key Opinion Leaders Considered in Primary Research
- 2.4.2.4.1. Company Executives (CXOs)
- 2.4.2.4.2. Board of Directors
- 2.4.2.4.3. Company Presidents and Vice Presidents
- 2.4.2.4.4. Research and Development Heads
- 2.4.2.4.5. Technical Experts
- 2.4.2.4.6. Subject Matter Experts
- 2.4.2.4.7. Scientists
- 2.4.2.4.8. Doctors and Other Healthcare Providers
- 2.4.2.5. Ethics and Integrity
- 2.4.2.5.1. Research Ethics
- 2.4.2.5.2. Data Integrity
- 2.4.2.1. Types of Primary Research
- 2.4.3. Analytical Tools and Databases
- 2.4.1. Secondary Research
- 2.5. Robust Quality Control
3. MARKET DYNAMICS
- 3.1. Chapter Overview
- 3.2. Forecast Methodology
- 3.2.1. Top-down Approach
- 3.2.2. Bottom-up Approach
- 3.2.3. Hybrid Approach
- 3.3. Market Assessment Framework
- 3.3.1. Total Addressable Market (TAM)
- 3.3.2. Serviceable Addressable Market (SAM)
- 3.3.3. Serviceable Obtainable Market (SOM)
- 3.3.4. Currently Acquired Market (CAM)
- 3.4. Forecasting Tools and Techniques
- 3.4.1. Qualitative Forecasting
- 3.4.2. Correlation
- 3.4.3. Regression
- 3.4.4. Extrapolation
- 3.4.5. Convergence
- 3.4.6. Sensitivity Analysis
- 3.4.7. Scenario Planning
- 3.4.8. Data Visualization
- 3.4.9. Time Series Analysis
- 3.4.10. Forecast Error Analysis
- 3.5. Key Considerations
- 3.5.1. Demographics
- 3.5.2. Government Regulations
- 3.5.3. Reimbursement Scenarios
- 3.5.4. Market Access
- 3.5.5. Supply Chain
- 3.5.6. Industry Consolidation
- 3.5.7. Pandemic / Unforeseen Disruptions Impact
- 3.6. Limitations
4. MACRO-ECONOMIC INDICATORS
- 4.1. Chapter Overview
- 4.2. Market Dynamics
- 4.2.1. Time Period
- 4.2.1.1. Historical Trends
- 4.2.1.2. Current and Forecasted Estimates
- 4.2.2. Currency Coverage
- 4.2.2.1. Major Currencies Affecting the Market
- 4.2.2.2. Factors Affecting Currency Fluctuations
- 4.2.2.3. Impact of Currency Fluctuations on the Industry
- 4.2.3. Foreign Currency Exchange Rate
- 4.2.3.1. Impact of Foreign Exchange Rate Volatility on the Market
- 4.2.3.2. Strategies for Mitigating Foreign Exchange Risk
- 4.2.4. Recession
- 4.2.4.1. Assessment of Current Economic Conditions and Potential Impact on the Market
- 4.2.4.2. Historical Analysis of Past Recessions and Lessons Learnt
- 4.2.5. Inflation
- 4.2.5.1. Measurement and Analysis of Inflationary Pressures in the Economy
- 4.2.5.2. Potential Impact of Inflation on the Market Evolution
- 4.2.6. Interest Rates
- 4.2.6.1. Interest Rates and Their Impact on the Market
- 4.2.6.2. Strategies for Managing Interest Rate Risk
- 4.2.7. Commodity Flow Analysis
- 4.2.7.1. Type of Commodity
- 4.2.7.2. Origins and Destinations
- 4.2.7.3. Values and Weights
- 4.2.7.4. Modes of Transportation
- 4.2.8. Global Trade Dynamics
- 4.2.8.1. Import Scenario
- 4.2.8.2. Export Scenario
- 4.2.8.3. Trade Policies
- 4.2.8.4. Strategies for Mitigating the Risks Associated with Trade Barriers
- 4.2.8.5. Impact of Trade Barriers on the Market
- 4.2.9. War Impact Analysis
- 4.2.9.1. Russian-Ukraine War
- 4.2.9.2. Israel-Hamas War
- 4.2.10. COVID Impact / Related Factors
- 4.2.10.1. Global Economic Impact
- 4.2.10.2. Industry-specific Impact
- 4.2.10.3. Government Response and Stimulus Measures
- 4.2.10.4. Future Outlook and Adaptation Strategies
- 4.2.11. Other Indicators
- 4.2.11.1. Fiscal Policy
- 4.2.11.2. Consumer Spending
- 4.2.11.3. Gross Domestic Product
- 4.2.11.4. Employment
- 4.2.11.5. Taxes
- 4.2.11.6. Stock Market Performance
- 4.2.11.7. Cross Border Dynamics
- 4.2.1. Time Period
- 4.3. Conclusion
5. EXECUTIVE SUMMARY
6. INTRODUCTION
- 6.1. Chapter Overview
- 6.2. Overview of Genome Sequencing
- 6.3. Types of Genome Sequencing
- 6.4. History and Evolution of Next Genration Sequencing
- 6.5. Generations of Next generation sequencing Technology
- 6.5.1. First Generation DNA Sequencers
- 6.5.2. Second Generation HT-NGS Platforms
- 6.5.3. Third Generation HT-NGS Platforms
- 6.5.3.1. Heliscope Single Molecule Sequencer
- 6.5.3.2. Single Molecule Real Time (SMRT(TM)) Sequencer
- 6.5.3.3. Single Molecule Real Time (RNAP) Sequencer
- 6.5.3.4. Multiplex Polony Technology
- 6.5.3.5. Nanopore DNA Sequencer
- 6.5.3.6. The Ion Torrent Sequencing Technology
- 6.6. Comparison of First, Second and Third Generation Technologies
- 6.7. Applications of Genome Sequencing
- 6.8. Challenges Associated with Genome Sequencing
- 6.9. Future Perspectives
7. NEXT GENERATION SEQUENCING SERVICE PROVIDERS: MARKET LANDSCAPE
- 7.1. Chapter Overview
- 7.2. Next Genration Sequencing Service Providers: Overall Market Landscape of Industry Players
- 7.2.1. Analysis by Year of Establishment
- 7.2.2. Analysis by Company Size
- 7.2.3. Analysis by Location of Headquarters
- 7.2.4. Analysis by Company Size and Location of Headquarters (Region)
- 7.2.5. Analysis by Type of Service Offered
- 7.2.6. Analysis by Additional Service Offered
- 7.2.7. Analysis by Type of Sample Used for Whole Genome Sequencing
- 7.2.8. Analysis by Type of Technology / Platform Used for Whole Genome Sequencing
- 7.2.9. Analysis by Type of Sample Used for Whole Exome Sequencing
- 7.2.10. Analysis by Type of Technology / Platform Used for Whole exome Sequencing
- 7.2.11. Analysis by Type of Sample Used for Targeted Sequencing
- 7.2.12. Analysis by Type of Technology / Platform Used for Targeted Sequencing
- 7.3. Next Genration Sequencing Service Providers: List of Non-Industry Players
8. NEXT-GENERATION SEQUENCING: TECHNOLOGY LANDSCAPE
- 8.1. Chapter Overview
- 8.2. Next Genration Sequencing: Technology Landscape
- 8.2.1. Analysis by Type of Application
- 8.2.2. Analysis by Technology / Platform Run Time (Hours)
- 8.2.3. Analysis by Maximum Output (Gb)
- 8.2.4. Analysis by Maximum Base Pair Reads per Run (Million)
- 8.2.5. Analysis by Maximum Quality
- 8.2.6. Analysis by Sequencing Technique Used
- 8.3. Next-generation Sequencing: Technology / Platform Providers Landscape
- 8.3.1. Analysis by Year of Establishment
- 8.3.2. Analysis by Company Size
- 8.3.3. Analysis by Location of Headquarters (Country and Region)
- 8.3.4. Analysis by Company Size and Location of Headquarters (Region)
9. NEXT GENERATION SEQUENCING TECHNOLOGIES / PLATFORMS: COMPETITIVE ANALYSIS
- 9.1. Chapter Overview
- 9.2. Assumptions and Key Parameters
- 9.3. Methodology
- 9.4. Next generation sequencing Technologies / Platforms: Competitive Analysis
- 9.4.1. Next generation sequencing Technologies / Platforms Provided by Players based in North America
- 9.4.2. Next generation sequencing Technologies / Platforms Provided by Players based in Europe and Asia-Pacific
10. COMPANY PROFILES: NEXT GENERATION SEQUENCING SERVICE PROVIDERS
- 10.1. Chapter Overview
- 10.2. Admera Health
- 10.2.1. Company Overview
- 10.2.2. Service Portfolio
- 10.2.3. Recent Developments and Future Outlook
- 10.3. Applied Biological Materials
- 10.4. BGI Genomics
- 10.5. CD Genomics
- 10.6. DNA Link
- 10.7. Eurofins Genomics
- 10.8. Gene by Gene
- 10.9. GENEWIZ
- 10.10. MedGenome
- 10.11. Novogene
- 10.12. Psomagen
- 10.13. Veritas
- 10.14. Xcerlis Labs
11. COMPANY PROFILES: NEXT GENERATION SEQUENCING TECHNOLOGY PROVIDERS
- 11.1. Chapter Overview
- 11.2. Illumina
- 11.2.1. Company Overview
- 11.2.2. Technology / Platform Portfolio
- 11.2.3. Financial Information
- 11.3. MGI Tech
- 11.4. Oxford Nanopore Technologies
- 11.5. Pacific Biosciences
- 11.6. Thermo Fisher Scientific
12. PATENT ANALYSIS
- 12.1. Chapter Overview
- 12.2. Scope And Methodology
- 12.3. Next-generation Sequencing: Patent Analysis
- 12.3.1. Analysis by Patent Publication Year
- 12.3.2. Analysis by Type of Patent and Publication Year
- 12.3.3. Analysis by Patent Application Year
- 12.3.4. Analysis by Patent Jurisdiction
- 12.3.5. Analysis by CPC Symbols
- 12.3.6. Analysis by Type of Applicant
- 12.3.7. Leading Industry Players: Analysis by Number of Patents
- 12.3.8. Leading Non-Industry Players: Analysis by Number of Patents
- 12.4. Patent Benchmarking Analysis
- 12.4.1. Analysis by Patent Characteristics
- 12.5. Patent Valuation
- 12.6. Leading Patents by Number of Citations
13. CLINICAL TRIALS ANALYSIS
- 13.1. Chapter Overview
- 13.2. Scope and Methodology
- 13.3. Next-generation Sequencing: Clinical Trial Analysis
- 13.3.1. Analysis by Trial Registration Year
- 13.3.2. Analysis of Number of Patients Enrolled by Trial Registration Year
- 13.3.3. Analysis by Trial Phase
- 13.3.4. Analysis of Number of Patients Enrolled by Trial Phase
- 13.3.5. Analysis by Trial Status
- 13.3.6. Analysis by Trial Registration Year and Trial Status
- 13.3.7. Analysis by Target Patient Population
- 13.3.8. Analysis by Patient Gender
- 13.3.9. Analysis by Study Design
- 13.3.9.1. Analysis by Type of Allocation
- 13.3.9.2. Analysis by Type of Intervention Model
- 13.3.9.3. Analysis by Type of Masking
- 13.3.9.4. Analysis by Trial Purpose
- 13.3.10. Analysis by Type of Sponsor / Collaborator
- 13.3.11. Leading Players: Analysis by Number of Clinical Trials
- 13.3.12. Analysis by Geography
- 13.3.12.1. Analysis of Clinical Trials by Geography
- 13.3.12.2. Analysis of Clinical Trials by Geography and Trial Status
- 13.3.12.3. Analysis of Patients Enrolled by Geography and Trial Status
14. BIG PHARMA ANALYSIS
- 14.1 Chapter Overview
- 14.2. Scope and Methodology
- 14.3. Analysis by Year of Initiative
- 14.3.1. Analysis by Type of Initiative
- 14.3.2. Analysis by Type of Collaboration
- 14.3.3. Analysis by Focus Area
- 14.3.4. Most Active Big Pharma Players: Analysis by Number of Initiatives
15. CASE STUDY: NEXT GENERATION SEQUENCING INITIATIVES SPONSORED BY GOVERNMENT
- 15.1. Chapter Overview
- 15.2. Next-generation Sequencing: List of Government Sponsored Initiatives
- 15.2.1. Analysis by Initiative Establishment Year
- 15.2.2. Analysis by Aim and Objective of Initiative
- 15.2.3. Analysis by Geographical Reach
- 15.2.4. Analysis by Number of Individual's Genome Sequenced
- 15.2.5. Analysis by Focus Area
- 15.2.6. Analysis by Type of Partner
- 15.2.7. Analysis by Type of Sponsor
16. MARKET IMPACT ANALYSIS: DRIVERS, RESTRAINTS, OPPORTUNITIES AND CHALLENGES
- 16.1. Chapter Overview
- 16.2. Market Drivers
- 16.3. Market Restraints
- 16.4. Market Opportunities
- 16.5. Market Challenges
- 16.6. Conclusion
17. GLOBAL NEXT GENERATION SEQUENCING MARKET
- 17.1. Chapter Overview
- 17.2. Key Assumptions and Methodology
- 17.3. Global Next Generation Sequencing Market, Historical Trends (Since 2020) and Forecasted Estimates (Till 2035)
- 17.3.1. Scenario Analysis
- 17.3.1.1. Conservative Scenario
- 17.3.1.2. Optimistic Scenario
- 17.3.1. Scenario Analysis
- 17.4. Key Market Segmentations
18. NEXT GENERATION SEQUENCING MARKET: BY TYPE OF COMPONENT
- 18.1. Chapter Overview
- 18.2. Assumptions and Methodology
- 18.3. Next Generation Sequencing Market: Distribution by Type of Component
- 18.3.1. Next Generation Sequencing Market for Consumables, Historical Trends (Since 2020) and Forecasted Estimates (Till 2035)
- 18.3.2. Next Generation Sequencing Market for Services, Historical Trends (Since 2020) and Forecasted Estimates (Till 2035)
- 18.3.3. Next Generation Sequencing Market for Instruments, Historical Trends (Since 2020) and Forecasted Estimates (Till 2035)
- 18.4. Data Triangulation and Validation
19 NEXT GENERATION SEQUENCING MARKET: BY TYPE OF NGS TECHNIQUE
- 19.1. Chapter Overview
- 19.2. Assumptions and Methodology
- 19.3. Next Generation Sequencing Market: Distribution by Type of NGS technique
- 19.3.1. Next Generation Sequencing Market for Targeted Sequencing, Historical Trends (Since 2020) and Forecasted Estimates (Till 2035)
- 19.3.2. Next Generation Sequencing Market for Whole Genome Sequencing / Whole Exome Sequencing, Historical Trends (Since 2020) and Forecasted Estimates (Till 2035)
- 19.3.3. Next Generation Sequencing Market for RNA Sequencing, Historical Trends (Since 2020) and Forecasted Estimates (Till 2035)
- 19.3.4. Next Generation Sequencing Market for Other Techniques, Historical Trends (Since 2020) and Forecasted Estimates (Till 2035)
- 19.4. Data Triangulation and Validation
20. NEXT GENERATION SEQUENCING MARKET: BY TYPE OF TECHNOLOGY USED
- 20.1. Chapter Overview
- 20.2. Assumptions and Methodology
- 20.3. Next Generation Sequencing Market: Distribution by Type of Technology Used
- 20.3.1. Next Generation Sequencing Market for Sequencing by Synthesis Technology, Historical Trends (Since 2020) and Forecasted Estimates (Till2035)
- 20.3.2. Next Generation Sequencing Market for Ion Semiconductor Technology, Historical Trends (Since 2020) and Forecasted Estimates (Till 2035)
- 20.3.3. Next Generation Sequencing Market for Nanopore Sequencing Technology, Historical Trends (Since 2020) and Forecasted Estimates (Till 2035)
- 20.3.4. Next Generation Sequencing Market for Other Technologies, Historical Trends (Since 2020) and Forecasted Estimates (Till 2035)
- 20.4. Data Triangulation and Validation
21. NEXT GENERATION SEQUENCING MARKET: BY APPLICATION AREA
- 21.1. Chapter Overview
- 21.2. Assumptions and Methodology
- 21.3. Next Generation Sequencing Market: Distribution by Application Area
- 21.3.1. Next Generation Sequencing Market for Clinical Applications, Historical Trends (Since 2020) and Forecasted Estimates (Till 2035)
- 21.3.2. Next Generation Sequencing Market for Research and Applied Applications, Historical Trends (Since 2020) and Forecasted Estimates (Till 2035)
- 21.4. Data Triangulation and Validation
22. NEXT GENERATION SEQUENCING MARKET: BY TARGET THERAPEUTIC AREA
- 22.1. Chapter Overview
- 22.2. Assumptions and Methodology
- 22.3. Next Generation Sequencing Market: Distribution by Target Therapeutic Area
- 22.3.1. Next Generation Sequencing Market for Oncological Disorders, Historical Trends (Since 2020) and Forecasted Estimates (Till 2035)
- 22.3.2. Next Generation Sequencing Market for Genetic Disorders, Historical Trends (Since 2020) and Forecasted Estimates (Till 2035)
- 22.3.3. Next Generation Sequencing Market for Reproductive Disorders, Historical Trends (Since 2020) and Forecasted Estimates (Till 2035)
- 22.3.4. Next Generation Sequencing Market for Other Therapeutic Areas, Historical Trends (Since 2020) and Forecasted Estimates (Till 2035)
- 22.4. Data Triangulation and Validation
23. NEXT GENERATION SEQUENCING MARKET: BY PURPOSE
- 23.1. Chapter Overview
- 23.2. Assumptions and Methodology
- 23.3. Next Generation Sequencing Market: Distribution by Purpose
- 23.3.1. Next Generation Sequencing Market for Diagnosis, Historical Trends (Since 2020) and Forecasted Estimates (Till 2035)
- 23.3.2. Next Generation Sequencing Market for Risk Assessment, Historical Trends (Since 2020) and Forecasted Estimates (Till 2035)
- 23.3.3. Next Generation Sequencing Market for Presymptomatic Assessment, Historical Trends (Since 2020) and Forecasted Estimates (Till 2035)
- 23.3.4. Next Generation Sequencing Market for Screening, Historical Trends (Since 2020) and Forecasted Estimates (Till 2035)
- 23.3.5. Next Generation Sequencing Market for Other Purposes, Historical Trends (Since 2020) and Forecasted Estimates (Till 2035)
- 23.4. Data Triangulation and Validation
24. NEXT GENERATION SEQUENCING MARKET: BY END USERS
- 24.1. Chapter Overview
- 24.2. Assumptions and Methodology
- 24.3. Next Generation Sequencing Market: Distribution by End Users
- 24.3.1. Next Generation Sequencing Market for Academic and Research Institutes, Historical Trends (Since 2020) and Forecasted Estimates (Till 2035)
- 24.3.2. Next Generation Sequencing Market for Hospitals and Clinics, Historical Trends (Since 2020) and Forecasted Estimates (Till 2035)
- 24.3.3. Next Generation Sequencing Market for Pharmaceutical and Biotechnology Companies, Historical Trends (Since 2020) and Forecasted Estimates (Till 2035)
- 24.3.4. Next Generation Sequencing Market for Other End Users, Historical Trends (Since 2020) and Forecasted Estimates (Till 2035)
- 24.4. Data Triangulation and Validation
25. NEXT GENERATION SEQUENCING MARKET: BY GEOGRAPHICAL REGIONS
- 25.1. Chapter Overview
- 25.2. Assumptions and Methodology
- 25.3. Next Generation Sequencing Market: Distribution by Geographical Regions
- 25.3.1. Next Generation Sequencing Market in North America, Historical Trends (Since 2020) and Forecasted Estimates (Till 2035) (USD Billion)
- 25.3.1.1. Next Generation Sequencing Market in the US, Historical Trends (Since 2020) and Forecasted Estimates (Till 2035) (USD Billion)
- 25.3.1.2. Next Generation Sequencing Market in Canada, Historical Trends (Since 2020) and Forecasted Estimates (Till 2035) (USD Billion)
- 25.3.2. Next Generation Sequencing Market in Europe, Historical Trends (Since 2020) and Forecasted Estimates (Till 2035) (USD Billion)
- 25.3.2.1. Next Generation Sequencing Market in Germany, Historical Trends (Since 2020) and Forecasted Estimates (Till 2035) (USD Billion)
- 25.3.2.2. Next Generation Sequencing Market in France, Historical Trends (Since 2020) and Forecasted Estimates (Till 2035) (USD Billion)
- 25.3.2.3. Next Generation Sequencing Market in Italy, Historical Trends (Since 2020) and Forecasted Estimates (Till 2035) (USD Billion)
- 25.3.2.4. Next Generation Sequencing Market in Spain, Historical Trends (Since 2020) and Forecasted Estimates (Till 2035) (USD Billion)
- 25.3.2.5. Next Generation Sequencing Market in the UK, Historical Trends (Since 2020) and Forecasted Estimates (Till 2035) (USD Billion)
- 25.3.2.6. Next Generation Sequencing Market in Rest of Europe, Historical Trends (Since 2020) and Forecasted Estimates (Till 2035) (USD Billion)
- 25.3.3. Next Generation Sequencing Market in Asia-Pacific, Historical Trends (Since 2020) and Forecasted Estimates (Till 2035) (USD Billion)
- 25.3.3.1. Next Generation Sequencing Market in China, Historical Trends (Since 2020) and Forecasted Estimates (Till 2035) (USD Billion)
- 25.3.3.2. Next Generation Sequencing Market in India, Historical Trends (Since 2020) and Forecasted Estimates (Till 2035) (USD Billion)
- 25.3.3.3. Next Generation Sequencing Market in Japan, Historical Trends (Since 2020) and Forecasted Estimates (Till 2035) (USD Billion)
- 25.3.3.4. Next Generation Sequencing Market in South Korea, Historical Trends (Since 2020) and Forecasted Estimates (Till 2035) (USD Billion)
- 25.3.3.5. Next Generation Sequencing Market in Singapore, Historical Trends (Since 2020) and Forecasted Estimates (Till 2035) (USD Billion)
- 25.3.3.6. Next Generation Sequencing Market in Rest of Asia-Pacific, Historical Trends (Since 2020) and Forecasted Estimates (Till 2035) (USD Billion)
- 25.3.4. Next Generation Sequencing Market in Middle East and North Africa, Historical Trends (Since 2020) and Forecasted Estimates (Till 2035) (USD Billion)
- 25.3.4.1. Next Generation Sequencing Market in Egypt, Historical Trends (Since 2020) and Forecasted Estimates (Till 2035) (USD Billion)
- 25.3.4.2. Next Generation Sequencing Market in Israel, Historical Trends (Since 2020) and Forecasted Estimates (Till 2035) (USD Billion)
- 25.3.4.3. Next Generation Sequencing Market in Saudi Arabia, Historical Trends (Since 2020) and Forecasted Estimates (Till 2035) (USD Billion)
- 25.3.4.4. Next Generation Sequencing Market in Rest of Middle East and North Africa, Historical Trends (Since 2020) and Forecasted Estimates (Till 2035) (USD Billion)
- 25.3.5. Next Generation Sequencing Market in Latin America, Historical Trends (Since 2020) and Forecasted Estimates (Till 2035) (USD Billion)
- 25.3.5.1. Next Generation Sequencing Market in Brazil, Historical Trends (Since 2020) and Forecasted Estimates (Till 2035) (USD Billion)
- 25.3.5.2. Next Generation Sequencing Market in Argentina, Historical Trends (Since 2020) and Forecasted Estimates (Till 2035) (USD Billion)
- 25.3.5.3. Next Generation Sequencing Market in Rest of Latin America, Historical Trends (Since 2020) and Forecasted Estimates (Till 2035) (USD Billion)
- 25.3.1. Next Generation Sequencing Market in North America, Historical Trends (Since 2020) and Forecasted Estimates (Till 2035) (USD Billion)
- 25.4. Next Generation Sequencing Market, by Geographical Regions: Market Dynamics Assessment
- 25.4.1. Penetration Growth (P-G) Matrix
- 25.4.2. Market Movement Analysis
- 25.5. Data Triangulation and Validation
26. CONCLUDING REMARKS
27. EXECUTIVE INSIGHTS
28. APPENDIX 1: TABULATED DATA
29. APPENDIX 1: TABULATED COMPANIES AND ORGANIZATIONS
List of Tables
- Table 6.1 Comparison of First, Second and Third Generation Sequencing Technologies
- Table 7.1 Next generation sequencing Service Providers: Information on Year of Establishment, Company Size and Location of Headquarters
- Table 7.2 Next generation sequencing Service Providers: Information on Type of Service Offered and Additional Service Offered
- Table 7.3 Next generation sequencing Service Providers: Information on Type of Sample Used and Type of Technology / Platform Used for Whole Genome Sequencing, Whole Exome Sequencing and Targeted Sequencing
- Table 7.4 Next generation sequencing Service Providers: List of Non-Industry Players
- Table 8.1 Next generation sequencing Technologies / Platforms: Information on Provider, Type of Application and Technology Run Time (Hours)
- Table 8.2 Next generation sequencing Technologies / Platforms: Information on Maximum Output, Maximum Base Pair Reads Per Run, Maximum Quality and Sequencing Technique
- Table 8.3 Next generation sequencing Technology / Platform Providers: Information on Year of Establishment, Company Size, Location of Headquarters (Country and Region)
- Table 10.1 Next generation sequencing Service Providers: List of Companies Profiled
- Table 10.2 Admera Health: Company Overview
- Table 10.3 Admera Health: Service Portfolio
- Table 10.4 Admera Health: Recent Developments and Future Outlook
- Table 10.5 Applied Biological Materials: Company Overview
- Table 10.6 Applied Biological Materials: Service Portfolio
- Table 10.7 BGI: Company Overview
- Table 10.8 BGI: Service Portfolio
- Table 10.9 BGI: Recent Developments and Future Outlook
- Table 10.10 CD Genomics: Company Overview
- Table 10.11 CD Genomics: Service Portfolio
- Table 10.12 DNA Link: Company Overview
- Table 10.13 DNA Link: Service Portfolio
- Table 10.14 Eurofins Genomics: Company Overview
- Table 10.15 Eurofins Genomics: Service Portfolio
- Table 10.16 Gene by Gene: Company Overview
- Table 10.17 Gene by Gene: Service Portfolio
- Table 10.18 Genewiz: Company Overview
- Table 10.19 Genewiz: Service Portfolio
- Table 10.20 Medgenome: Company Overview
- Table 10.21 Medgenome: Service Portfolio
- Table 10.22 Medgenome: Recent Developments and Future Outlook
- Table 10.23 Novogene: Company Overview
- Table 10.24 Novogene: Service Portfolio
- Table 10.25 Novogene: Recent Developments and Future Outlook
- Table 10.26 Psomagen: Company Overview
- Table 10.27 Psomagen: Service Portfolio
- Table 10.28 Psomagen: Recent Developments and Future Outlook
- Table 10.29 Veritas: Company Overview
- Table 10.30 Veritas: Service Portfolio
- Table 10.31 Veritas: Recent Developments and Future Outlook
- Table 10.32 Xcelris Labs: Company Overview
- Table 10.33 Xcelris Labs: Service Portfolio
- Table 11.1 Next generation sequencing Technology / Platform Providers: List of Companies Profiled
- Table 11.2 Illumina: Company Overview
- Table 11.3 Illumina: Technology / Platform Portfolio
- Table 11.4 MGI Tech: Company Overview
- Table 11.5 MGI Tech: Technology / Platform Portfolio
- Table 11.6 Oxford Nanopore Technologies: Company Overview
- Table 11.7 Oxford Nanopore Technologies: Technology / Platform Portfolio
- Table 11.8 Pacific Biosciences: Company Overview
- Table 11.9 Pacific Biosciences: Technology / Platform Portfolio
- Table 11.10 Thermo Fisher Scientific: Company Overview
- Table 11.11 Thermo Fisher Scientific: Technology / Platform Portfolio
- Table 12.1 Patent Analysis: Top CPC Sections
- Table 12.2 Patent Analysis: Top CPC Symbols
- Table 12.3 Patent Analysis: Top CPC Codes
- Table 12.4 Patent Analysis: Summary of Benchmarking Analysis
- Table 12.5 Patent Analysis: Categorization based on Weighted Valuation Scores
- Table 12.6 Patent Portfolio: List of Leading Patents (by Highest Relative Valuation)
- Table 15.1 Next generation sequencing Initiatives: Information on Initiative Establishment Year, Aim and Objective of Initiative, and Geographical Reach,
- Table 15.2 Next generation sequencing Initiatives: Information on Number of Individual's Genome Sequenced, Focus Area, Type of Partner and Type of Sponsor
- Table 28.1 Next generation sequencing Service Providers: Distribution by Year of Establishment
- Table 28.2 Next generation sequencing Service Providers: Distribution by Company Size
- Table 28.3 Next generation sequencing Service Providers: Distribution by Location of Headquarters
- Table 28.4 Next generation sequencing Service Providers: Distribution by Company Size and Location of Headquarters (Region)
- Table 28.5 Next generation sequencing Service Providers: Distribution by Type of Service Offered
- Table 28.6 Next generation sequencing Service Providers: Distribution by Additional Service Offered
- Table 28.7 Next generation sequencing Service Providers: Distribution by Type of Sample Used for Whole Genome Sequencing
- Table 28.8 Next generation sequencing Service Providers: Distribution by Type of Technology / Platform Used for Whole Genome Sequencing
- Table 28.9 Next generation sequencing Service Providers: Distribution by Type of Sample Used for Whole Exome Sequencing
- Table 28.10 Next generation sequencing Service Providers: Distribution by Type of Technology / Platform Used for Whole Exome Sequencing
- Table 28.11 Next generation sequencing Service Providers: Distribution by Type of Sample Used for Targeted Sequencing
- Table 28.12 Next generation sequencing Service Providers: Distribution by Type of Technology / Platform Used for Targeted Sequencing
- Table 28.13 Next generation sequencing Technologies / Platforms: Distribution by Type of Application
- Table 28.14 Next generation sequencing Technologies / Platforms: Distribution by Technology / Platform Run Time (Hours)
- Table 28.15 Next generation sequencing Technologies / Platforms: Distribution by Maximum Output (Gb)
- Table 28.16 Next generation sequencing Technologies / Platforms: Distribution by Maximum Base Pair Reads Per Run (Million)
- Table 28.17 Next generation sequencing Technologies / Platforms: Distribution by Maximum Quality
- Table 28.18 Next generation sequencing Technologies / Platforms: Distribution by Sequencing Technique Used
- Table 28.19 Next generation sequencing Technology / Platform Providers: Distribution by Year of Establishment
- Table 28.20 Next generation sequencing Technology / Platform Providers: Distribution by Company Size
- Table 28.21 Next generation sequencing Technology / Platform Providers: Distribution by Location of Headquarters (Country and Region)
- Table 28.22 Next generation sequencing Technology / Platform Providers: Distribution by Company Size and Location of Headquarters (Region)
- Table 28.23 Illumina: Annual Revenues, FY 2019 Onwards (USD Billion)
- Table 28.24 Oxford Nanopore Technologies: Annual Revenues, FY 2020 Onwards (GBP Billion)
- Table 28.25 Pacific Biosciences: Annual Revenues, FY 2019 Onwards (USD Billion)
- Table 28.26 Thermo Fischer Scientific: Annual Revenues, FY 2019 Onwards (USD Billion)
- Table 28.27 Patent Analysis: Distribution by Type of Patent
- Table 28.28 Patent Analysis: Cumulative Distribution by Patent Publication Year, Since 2020
- Table 28.29 Patent Analysis: Distribution by Type of Patent and Publication Year, Since 2020
- Table 28.30 Patent Analysis: Distribution by Patent Application Year, Since 2010
- Table 28.31 Patent Analysis: Distribution by Patent Jurisdiction
- Table 28.32 Patent Analysis: Cumulative Year-wise Distribution by Type of Applicant, Since 2020
- Table 28.33 Leading Industry Players: Distribution by Number of Patents
- Table 28.34 Leading Non-Industry Players: Distribution by Number of Patents
- Table 28.35 Patent Analysis: Distribution by Patent Age
- Table 28.36 Next-generation Sequencing: Patent Valuation
- Table 28.37 Clinical Trial Analysis: Cumulative Year-wise Trend, Since 2020
- Table 28.38 Clinical Trial Analysis: Distribution of Number of Patients Enrolled by Trial Registration Year, Since 2020
- Table 28.39 Clinical Trial Analysis: Distribution by Trial Phase
- Table 28.40 Clinical Trial Analysis: Distribution of Number of Patients Enrolled by Trial Phase
- Table 28.41 Clinical Trial Analysis: Distribution by Trial Status
- Table 28.42 Clinical Trial Analysis: Distribution by Trial Registration Year and Trial Status, Since 2020
- Table 28.43 Clinical Trial Analysis: Distribution by Target Patient Population
- Table 28.44 Clinical Trial Analysis: Distribution by Patient Gender
- Table 28.45 Clinical Trial Analysis: Distribution by Type of Allocation
- Table 28.46 Clinical Trial Analysis: Distribution by Type of Intervention Model
- Table 28.47 Clinical Trial Analysis: Distribution by Type of Masking
- Table 28.48 Clinical Trial Analysis: Distribution by Trial Purpose
- Table 28.49 Clinical Trial Analysis: Distribution by Type of Sponsor / Collaborator
- Table 28.50 Leading Players: Distribution by Number of Clinical Trials
- Table 28.51 Clinical Trial Analysis: Distribution of Clinical Trials by Geography
- Table 28.52 Clinical Trial Analysis: Distribution of Clinical Trials by Geography and Trial Status
- Table 28.53 Clinical Trial Analysis: Distribution of Patients Enrolled by Geography and Trial Status
- Table 28.54 Big Pharma Initiatives: Distribution by Year of Initiative, Since 2020
- Table 28.55 Big Pharma Initiatives: Distribution by Type of Initiative
- Table 28.56 Big Pharma Initiatives: Distribution by Type of Collaboration
- Table 28.57 Big Pharma Initiatives: Distribution by Focus Area
- Table 28.58 Most Active Big Pharma Players: Distribution by Number of Initiatives
- Table 28.59 Next generation sequencing Initiatives: Distribution by Initiative Establishment Year
- Table 28.60 Next generation sequencing Initiatives: Distribution by Aim and Objective of Initiative
- Table 28.61 Next generation sequencing Initiatives: Distribution by Geographical Reach (Region)
- Table 28.62 Next generation sequencing Initiatives: Distribution by Number of Individual's Genome Sequenced
- Table 28.63 Next generation sequencing Initiatives: Distribution by Focus Area
- Table 28.64 Next generation sequencing Initiatives: Distribution by Type of Partner
- Table 28.65 Next generation sequencing Initiatives: Distribution by Type of Sponsor
- Table 28.66 Global Next Generation Sequencing Market, Historical Trends (Since 2020) and Forecasted Estimates (Till 2035) (USD Billion)
- Table 28.67 Global Next Generation Sequencing Market, Forecasted Estimates (Till 2035): Conservative Scenario (USD Billion)
- Table 28.68 Global Next Generation Sequencing Market, Forecasted Estimates (Till 2035): Optimistic Scenario (USD Billion)
- Table 28.69 Next Generation Sequencing Market: Distribution by Type of Component
- Table 28.70 Next Generation Sequencing Market for Consumables, Historical Trends (Since 2020) and Forecasted Estimates (Till 2035) (USD Billion)
- Table 28.71 Next Generation Sequencing Market for Services, Historical Trends (Since 2020) and Forecasted Estimates (Till 2035) (USD Billion)
- Table 28.72 Next Generation Sequencing Market for Instruments, Historical Trends (Since 2020) and Forecasted Estimates (Till 2035) (USD Billion)
- Table 28.73 Next Generation Sequencing Market: Distribution by Type of NGS technique
- Table 28.74 Next Generation Sequencing Market for Targeted Sequencing, Historical Trends (Since 2020) and Forecasted Estimates (Till 2035) (USD Billion)
- Table 28.75 Next Generation Sequencing Market for Whole Genome Sequencing / Whole Exome Sequencing, Historical Trends (Since 2020) and Forecasted Estimates (Till 2035) (USD Billion)
- Table 28.76 Next Generation Sequencing Market for RNA Sequencing, Historical Trends (Since 2020) and Forecasted Estimates (Till 2035) (USD Billion)
- Table 28.77 Next Generation Sequencing Market for Other Techniques, Historical Trends (Since 2020) and Forecasted Estimates (Till 2035) (USD Billion)
- Table 28.78 Next Generation Sequencing Market: Distribution by Type of Technology Used
- Table 28.79 Next Generation Sequencing Market for Sequencing by Synthesis Technology, Historical Trends (2828-2824) and Forecasted Estimates (2825-2835) (USD Billion)
- Table 28.80 Next Generation Sequencing Market for Ion Semiconductor Technology, Historical Trends (2828-2824) and Forecasted Estimates (2825-2835) (USD Billion)
- Table 28.81 Next Generation Sequencing Market for Nanopore Sequencing Technology, Historical Trends (2828-2824) and Forecasted Estimates (2825-2835) (USD Billion)
- Table 28.82 Next Generation Sequencing Market for Other Technologies, Historical Trends (2828-2824) and Forecasted Estimates (2825-2835) (USD Billion)
- Table 28.83 Next Generation Sequencing Market: Distribution by Application Area
- Table 28.84 Next Generation Sequencing Market for Clinical Applications, Historical Trends (Since 2020) and Forecasted Estimates (Till 2035) (USD Billion)
- Table 28.85 Next Generation Sequencing Market for Research and Applied Applications, Historical Trends (Since 2020) and Forecasted Estimates (Till 2035) (USD Billion)
- Table 28.86 Next Generation Sequencing Market: Distribution by Target Therapeutic Area
- Table 28.87 Next Generation Sequencing Market for Oncological Disorders, Historical Trends (Since 2020) and Forecasted Estimates (Till 2035) (USD Billion)
- Table 28.88 Next Generation Sequencing Market for Genetic Disorders, Historical Trends (Since 2020) and Forecasted Estimates (Till 2035) (USD Billion)
- Table 28.89 Next Generation Sequencing Market for Reproductive Disorders, Historical Trends (Since 2020) and Forecasted Estimates (Till 2035) (USD Billion)
- Table 28.90 Next Generation Sequencing Market for Other Therapeutic Areas, Historical Trends (Since 2020) and Forecasted Estimates (Till 2035) (USD Billion)
- Table 28.91 Next Generation Sequencing Market: Distribution by Purpose
- Table 28.92 Next Generation Sequencing Market for Diagnosis, Historical Trends (Since 2020) and Forecasted Estimates (Till 2035) (USD Billion)
- Table 28.93 Next Generation Sequencing Market for Risk Assessment, Historical Trends (Since 2020) and Forecasted Estimates (Till 2035) (USD Billion)
- Table 28.94 Next Generation Sequencing Market for Presymptomatic Assessment, Historical Trends (Since 2020) and Forecasted Estimates (Till 2035) (USD Billion)
- Table 28.95 Next Generation Sequencing Market for Screening, Historical Trends (Since 2020) and Forecasted Estimates (Till 2035) (USD Billion)
- Table 28.96 Next Generation Sequencing Market for Other Purposes, Historical Trends (Since 2020) and Forecasted Estimates (Till 2035) (USD Billion)
- Table 28.97 Next Generation Sequencing Market: Distribution by End users
- Table 28.98 Next Generation Sequencing Market for Academic and Research Institutes, Historical Trends (Since 2020) and Forecasted Estimates (Till 2035) (USD Billion)
- Table 28.99 Next Generation Sequencing Market for Hospitals and Clinics, Historical Trends (Since 2020) and Forecasted Estimates (Till 2035) (USD Billion)
- Table 28.100 Next Generation Sequencing Market for Pharmaceutical and Biotechnology Companies, Historical Trends (Since 2020) and Forecasted Estimates (Till 2035) (USD Billion)
- Table 28.101 Next Generation Sequencing Market for Other End Users, Historical Trends (Since 2020) and Forecasted Estimates (Till 2035) (USD Billion)
- Table 28.102 Next Generation Sequencing Market: Distribution by Geographical Regions
- Table 28.103 Next Generation Sequencing Market in North America, Historical Trends (Since 2020) and Forecasted Estimates (Till 2035) (USD Billion)
- Table 28.104 Next Generation Sequencing Market in the US, Historical Trends (Since 2020) and Forecasted Estimates (Till 2035) (USD Billion)
- Table 28.105 Next Generation Sequencing Market in Canada, Historical Trends (Since 2020) and Forecasted Estimates (Till 2035) (USD Billion)
- Table 28.106 Next Generation Sequencing Market in Europe, Historical Trends (Since 2020) and Forecasted Estimates (Till 2035) (USD Billion)
- Table 28.107 Next Generation Sequencing Market in Germany, Historical Trends (Since 2020) and Forecasted Estimates (Till 2035) (USD Billion)
- Table 28.108 Next Generation Sequencing Market in France, Historical Trends (Since 2020) and Forecasted Estimates (Till 2035) (USD Billion)
- Table 28.109 Next Generation Sequencing Market in Italy, Historical Trends (Since 2020) and Forecasted Estimates (Till 2035) (USD Billion)
- Table 28.110 Next Generation Sequencing Market in Spain, Historical Trends (Since 2020) and Forecasted Estimates (Till 2035) (USD Billion)
- Table 28.111 Next Generation Sequencing Market in the UK, Historical Trends (Since 2020) and Forecasted Estimates (Till 2035) (USD Billion)
- Table 28.112 Next Generation Sequencing Market in Rest of Europe, Historical Trends (Since 2020) and Forecasted Estimates (Till 2035) (USD Billion)
- Table 28.113 Next Generation Sequencing Market in Asia-Pacific, Historical Trends (Since 2020) and Forecasted Estimates (Till 2035) (USD Billion)
- Table 28.114 Next Generation Sequencing Market in China, Historical Trends (Since 2020) and Forecasted Estimates (Till 2035) (USD Billion)
- Table 28.115 Next Generation Sequencing Market in India, Historical Trends (Since 2020) and Forecasted Estimates (Till 2035) (USD Billion)
- Table 28.116 Next Generation Sequencing Market in Japan, Historical Trends (Since 2020) and Forecasted Estimates (Till 2035) (USD Billion)
- Table 28.117 Next Generation Sequencing Market in South Korea, Historical Trends (Since 2020) and Forecasted Estimates (Till 2035) (USD Billion)
- Table 28.118 Next Generation Sequencing Market in Singapore, Historical Trends (Since 2020) and Forecasted Estimates (Till 2035) (USD Billion)
- Table 28.119 Next Generation Sequencing Market in Rest of Asia-Pacific, Historical Trends (Since 2020) and Forecasted Estimates (Till 2035) (USD Billion)
- Table 28.120 Next Generation Sequencing Market in Middle East and North Africa, Historical Trends (Since 2020) and Forecasted Estimates (Till 2035) (USD Billion)
- Table 28.121 Next Generation Sequencing Market in Egypt, Historical Trends (Since 2020) and Forecasted Estimates (Till 2035) (USD Billion)
- Table 28.122 Next Generation Sequencing Market in Israel, Historical Trends (Since 2020) and Forecasted Estimates (Till 2035) (USD Billion)
- Table 28.123 Next Generation Sequencing Market in Saudi Arabia, Historical Trends (Since 2020) and Forecasted Estimates (Till 2035) (USD Billion)
- Table 28.124 Next Generation Sequencing Market in Rest of Middle East and North Africa, Historical Trends (Since 2020) and Forecasted Estimates (Till 2035) (USD Billion)
- Table 28.125 Next Generation Sequencing Market in Latin America, Historical Trends (Since 2020) and Forecasted Estimates (Till 2035) (USD Billion)
- Table 28.126 Next Generation Sequencing Market in Brazil, Historical Trends (Since 2020) and Forecasted Estimates (Till 2035) (USD Billion)
- Table 28.127 Next Generation Sequencing Market in Argentina, Historical Trends (Since 2020) and Forecasted Estimates (Till 2035) (USD Billion)
- Table 28.128 Next Generation Sequencing Market in Rest of Latin America, Historical Trends (Since 2020) and Forecasted Estimates (Till 2035) (USD Billion)
List of Figures
- Figure 2.1 Research Methodology: Project Methodology
- Figure 2.2 Research Methodology: Data Sources for Secondary Research
- Figure 2.3 Research Methodology: Robust Quality Control
- Figure 3.1 Market Dynamics: Forecast Methodology
- Figure 3.2 Market Dynamics: Market Assessment Framework
- Figure 4.1 Lessons Learnt from Past Recessions
- Figure 5.1 Executive Summary: Market Landscape
- Figure 5.2 Executive Summary: Market Trends
- Figure 5.3 Executive Summary: Market Forecast and Opportunity Analysis
- Figure 6.1 Workflow of Whole Genome Sequencing
- Figure 6.2 Types of Sequencing
- Figure 6.3 Evolution of Next-generation Sequencing
- Figure 6.4 Third Generation HT-NGS Platforms
- Figure 6.5 Applications of Genome Sequencing
- Figure 6.6 Challenges Associated with Genome Sequencing
- Figure 7.1 Next generation sequencing Service Providers: Distribution by Year of Establishment
- Figure 7.2 Next generation sequencing Service Providers: Distribution by Company Size
- Figure 7.3 Next generation sequencing Service Providers: Distribution by Location of Headquarters
- Figure 7.4 Next generation sequencing Service Providers: Distribution by Company Size and Location of Headquarters (Region)
- Figure 7.5 Next generation sequencing Service Providers: Distribution by Type of Service Offered
- Figure 7.6 Next generation sequencing Service Providers: Distribution by Additional Service Offered
- Figure 7.7 Next generation sequencing Service Providers: Distribution by Type of Sample Used for Whole Genome Sequencing
- Figure 7.8 Next generation sequencing Service Providers: Distribution by Type of Technology / Platform Used for Whole Genome Sequencing
- Figure 7.9 Next generation sequencing Service Providers: Distribution by Type of Sample Used for Whole Exome Sequencing
- Figure 7.10 Next generation sequencing Service Providers: Distribution by Type of Technology / Platform Used for Whole Exome Sequencing
- Figure 7.11 Next generation sequencing Service Providers: Distribution by Type of Sample Used for Targeted Sequencing
- Figure 7.12 Next generation sequencing Service Providers: Distribution by Type of Technology / Platform Used for Targeted Sequencing
- Figure 8.1 Next generation sequencing Technologies / Platforms: Distribution by Type of Application
- Figure 8.2 Next generation sequencing Technologies / Platforms: Distribution by Technology / Platform Run Time (Hours)
- Figure 8.3 Next generation sequencing Technologies / Platforms: Distribution by Maximum Output (Gb)
- Figure 8.4 Next generation sequencing Technologies / Platforms: Distribution by Maximum Base Pair Reads Per Run (Million)
- Figure 8.5 Next generation sequencing Technologies / Platforms: Distribution by Maximum Quality
- Figure 8.6 Next generation sequencing Technologies / Platforms: Distribution by Sequencing Technique Used
- Figure 8.7 Next generation sequencing Technology / Platform Providers: Distribution by Year of Establishment
- Figure 8.8 Next generation sequencing Technology / Platform Providers: Distribution by Company Size
- Figure 8.9 Next generation sequencing Technology / Platform Providers: Distribution by Location of Headquarters (Country and Region)
- Figure 8.10 Next generation sequencing Technology / Platform Providers: Distribution by Company Size and Location of Headquarters (Region)
- Figure 9.1 Competitive Analysis: Next generation sequencing Technologies / Platforms Provided by Players based in North America
- Figure 9.2 Competitive Analysis: Next generation sequencing Technologies / Platforms Provided by Players based in Europe and Asia-Pacific
- Figure 11.1 Illumina: Annual Revenues, FY 2019 Onwards (USD Billion)
- Figure 11.2 Oxford Nanopore Technologies: Annual Revenues, FY 2020 Onwards (GBP Billion)
- Figure 11.3 Pacific Biosciences: Annual Revenues, FY 2019 Onwards (USD Billion)
- Figure 11.4 Thermo Fischer Scientific: Annual Revenues, FY 2019 Onwards (USD Billion)
- Figure 12.1 Patent Analysis: Distribution by Type of Patent
- Figure 12.2 Patent Analysis: Cumulative Distribution by Patent Publication Year, Since 2020
- Figure 12.3 Patent Analysis: Distribution by Type of Patent and Publication Year, Since 2020
- Figure 12.4 Patent Analysis: Distribution by Patent Application Year, Since 2010
- Figure 12.5 Patent Analysis: Distribution by Patent Jurisdiction
- Figure 12.6 Patent Analysis: Distribution by CPC Symbols
- Figure 12.7 Patent Analysis: Cumulative Year-wise Distribution by Type of Applicant, Since 2020
- Figure 12.8 Leading Industry Players: Distribution by Number of Patents
- Figure 12.9 Leading Non-Industry Players: Distribution by Number of Patents
- Figure 12.10Patent Benchmarking Analysis: Distribution of Patent Characteristics (CPC Codes) by Leading Industry Players
- Figure 12.11 Patent Benchmarking Analysis: Distribution of Leading Industry Players by Patent Characteristics (CPC Codes)
- Figure 12.12 Patent Analysis: Distribution by Patent Age
- Figure 12.13 Next-generation Sequencing: Patent Valuation
- Figure 13.1 Clinical Trial Analysis: Cumulative Year-wise Trend, Since 2020
- Figure 13.2 Clinical Trial Analysis: Distribution of Number of Patients Enrolled by Trial Registration Year, Since 2020
- Figure 13.3 Clinical Trial Analysis: Distribution by Trial Phase
- Figure 13.4 Clinical Trial Analysis: Distribution of Number of Patients Enrolled by Trial Phase
- Figure 13.5 Clinical Trial Analysis: Distribution by Trial Status
- Figure 13.6 Clinical Trial Analysis: Distribution by Trial Registration Year and Trial Status, Since 2020
- Figure 13.7 Clinical Trial Analysis: Distribution by Target Patient Population
- Figure 13.8 Clinical Trial Analysis: Distribution by Patient Gender
- Figure 13.9 Clinical Trial Analysis: Distribution by Type of Allocation
- Figure 13.10 Clinical Trial Analysis: Distribution by Type of Intervention Model
- Figure 13.11 Clinical Trial Analysis: Distribution by Type of Masking
- Figure 13.12 Clinical Trial Analysis: Distribution by Trial Purpose
- Figure 13.13 Clinical Trial Analysis: Distribution by Type of Sponsor / Collaborator
- Figure 13.14 Leading Players: Distribution by Number of Clinical Trials
- Figure 13.15 Clinical Trial Analysis: Distribution of Clinical Trials by Geography
- Figure 13.16 Clinical Trial Analysis: Distribution of Clinical Trials by Geography and Trial Status
- Figure 13.17 Clinical Trial Analysis: Distribution of Patients Enrolled by Geography and Trial Status
- Figure 14.1 Big Pharma Initiatives: Distribution by Year of Initiative, Since 2020
- Figure 14.2 Big Pharma Initiatives: Distribution by Type of Initiative
- Figure 14.3 Big Pharma Initiatives: Heat Map Analysis by Type of Initiative
- Figure 14.4 Big Pharma Initiatives: Distribution by Type of Collaboration
- Figure 14.5 Big Pharma Initiatives: Heat Map Analysis by Type of Collaboration
- Figure 14.6 Big Pharma Initiatives: Distribution by Focus Area
- Figure 14.7 Big Pharma Initiatives: Heat Map Analysis by Focus Area
- Figure 14.8 Most Active Big Pharma Players: Distribution by Number of Initiatives
- Figure 15.1 Next Generation Sequencing Initiatives: Distribution by Initiative Establishment Year
- Figure 15.2 Next Generation Sequencing Initiatives: Distribution by Aim and Objective of Initiative
- Figure 15.3 Next Generation Sequencing Initiatives: Distribution by Geographical Reach (Region)
- Figure 15.4 Next Generation Sequencing Initiatives: Distribution by Number of Individual's Genome Sequenced
- Figure 15.5 Next Generation Sequencing Initiatives: Distribution by Focus Area
- Figure 15.6 Next Generation Sequencing Initiatives: Distribution by Type of Partner
- Figure 15.7 Next generation sequencing Initiatives: Distribution by Type of Sponsor
- Figure 17.1 Global Next Generation Sequencing Market, Historical Trends (Since 2020) and Forecasted Estimates (Till 2035) (USD Billion)
- Figure 17.2 Global Next Generation Sequencing Market, Forecasted Estimates (Till 2035): Conservative Scenario (USD Billion)
- Figure 17.3 Global Next Generation Sequencing Market, Forecasted Estimates (Till 2035): Optimistic Scenario (USD Billion)
- Figure 18.1 Next Generation Sequencing Market: Distribution by Type of Component
- Figure 18.2 Next Generation Sequencing Market for Consumables, Historical Trends (Since 2020) and Forecasted Estimates (Till 2035) (USD Billion)
- Figure 18.3 Next Generation Sequencing Market for Services, Historical Trends (Since 2020) and Forecasted Estimates (Till 2035) (USD Billion)
- Figure 18.4 Next Generation Sequencing Market for Instruments, Historical Trends (Since 2020) and Forecasted Estimates (Till 2035) (USD Billion)
- Figure 19.1 Next Generation Sequencing Market: Distribution by Type of NGS technique
- Figure 19.2 Next Generation Sequencing Market for Targeted Sequencing, Historical Trends (Since 2020) and Forecasted Estimates (Till 2035) (USD Billion)
- Figure 19.3 Next Generation Sequencing Market for Whole Genome Sequencing / Whole Exome Sequencing, Historical Trends (Since 2020) and Forecasted Estimates (Till 2035) (USD Billion)
- Figure 19.4 Next Generation Sequencing Market for RNA Sequencing, Historical Trends (Since 2020) and Forecasted Estimates (Till 2035) (USD Billion)
- Figure 19.5 Next Generation Sequencing Market for Other Techniques, Historical Trends (Since 2020) and Forecasted Estimates (Till 2035) (USD Billion)
- Figure 20.1 Next Generation Sequencing Market: Distribution by Type of Technology Used
- Figure 20.2 Next Generation Sequencing Market for Sequencing by Synthesis Technology, Historical Trends (Since 2020) and Forecasted Estimates (Till 2035) (USD Billion)
- Figure 20.3 Next Generation Sequencing Market for Ion Semiconductor Technology, Historical Trends (Since 2020) and Forecasted Estimates (Till 2035) (USD Billion)
- Figure 20.4 Next Generation Sequencing Market for Nanopore Sequencing Technology, Historical Trends (Since 2020) and Forecasted Estimates (Till 2035) (USD Billion)
- Figure 20.5 Next Generation Sequencing Market for Other Technologies, Historical Trends (Since 2020) and Forecasted Estimates (Till 2035) (USD Billion)
- Figure 21.1 Next Generation Sequencing Market: Distribution by Application Area
- Figure 21.2 Next Generation Sequencing Market for Clinical Applications, Historical Trends (Since 2020) and Forecasted Estimates (Till 2035) (USD Billion)
- Figure 21.3 Next Generation Sequencing Market for Research and Applied Applications, Historical Trends (Since 2020) and Forecasted Estimates (Till 2035) (USD Billion)
- Figure 22.1 Next Generation Sequencing Market: Distribution by Target Therapeutic Area
- Figure 22.2 Next Generation Sequencing Market for Oncological Disorders, Historical Trends (Since 2020) and Forecasted Estimates (Till 2035) (USD Billion)
- Figure 22.3 Next Generation Sequencing Market for Genetic Disorders, Historical Trends (Since 2020) and Forecasted Estimates (Till 2035) (USD Billion)
- Figure 22.4 Next Generation Sequencing Market for Reproductive Disorders, Historical Trends (Since 2020) and Forecasted Estimates (Till 2035) (USD Billion)
- Figure 22.5 Next Generation Sequencing Market for Other Therapeutic Areas, Historical Trends (Since 2020) and Forecasted Estimates (Till 2035) (USD Billion)
- Figure 23.1 Next Generation Sequencing Market: Distribution by Purpose
- Figure 23.2 Next Generation Sequencing Market for Diagnosis, Historical Trends (Since 2020) and Forecasted Estimates (Till 2035) (USD Billion)
- Figure 23.3 Next Generation Sequencing Market for Risk Assessment, Historical Trends (Since 2020) and Forecasted Estimates (Till 2035) (USD Billion)
- Figure 23.4 Next Generation Sequencing Market for Presymptomatic Assessment, Historical Trends (Since 2020) and Forecasted Estimates (Till 2035) (USD Billion)
- Figure 23.5 Next Generation Sequencing Market for Screening, Historical Trends (Since 2020) and Forecasted Estimates (Till 2035) (USD Billion)
- Figure 23.6 Next Generation Sequencing Market for Other Purposes, Historical Trends (Since 2020) and Forecasted Estimates (Till 2035) (USD Billion)
- Figure 24.1 Next Generation Sequencing Market: Distribution by End users
- Figure 24.2 Next Generation Sequencing Market for Academic and Research Institutes, Historical Trends (Since 2020) and Forecasted Estimates (Till 2035) (USD Billion)
- Figure 24.3 Next Generation Sequencing Market for Hospitals and Clinics, Historical Trends (Since 2020) and Forecasted Estimates (Till 2035) (USD Billion)
- Figure 24.4 Next Generation Sequencing Market for Pharmaceutical and Biotechnology Companies, Historical Trends (Since 2020) and Forecasted Estimates (Till 2035) (USD Billion)
- Figure 24.5 Next Generation Sequencing Market for Other End Users, Historical Trends (Since 2020) and Forecasted Estimates (Till 2035) (USD Billion)
- Figure 25.1 Next Generation Sequencing Market: Distribution by Geographical Regions
- Figure 25.2 Next Generation Sequencing Market in North America, Historical Trends (Since 2020) and Forecasted Estimates (Till 2035) (USD Billion)
- Figure 25.3 Next Generation Sequencing Market in the US, Historical Trends (Since 2020) and Forecasted Estimates (Till 2035) (USD Billion)
- Figure 25.4 Next Generation Sequencing Market in Canada, Historical Trends (Since 2020) and Forecasted Estimates (Till 2035) (USD Billion)
- Figure 25.5 Next Generation Sequencing Market in Europe, Historical Trends (Since 2020) and Forecasted Estimates (Till 2035) (USD Billion)
- Figure 25.6 Next Generation Sequencing Market in Germany, Historical Trends (Since 2020) and Forecasted Estimates (Till 2035) (USD Billion)
- Figure 25.7 Next Generation Sequencing Market in France, Historical Trends (Since 2020) and Forecasted Estimates (Till 2035) (USD Billion)
- Figure 25.8 Next Generation Sequencing Market in Italy, Historical Trends (Since 2020) and Forecasted Estimates (Till 2035) (USD Billion)
- Figure 25.9 Next Generation Sequencing Market in Spain, Historical Trends (Since 2020) and Forecasted Estimates (Till 2035) (USD Billion)
- Figure 25.10 Next Generation Sequencing Market in the UK, Historical Trends (Since 2020) and Forecasted Estimates (Till 2035) (USD Billion)
- Figure 25.11 Next Generation Sequencing Market in Rest of Europe, Historical Trends (Since 2020) and Forecasted Estimates (Till 2035) (USD Billion)
- Figure 25.12 Next Generation Sequencing Market in Asia-Pacific, Historical Trends (Since 2020) and Forecasted Estimates (Till 2035) (USD Billion)
- Figure 25.13 Next Generation Sequencing Market in China, Historical Trends (Since 2020) and Forecasted Estimates (Till 2035) (USD Billion)
- Figure 25.14 Next Generation Sequencing Market in India, Historical Trends (Since 2020) and Forecasted Estimates (Till 2035) (USD Billion)
- Figure 25.15 Next Generation Sequencing Market in Japan, Historical Trends (Since 2020) and Forecasted Estimates (Till 2035) (USD Billion)
- Figure 25.16 Next Generation Sequencing Market in South Korea, Historical Trends (Since 2020) and Forecasted Estimates (Till 2035) (USD Billion)
- Figure 25.17 Next Generation Sequencing Market in Singapore, Historical Trends (Since 2020) and Forecasted Estimates (Till 2035) (USD Billion)
- Figure 25.18 Next Generation Sequencing Market in Rest of Asia-Pacific, Historical Trends (Since 2020) and Forecasted Estimates (Till 2035) (USD Billion)
- Figure 25.19 Next Generation Sequencing Market in Middle East and North Africa, Historical Trends (Since 2020) and Forecasted Estimates (Till 2035) (USD Billion)
- Figure 25.20 Next Generation Sequencing Market in Egypt, Historical Trends (Since 2020) and Forecasted Estimates (Till 2035) (USD Billion)
- Figure 25.21 Next Generation Sequencing Market in Israel, Historical Trends (Since 2020) and Forecasted Estimates (Till 2035) (USD Billion)
- Figure 25.22 Next Generation Sequencing Market in Saudi Arabia, Historical Trends (Since 2020) and Forecasted Estimates (Till 2035) (USD Billion)
- Figure 25.23 Next Generation Sequencing Market in Rest of Middle East and North Africa, Historical Trends (Since 2020) and Forecasted Estimates (Till 2035) (USD Billion)
- Figure 25.24 Next Generation Sequencing Market in Latin America, Historical Trends (Since 2020) and Forecasted Estimates (Till 2035) (USD Billion)
- Figure 25.25 Next Generation Sequencing Market in Brazil, Historical Trends (Since 2020) and Forecasted Estimates (Till 2035) (USD Billion)
- Figure 25.26 Next Generation Sequencing Market in Argentina, Historical Trends (Since 2020) and Forecasted Estimates (Till 2035) (USD Billion)
- Figure 25.27 Next Generation Sequencing Market in Rest of Latin America, Historical Trends (Since 2020) and Forecasted Estimates (Till 2035) (USD Billion)
- Figure 25.28 Penetration Growth (P-G) Matrix: Geographical Regions
- Figure 25.29 Market Movement Analysis: Geographical Regions
- Figure 26.1 Concluding Remarks: Market Landscape
- Figure 26.2 Concluding Remarks: Recent Developments
- Figure 26.3 Concluding Remarks: Market Forecast and Opportunity Analysis

