
PUBLISHER: Roots Analysis | PRODUCT CODE: 1856064

PUBLISHER: Roots Analysis | PRODUCT CODE: 1856064
Flexible OLED Market, Till 2035: Distribution by Type of Flexibility, Type of Technology, Type of Material, Type of Panel Size, Type of Application, Type of End User, and Geographical Regions: Industry Trends and Global Forecasts
Flexible OLED Market Overview
As per Roots Analysis, the global flexible OLED market size is estimated to grow from USD 11.57 billion in the current year USD 466.1 billion by 2035, at a CAGR of 39.9% during the forecast period, till 2035.
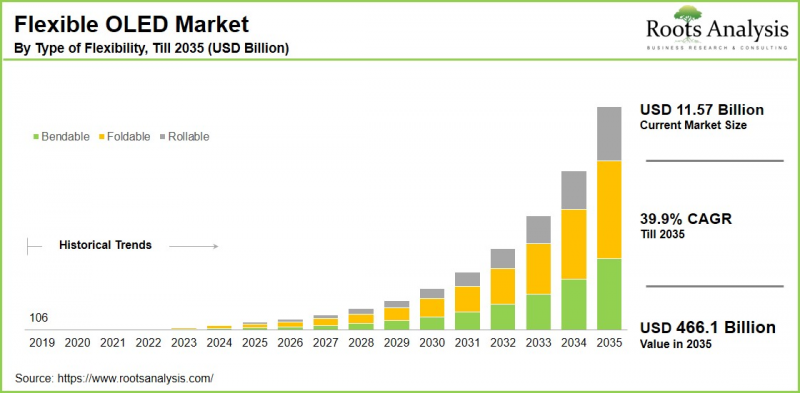
The opportunity for flexible OLED market has been distributed across the following segments:
Type of Flexibility
- Bendable
- Foldable
- Rollable
Type of Technology
- AMOLED (Active-Matrix OLED)
- PMOLED (Passive-Matrix OLED)
Type of Material
- Glass-based
- Metal-based
- Plastic-based
Type of Panel Size
- Large (Above 20 Inches)
- Medium (6.20 Inches)
- Small (Below 6 inches)
Type of Application
- Automotive Displays
- Lighting
- Signage and Advertising Display
- Smartphones and Tablets
- Television & Monitors
- Wearable Devices
Type of End User
- Aerospace and Defense
- Automotive
- Consumer Electronics
- Healthcare
- Retail and Marketing
- Sports and Fashion
Geographical Regions
- North America
- US
- Canada
- Mexico
- Other North American countries
- Europe
- Austria
- Belgium
- Denmark
- France
- Germany
- Ireland
- Italy
- Netherlands
- Norway
- Russia
- Spain
- Sweden
- Switzerland
- UK
- Other European countries
- Asia
- China
- India
- Japan
- Singapore
- South Korea
- Other Asian countries
- Latin America
- Brazil
- Chile
- Colombia
- Venezuela
- Other Latin American countries
- Middle East and North Africa
- Egypt
- Iran
- Iraq
- Israel
- Kuwait
- Saudi Arabia
- UAE
- Other MENA countries
- Rest of the World
- Australia
- New Zealand
- Other countries
Flexible OLED Market: Growth and Trends
After the revolution brought by LED display technology, OLED has emerged as one of the most promising innovations in the flexible display market. Flexible OLEDs, or organic light emitting diodes, combine cutting-edge display technology with the ability to bend or roll screens without breaking. Along with this flexibility, features such as self-emissive technology, lightweight design, durability, and superior display quality make them highly attractive for applications ranging from smartphones to rollable TVs and curved monitors.
Owing to these advantages, the flexible OLED market is expected to witness strong growth, fueled by the increasing popularity of foldable devices and rising demand for lightweight, versatile display solutions in consumer electronics, automotive, and other sectors. Leading technology players are rapidly introducing innovative products with bendable displays to meet consumer demand for both functional and aesthetically appealing devices. This shift not only highlights the immense potential of flexible OLEDs but also reflects the intensifying competition among companies striving to strengthen their market share.
To stay ahead, key players are investing in advanced manufacturing processes and the development of new materials to push the boundaries of performance and design. As a result, the flexible OLED market is on the verge of significant transformation, driven by technological breakthroughs and heightened R&D efforts that are reshaping the industry landscape and unlocking new opportunities for stakeholders.
Flexible OLED Market: Key Segments
Market Share by Type of Flexibility
Based on type of flexibility, the global flexible OLED market is segmented into bendable, foldable, and rollable. According to our estimates, currently, the foldable segment captures the majority of the market share. This can be attributed to the increasing demand from consumer electronics such as smartphones, laptops, and tablets, which benefit from large displays that remain highly portable
Conversely, the bendable segment is expected to grow at a higher CAGR during the forecast period, primarily due to strong demand in wristwatches and other wearable technology applications.
Market Share by Type of Technology
Based on type of technology, the global flexible OLED market is segmented into AMOLED, (active-matrix OLED) and PMOLED (passive-matrix OLED). According to our estimates, currently, the AMOLED segment captures the majority of the market share. Furthermore, this segment is anticipated to experience a higher growth rate during the forecast period.
This trend can be attributed to its superior image quality, high contrast ratio, and energy efficiency. The active-matrix design enables individual control of each pixel, resulting in high-performance flexible displays that are increasingly used in consumer electronics and other advanced applications.
Market Share by Type of Material
Based on type of material, the global flexible OLED market is segmented into glass-based, metal-based, and plastic-based. According to our estimates, currently, the plastic-based material segment captures the majority of the market share. This is due to its lightweight nature, flexibility, and durability, which enable it to endure bending and folding without damage.
However, the glass-based segment is expected to grow at a higher CAGR during the forecast period, primarily due to its use in rigid or semi-flexible OLED displays.
Market Share by Type of Panel Size
Based on type of panel size, the global flexible OLED market is segmented into large (above 20 inches), medium (6.20 inches), and small (below 6 inches). According to our estimates, currently, the panel size between 6 to 8 inches captures the majority of the market share. This growth is largely due to its extensive use in smartphones and other portable devices that typically fall within this display size range. Conversely, the large panel segment is projected to experience the fastest CAGR during the forecast period.
Market Share by Type of Application
Based on type of application, the global flexible OLED market is segmented into automotive displays, lighting, signage and advertising displays, smartphones and tablets, television & monitors, and wearable devices. According to our estimates, currently, the smartphone and tablet segment captures the majority of the market share, primarily due to the widespread adoption of flexible OLED technology in foldable and curved displays.
Conversely, the wearable devices segment is projected to experience the fastest CAGR during the forecast period, fueled by increasing consumer interest in flexible display technologies for enhanced comfort and functionality.
Market Share by Type of End User
Based on type of end user, the global flexible OLED market is segmented into aerospace and defense, automotive, consumer electronics, healthcare, retail and marketing, and sports and fashion. According to our estimates, currently, the consumer electronics segment captures the majority of the market share. Conversely, automotive and healthcare segment is projected to experience the fastest CAGR during the forecast period, as they increasingly adopt flexible displays for dashboards, monitors, and other critical applications.
Market Share by Geographical Regions
Based on geographical regions, the flexible OLED market is segmented into North America, Europe, Asia, Latin America, Middle East and North Africa, and the rest of the world. According to our estimates, currently, Asia captures the majority share of the market.
Furthermore, the market in North America and Europe is projected to experience a faster compound annual growth rate (CAGR) during the forecast period, supported by strong automotive industries, the presence of key market players, and robust demand for consumer electronics.
Example Players in Flexible OLED Market
- Applied Material
- AU Optronics
- BOE Technology
- Corning Incorporated
- DuPont
- E Ink Holding
- Flex Ltd
- InnoLux
- Japan Display
- Kateeva
- Konica Minolta
- LG
- Royole
- Samsung
- Sharp
- Sony
- TCL Technology
- Tianma Microelectronics
- Universal Display
- Visionox
Flexible OLED Market: Research Coverage
The report on the flexible OLED market features insights on various sections, including:
- Market Sizing and Opportunity Analysis: An in-depth analysis of the flexible OLED market, focusing on key market segments, including [A] type of flexibility, [B] type of technology, [C] type of material, [D] type of panel size, [E] type of application, [F] type of end user, and [G] geographical regions.
- Competitive Landscape: A comprehensive analysis of the companies engaged in the flexible OLED market, based on several relevant parameters, such as [A] year of establishment, [B] company size, [C] location of headquarters and [D] ownership structure.
- Company Profiles: Elaborate profiles of prominent players engaged in the flexible OLED market, providing details on [A] location of headquarters, [B] company size, [C] company mission, [D] company footprint, [E] management team, [F] contact details, [G] financial information, [H] operating business segments, [I] flexible OLED portfolio, [J] moat analysis, [K] recent developments, and an informed future outlook.
- Megatrends: An evaluation of ongoing megatrends in the flexible OLED industry.
- Patent Analysis: An insightful analysis of patents filed / granted in the flexible OLED domain, based on relevant parameters, including [A] type of patent, [B] patent publication year, [C] patent age and [D] leading players.
- Recent Developments: An overview of the recent developments made in the flexible OLED market, along with analysis based on relevant parameters, including [A] year of initiative, [B] type of initiative, [C] geographical distribution and [D] most active players.
- Porter's Five Forces Analysis: An analysis of five competitive forces prevailing in the flexible OLED market, including threats of new entrants, bargaining power of buyers, bargaining power of suppliers, threats of substitute products and rivalry among existing competitors.
- SWOT Analysis: An insightful SWOT framework, highlighting the strengths, weaknesses, opportunities and threats in the domain. Additionally, it provides Harvey ball analysis, highlighting the relative impact of each SWOT parameter.
- Value Chain Analysis: A comprehensive analysis of the value chain, providing information on the different phases and stakeholders involved in the flexible OLED market.
Key Questions Answered in this Report
- How many companies are currently engaged in flexible OLED market?
- Which are the leading companies in this market?
- What factors are likely to influence the evolution of this market?
- What is the current and future market size?
- What is the CAGR of this market?
- How is the current and future market opportunity likely to be distributed across key market segments?
Reasons to Buy this Report
- The report provides a comprehensive market analysis, offering detailed revenue projections of the overall market and its specific sub-segments. This information is valuable to both established market leaders and emerging entrants.
- Stakeholders can leverage the report to gain a deeper understanding of the competitive dynamics within the market. By analyzing the competitive landscape, businesses can make informed decisions to optimize their market positioning and develop effective go-to-market strategies.
- The report offers stakeholders a comprehensive overview of the market, including key drivers, barriers, opportunities, and challenges. This information empowers stakeholders to stay abreast of market trends and make data-driven decisions to capitalize on growth prospects.
Additional Benefits
- Complimentary Excel Data Packs for all Analytical Modules in the Report
- 15% Free Content Customization
- Detailed Report Walkthrough Session with Research Team
- Free Updated report if the report is 6-12 months old or older
TABLE OF CONTENTS
SECTION I: REPORT OVERVIEW
1. PREFACE
- 1.1. Introduction
- 1.2. Market Share Insights
- 1.3. Key Market Insights
- 1.4. Report Coverage
- 1.5. Key Questions Answered
- 1.6. Chapter Outlines
2. RESEARCH METHODOLOGY
- 2.1. Chapter Overview
- 2.2. Research Assumptions
- 2.3. Database Building
- 2.3.1. Data Collection
- 2.3.2. Data Validation
- 2.3.3. Data Analysis
- 2.4. Project Methodology
- 2.4.1. Secondary Research
- 2.4.1.1. Annual Reports
- 2.4.1.2. Academic Research Papers
- 2.4.1.3. Company Websites
- 2.4.1.4. Investor Presentations
- 2.4.1.5. Regulatory Filings
- 2.4.1.6. White Papers
- 2.4.1.7. Industry Publications
- 2.4.1.8. Conferences and Seminars
- 2.4.1.9. Government Portals
- 2.4.1.10. Media and Press Releases
- 2.4.1.11. Newsletters
- 2.4.1.12. Industry Databases
- 2.4.1.13. Roots Proprietary Databases
- 2.4.1.14. Paid Databases and Sources
- 2.4.1.15. Social Media Portals
- 2.4.1.16. Other Secondary Sources
- 2.4.2. Primary Research
- 2.4.2.1. Introduction
- 2.4.2.2. Types
- 2.4.2.2.1. Qualitative
- 2.4.2.2.2. Quantitative
- 2.4.2.3. Advantages
- 2.4.2.4. Techniques
- 2.4.2.4.1. Interviews
- 2.4.2.4.2. Surveys
- 2.4.2.4.3. Focus Groups
- 2.4.2.4.4. Observational Research
- 2.4.2.4.5. Social Media Interactions
- 2.4.2.5. Stakeholders
- 2.4.2.5.1. Company Executives (CXOs)
- 2.4.2.5.2. Board of Directors
- 2.4.2.5.3. Company Presidents and Vice Presidents
- 2.4.2.5.4. Key Opinion Leaders
- 2.4.2.5.5. Research and Development Heads
- 2.4.2.5.6. Technical Experts
- 2.4.2.5.7. Subject Matter Experts
- 2.4.2.5.8. Scientists
- 2.4.2.5.9. Doctors and Other Healthcare Providers
- 2.4.2.6. Ethics and Integrity
- 2.4.2.6.1. Research Ethics
- 2.4.2.6.2. Data Integrity
- 2.4.3. Analytical Tools and Databases
- 2.4.1. Secondary Research
3. MARKET DYNAMICS
- 3.1. Forecast Methodology
- 3.1.1. Top-Down Approach
- 3.1.2. Bottom-Up Approach
- 3.1.3. Hybrid Approach
- 3.2. Market Assessment Framework
- 3.2.1. Total Addressable Market (TAM)
- 3.2.2. Serviceable Addressable Market (SAM)
- 3.2.3. Serviceable Obtainable Market (SOM)
- 3.2.4. Currently Acquired Market (CAM)
- 3.3. Forecasting Tools and Techniques
- 3.3.1. Qualitative Forecasting
- 3.3.2. Correlation
- 3.3.3. Regression
- 3.3.4. Time Series Analysis
- 3.3.5. Extrapolation
- 3.3.6. Convergence
- 3.3.7. Forecast Error Analysis
- 3.3.8. Data Visualization
- 3.3.9. Scenario Planning
- 3.3.10. Sensitivity Analysis
- 3.4. Key Considerations
- 3.4.1. Demographics
- 3.4.2. Market Access
- 3.4.3. Reimbursement Scenarios
- 3.4.4. Industry Consolidation
- 3.5. Robust Quality Control
- 3.6. Key Market Segmentations
- 3.7. Limitations
4. MACRO-ECONOMIC INDICATORS
- 4.1. Chapter Overview
- 4.2. Market Dynamics
- 4.2.1. Time Period
- 4.2.1.1. Historical Trends
- 4.2.1.2. Current and Forecasted Estimates
- 4.2.2. Currency Coverage
- 4.2.2.1. Overview of Major Currencies Affecting the Market
- 4.2.2.2. Impact of Currency Fluctuations on the Industry
- 4.2.3. Foreign Exchange Impact
- 4.2.3.1. Evaluation of Foreign Exchange Rates and Their Impact on Market
- 4.2.3.2. Strategies for Mitigating Foreign Exchange Risk
- 4.2.4. Recession
- 4.2.4.1. Historical Analysis of Past Recessions and Lessons Learnt
- 4.2.4.2. Assessment of Current Economic Conditions and Potential Impact on the Market
- 4.2.5. Inflation
- 4.2.5.1. Measurement and Analysis of Inflationary Pressures in the Economy
- 4.2.5.2. Potential Impact of Inflation on the Market Evolution
- 4.2.6. Interest Rates
- 4.2.6.1. Overview of Interest Rates and Their Impact on the Market
- 4.2.6.2. Strategies for Managing Interest Rate Risk
- 4.2.7. Commodity Flow Analysis
- 4.2.7.1. Type of Commodity
- 4.2.7.2. Origins and Destinations
- 4.2.7.3. Values and Weights
- 4.2.7.4. Modes of Transportation
- 4.2.8. Global Trade Dynamics
- 4.2.8.1. Import Scenario
- 4.2.8.2. Export Scenario
- 4.2.9. War Impact Analysis
- 4.2.9.1. Russian-Ukraine War
- 4.2.9.2. Israel-Hamas War
- 4.2.10. COVID Impact / Related Factors
- 4.2.10.1. Global Economic Impact
- 4.2.10.2. Industry-specific Impact
- 4.2.10.3. Government Response and Stimulus Measures
- 4.2.10.4. Future Outlook and Adaptation Strategies
- 4.2.11. Other Indicators
- 4.2.11.1. Fiscal Policy
- 4.2.11.2. Consumer Spending
- 4.2.11.3. Gross Domestic Product (GDP)
- 4.2.11.4. Employment
- 4.2.11.5. Taxes
- 4.2.11.6. R&D Innovation
- 4.2.11.7. Stock Market Performance
- 4.2.11.8. Supply Chain
- 4.2.11.9. Cross-Border Dynamics
- 4.2.1. Time Period
SECTION II: QUALITATIVE INSIGHTS
5. EXECUTIVE SUMMARY
6. INTRODUCTION
- 6.1. Chapter Overview
- 6.2. Overview of Flexible OLED Market
- 6.2.1. Type of Flexibility
- 6.2.2. Type of Technology
- 6.2.3. Type of Material
- 6.2.4. Type of Panel Size
- 6.2.5. Type of Application
- 6.2.6. Type of End User
- 6.3. Future Perspective
7. REGULATORY SCENARIO
SECTION III: MARKET OVERVIEW
8. COMPREHENSIVE DATABASE OF LEADING PLAYERS
9. COMPETITIVE LANDSCAPE
- 9.1. Chapter Overview
- 9.2. Flexible OLED: Overall Market Landscape
- 9.2.1. Analysis by Year of Establishment
- 9.2.2. Analysis by Company Size
- 9.2.3. Analysis by Location of Headquarters
- 9.2.4. Analysis by Ownership Structure
10. WHITE SPACE ANALYSIS
11. COMPANY COMPETITIVENESS ANALYSIS
12. STARTUP ECOSYSTEM IN THE FLEXIBLE OLED MARKET
- 12.1. Flexible OLED: Market Landscape of Startups
- 12.1.1. Analysis by Year of Establishment
- 12.1.2. Analysis by Company Size
- 12.1.3. Analysis by Company Size and Year of Establishment
- 12.1.4. Analysis by Location of Headquarters
- 12.1.5. Analysis by Company Size and Location of Headquarters
- 12.1.6. Analysis by Ownership Structure
- 12.2. Key Findings
SECTION IV: COMPANY PROFILES
13. COMPANY PROFILES
- 13.1. Chapter Overview
- 13.2. Applied Material*
- 13.2.1. Company Overview
- 13.2.2. Company Mission
- 13.2.3. Company Footprint
- 13.2.4. Management Team
- 13.2.5. Contact Details
- 13.2.6. Financial Performance
- 13.2.7. Operating Business Segments
- 13.2.8. Service / Product Portfolio (project specific)
- 13.2.9. MOAT Analysis
- 13.2.10. Recent Developments and Future Outlook
- 13.3. AU Optronics
- 13.4. BOE Technology
- 13.5. Corning Incorporated
- 13.6. DuPont
- 13.7. E Ink Holding
- 13.8. Flex Ltd
- 13.9. InnoLux
- 13.10. Japan Display
- 13.11. Kateeva
- 13.12. Konica Minolta
- 13.13. LG
- 13.14. Royole
- 13.15. Samsung
- 13.16. Sharp
- 13.17. Sony
- 13.18. TCL Technology
- 13.19. Tianma Microelectronics
- 13.20. Universal Display
- 13.21. Visionox
SECTION V: MARKET TRENDS
14. MEGA TRENDS ANALYSIS
15. UNMEET NEED ANALYSIS
16. PATENT ANALYSIS
17. RECENT DEVELOPMENTS
- 17.1. Chapter Overview
- 17.2. Recent Funding
- 17.3. Recent Partnerships
- 17.4. Other Recent Initiatives
SECTION VI: MARKET OPPORTUNITY ANALYSIS
18. GLOBAL FLEXIBLE OLED MARKET
- 18.1. Chapter Overview
- 18.2. Key Assumptions and Methodology
- 18.3. Trends Disruption Impacting Market
- 18.4. Demand Side Trends
- 18.5. Supply Side Trends
- 18.6. Global Flexible OLED Market, Historical Trends (Since 2019) and Forecasted Estimates (Till 2035)
- 18.7. Multivariate Scenario Analysis
- 18.7.1. Conservative Scenario
- 18.7.2. Optimistic Scenario
- 18.8. Investment Feasibility Index
- 18.9. Key Market Segmentations
19. MARKET OPPORTUNITIES BASED ON TYPE OF FLEXIBILITY
- 19.1. Chapter Overview
- 19.2. Key Assumptions and Methodology
- 19.3. Revenue Shift Analysis
- 19.4. Market Movement Analysis
- 19.5. Penetration-Growth (P-G) Matrix
- 19.6. Flexible OLED Market for Bendable: Historical Trends (Since 2019) and Forecasted Estimates (Till 2035)
- 19.7. Flexible OLED Market for Foldable: Historical Trends (Since 2019) and Forecasted Estimates (Till 2035)
- 19.8. Flexible OLED Market for Rollable: Historical Trends (Since 2019) and Forecasted Estimates (Till 2035)
- 19.9. Data Triangulation and Validation
- 19.9.1. Secondary Sources
- 19.9.2. Primary Sources
- 19.9.3. Statistical Modeling
20. MARKET OPPORTUNITIES BASED ON TYPE OF TECHNOLOGY
- 20.1. Chapter Overview
- 20.2. Key Assumptions and Methodology
- 20.3. Revenue Shift Analysis
- 20.4. Market Movement Analysis
- 20.5. Penetration-Growth (P-G) Matrix
- 20.6. Flexible OLED Market for AMOLED: Historical Trends (Since 2019) and Forecasted Estimates (Till 2035)
- 20.7. Flexible OLED Market for PMOLED: Historical Trends (Since 2019) and Forecasted Estimates (Till 2035)
- 20.8. Data Triangulation and Validation
- 20.8.1. Secondary Sources
- 20.8.2. Primary Sources
- 20.8.3. Statistical Modeling
21. MARKET OPPORTUNITIES BASED ON TYPE OF MATERIAL
- 21.1. Chapter Overview
- 21.2. Key Assumptions and Methodology
- 21.3. Revenue Shift Analysis
- 21.4. Market Movement Analysis
- 21.5. Penetration-Growth (P-G) Matrix
- 21.6. Flexible OLED Market for Glass-based: Historical Trends (Since 2019) and Forecasted Estimates (Till 2035)
- 21.7. Flexible OLED Market for Metal-based: Historical Trends (Since 2019) and Forecasted Estimates (Till 2035)
- 21.8. Flexible OLED Market for Plastic-based: Historical Trends (Since 2019) and Forecasted Estimates (Till 2035)
- 21.9. Data Triangulation and Validation
- 21.9.1. Secondary Sources
- 21.9.2. Primary Sources
- 21.9.3. Statistical Modeling
22. MARKET OPPORTUNITIES BASED ON TYPE OF PANEL SIZE
- 22.1. Chapter Overview
- 22.2. Key Assumptions and Methodology
- 22.3. Revenue Shift Analysis
- 22.4. Market Movement Analysis
- 22.5. Penetration-Growth (P-G) Matrix
- 22.6. Flexible OLED Market for Small: Historical Trends (Since 2019) and Forecasted Estimates (Till 2035)
- 22.7. Flexible OLED Market for Medium: Historical Trends (Since 2019) and Forecasted Estimates (Till 2035)
- 22.8. Flexible OLED Market for Large: Historical Trends (Since 2019) and Forecasted Estimates (Till 2035)
- 22.9. Data Triangulation and Validation
- 22.9.1. Secondary Sources
- 22.9.2. Primary Sources
- 22.9.3. Statistical Modeling
23. MARKET OPPORTUNITIES BASED ON TYPE OF APPLICATION
- 23.1. Chapter Overview
- 23.2. Key Assumptions and Methodology
- 23.3. Revenue Shift Analysis
- 23.4. Market Movement Analysis
- 23.5. Penetration-Growth (P-G) Matrix
- 23.6. Flexible OLED Market for Automotive Displays: Historical Trends (Since 2019) and Forecasted Estimates (Till 2035)
- 23.7. Flexible OLED Market for Lighting: Historical Trends (Since 2019) and Forecasted Estimates (Till 2035)
- 23.8. Flexible OLED Market for Smartphones and Tablets: Historical Trends (Since 2019) and Forecasted Estimates (Till 2035)
- 23.9. Flexible OLED Market for Signage and Advertising Displays: Historical Trends (Since 2019) and Forecasted Estimates (Till 2035)
- 23.10. Flexible OLED Market for Televisions and Monitors: Historical Trends (Since 2019) and Forecasted Estimates (Till 2035)
- 23.11. Flexible OLED Market for Wearable Devices: Historical Trends (Since 2019) and Forecasted Estimates (Till 2035)
- 23.12. Data Triangulation and Validation
- 23.12.1. Secondary Sources
- 23.12.2. Primary Sources
- 23.12.3. Statistical Modeling
24. MARKET OPPORTUNITIES BASED ON TYPE OF END USER
- 24.1. Chapter Overview
- 24.2. Key Assumptions and Methodology
- 24.3. Revenue Shift Analysis
- 24.4. Market Movement Analysis
- 24.5. Penetration-Growth (P-G) Matrix
- 24.6. Flexible OLED Market for Aerospace and Defence: Historical Trends (Since 2019) and Forecasted Estimates (Till 2035)
- 24.7. Flexible OLED Market for Automotive: Historical Trends (Since 2019) and Forecasted Estimates (Till 2035)
- 24.8. Flexible OLED Market for Consumer Electronics: Historical Trends (Since 2019) and Forecasted Estimates (Till 2035)
- 24.9. Flexible OLED Market for Healthcare: Historical Trends (Since 2019) and Forecasted Estimates (Till 2035)
- 24.10. Flexible OLED Market for Retail and Marketing: Historical Trends (Since 2019) and Forecasted Estimates (Till 2035)
- 24.11. Flexible OLED Market for Sports and Fashion tail and Marketing: Historical Trends (Since 2019) and Forecasted Estimates (Till 2035)
- 24.12. Data Triangulation and Validation
- 24.12.1. Secondary Sources
- 24.12.2. Primary Sources
- 24.12.3. Statistical Modeling
25. MARKET OPPORTUNITIES FOR FLEXIBLE OLED IN NORTH AMERICA
- 25.1. Chapter Overview
- 25.2. Key Assumptions and Methodology
- 25.3. Revenue Shift Analysis
- 25.4. Market Movement Analysis
- 25.5. Penetration-Growth (P-G) Matrix
- 25.6. Flexible OLED Market in North America: Historical Trends (Since 2019) and Forecasted Estimates (Till 2035)
- 25.6.1. Flexible OLED Market in the US: Historical Trends (Since 2019) and Forecasted Estimates (Till 2035)
- 25.6.2. Flexible OLED Market in Canada: Historical Trends (Since 2019) and Forecasted Estimates (Till 2035)
- 25.6.3. Flexible OLED Market in Mexico: Historical Trends (Since 2019) and Forecasted Estimates (Till 2035)
- 25.6.4. Flexible OLED Market in Other North American Countries: Historical Trends (Since 2019) and Forecasted Estimates (Till 2035)
- 25.7. Data Triangulation and Validation
26. MARKET OPPORTUNITIES FOR FLEXIBLE OLED IN EUROPE
- 26.1. Chapter Overview
- 26.2. Key Assumptions and Methodology
- 26.3. Revenue Shift Analysis
- 26.4. Market Movement Analysis
- 26.5. Penetration-Growth (P-G) Matrix
- 26.6. Flexible OLED Market in Europe: Historical Trends (Since 2019) and Forecasted Estimates (Till 2035)
- 26.6.1. Flexible OLED Market in Austria: Historical Trends (Since 2019) and Forecasted Estimates (Till 2035)
- 26.6.2. Flexible OLED Market in Belgium: Historical Trends (Since 2019) and Forecasted Estimates (Till 2035)
- 26.6.3. Flexible OLED Market in Denmark: Historical Trends (Since 2019) and Forecasted Estimates (Till 2035)
- 26.6.4. Flexible OLED Market in France: Historical Trends (Since 2019) and Forecasted Estimates (Till 2035)
- 26.6.5. Flexible OLED Market in Germany: Historical Trends (Since 2019) and Forecasted Estimates (Till 2035)
- 26.6.6. Flexible OLED Market in Ireland: Historical Trends (Since 2019) and Forecasted Estimates (Till 2035)
- 26.6.7. Flexible OLED Market in Italy: Historical Trends (Since 2019) and Forecasted Estimates (Till 2035)
- 26.6.8. Flexible OLED Market in Netherlands: Historical Trends (Since 2019) and Forecasted Estimates (Till 2035)
- 26.6.9. Flexible OLED Market in Norway: Historical Trends (Since 2019) and Forecasted Estimates (Till 2035)
- 26.6.10. Flexible OLED Market in Russia: Historical Trends (Since 2019) and Forecasted Estimates (Till 2035)
- 26.6.11. Flexible OLED Market in Spain: Historical Trends (Since 2019) and Forecasted Estimates (Till 2035)
- 26.6.12. Flexible OLED Market in Sweden: Historical Trends (Since 2019) and Forecasted Estimates (Till 2035)
- 26.6.13. Flexible OLED Market in Switzerland: Historical Trends (Since 2019) and Forecasted Estimates (Till 2035)
- 26.6.14. Flexible OLED Market in the UK: Historical Trends (Since 2019) and Forecasted Estimates (Till 2035)
- 26.6.15. Flexible OLED Market in Other European Countries: Historical Trends (Since 2019) and Forecasted Estimates (Till 2035)
- 26.7. Data Triangulation and Validation
27. MARKET OPPORTUNITIES FOR FLEXIBLE OLED IN ASIA
- 27.1. Chapter Overview
- 27.2. Key Assumptions and Methodology
- 27.3. Revenue Shift Analysis
- 27.4. Market Movement Analysis
- 27.5. Penetration-Growth (P-G) Matrix
- 27.6. Flexible OLED Market in Asia: Historical Trends (Since 2019) and Forecasted Estimates (Till 2035)
- 27.6.1. Flexible OLED Market in China: Historical Trends (Since 2019) and Forecasted Estimates (Till 2035)
- 27.6.2. Flexible OLED Market in India: Historical Trends (Since 2019) and Forecasted Estimates (Till 2035)
- 27.6.3. Flexible OLED Market in Japan: Historical Trends (Since 2019) and Forecasted Estimates (Till 2035)
- 27.6.4. Flexible OLED Market in Singapore: Historical Trends (Since 2019) and Forecasted Estimates (Till 2035)
- 27.6.5. Flexible OLED Market in South Korea: Historical Trends (Since 2019) and Forecasted Estimates (Till 2035)
- 27.6.6. Flexible OLED Market in Other Asian Countries: Historical Trends (Since 2019) and Forecasted Estimates (Till 2035)
- 27.7. Data Triangulation and Validation
28. MARKET OPPORTUNITIES FOR FLEXIBLE OLED IN MIDDLE EAST AND NORTH AFRICA (MENA)
- 28.1. Chapter Overview
- 28.2. Key Assumptions and Methodology
- 28.3. Revenue Shift Analysis
- 28.4. Market Movement Analysis
- 28.5. Penetration-Growth (P-G) Matrix
- 28.6. Flexible OLED Market in Middle East and North Africa (MENA): Historical Trends (Since 2019) and Forecasted Estimates (Till 2035)
- 28.6.1. Flexible OLED Market in Egypt: Historical Trends (Since 2019) and Forecasted Estimates (Till 205)
- 28.6.2. Flexible OLED Market in Iran: Historical Trends (Since 2019) and Forecasted Estimates (Till 2035)
- 28.6.3. Flexible OLED Market in Iraq: Historical Trends (Since 2019) and Forecasted Estimates (Till 2035)
- 28.6.4. Flexible OLED Market in Israel: Historical Trends (Since 2019) and Forecasted Estimates (Till 2035)
- 28.6.5. Flexible OLED Market in Kuwait: Historical Trends (Since 2019) and Forecasted Estimates (Till 2035)
- 28.6.6. Flexible OLED Market in Saudi Arabia: Historical Trends (Since 2019) and Forecasted Estimates (Till 2035)
- 28.6.7. Flexible OLED Market in United Arab Emirates (UAE): Historical Trends (Since 2019) and Forecasted Estimates (Till 2035)
- 28.6.8. Flexible OLED Market in Other MENA Countries: Historical Trends (Since 2019) and Forecasted Estimates (Till 2035)
- 28.7. Data Triangulation and Validation
29. MARKET OPPORTUNITIES FOR FLEXIBLE OLED IN LATIN AMERICA
- 29.1. Chapter Overview
- 29.2. Key Assumptions and Methodology
- 29.3. Revenue Shift Analysis
- 29.4. Market Movement Analysis
- 29.5. Penetration-Growth (P-G) Matrix
- 29.6. Flexible OLED Market in Latin America: Historical Trends (Since 2019) and Forecasted Estimates (Till 2035)
- 29.6.1. Flexible OLED Market in Argentina: Historical Trends (Since 2019) and Forecasted Estimates (Till 2035)
- 29.6.2. Flexible OLED Market in Brazil: Historical Trends (Since 2019) and Forecasted Estimates (Till 2035)
- 29.6.3. Flexible OLED Market in Chile: Historical Trends (Since 2019) and Forecasted Estimates (Till 2035)
- 29.6.4. Flexible OLED Market in Colombia Historical Trends (Since 2019) and Forecasted Estimates (Till 2035)
- 29.6.5. Flexible OLED Market in Venezuela: Historical Trends (Since 2019) and Forecasted Estimates (Till 2035)
- 29.6.6. Flexible OLED Market in Other Latin American Countries: Historical Trends (Since 2019) and Forecasted Estimates (Till 2035)
- 29.7. Data Triangulation and Validation
30 MARKET OPPORTUNITIES FOR FLEXIBLE OLED IN REST OF THE WORLD
- 30.1. Chapter Overview
- 30.2. Key Assumptions and Methodology
- 30.3. Revenue Shift Analysis
- 30.4. Market Movement Analysis
- 30.5. Penetration-Growth (P-G) Matrix
- 30.6. Flexible OLED Market in Rest of the World: Historical Trends (Since 2019) and Forecasted Estimates (Till 2035)
- 30.6.1. Flexible OLED Market in Australia: Historical Trends (Since 2019) and Forecasted Estimates (Till 2035)
- 30.6.2. Flexible OLED Market in New Zealand: Historical Trends (Since 2019) and Forecasted Estimates (Till 2035)
- 30.6.3. Flexible OLED Market in Other Countries
- 30.7. Data Triangulation and Validation
31. MARKET CONCENTRATION ANALYSIS: DISTRIBUTION BY LEADING PLAYERS
- 31.1. Leading Player 1
- 31.2. Leading Player 2
- 31.3. Leading Player 3
- 31.4. Leading Player 4
- 31.5. Leading Player 5
- 31.6. Leading Player 6
- 31.7. Leading Player 7
- 31.8. Leading Player 8
32. ADJACENT MARKET ANALYSIS
SECTION VII: STRATEGIC TOOLS
33. KEY WINNING STRATEGIES
34. PORTER'S FIVE FORCES ANALYSIS
35. SWOT ANALYSIS
36. VALUE CHAIN ANALYSIS
37. ROOTS STRATEGIC RECOMMENDATIONS
- 37.1. Chapter Overview
- 37.2. Key Business-related Strategies
- 37.2.1. Research & Development
- 37.2.2. Product Manufacturing
- 37.2.3. Commercialization / Go-to-Market
- 37.2.4. Sales and Marketing
- 37.3. Key Operations-related Strategies
- 37.3.1. Risk Management
- 37.3.2. Workforce
- 37.3.3. Finance
- 37.3.4. Others
SECTION VIII: OTHER EXCLUSIVE INSIGHTS
38. INSIGHTS FROM PRIMARY RESEARCH
39. REPORT CONCLUSION
SECTION IX: APPENDIX
40. TABULATED DATA
41. LIST OF COMPANIES AND ORGANIZATIONS
42. CUSTOMIZATION OPPORTUNITIES
43. ROOTS SUBSCRIPTION SERVICES
44. AUTHOR DETAILS

