
PUBLISHER: Roots Analysis | PRODUCT CODE: 1857188

PUBLISHER: Roots Analysis | PRODUCT CODE: 1857188
Graphene Market, Till 2035: Distribution by Type of Product, Type of Production Method, Type of Form, Type of Quality, Type of Application, Type of Distribution Channel, Type of End-User and Geographical Regions: Industry Trends and Global Forecasts
Graphene Market Overview
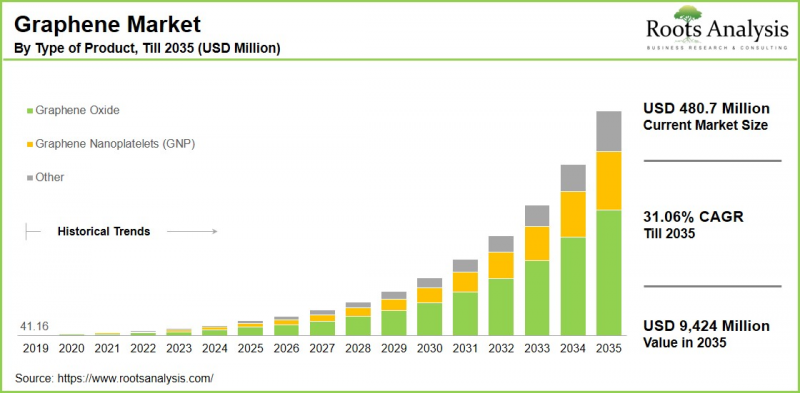
As per Roots Analysis, the global graphene market size is estimated to grow from USD 480.7 million in the current year to USD 9,424 million by 2035, at a CAGR of 31.06% during the forecast period, till 2035.
The opportunity for graphene market has been distributed across the following segments:
Type of Product
- Graphene Oxide
- Graphene Nanoplatelets (GNP)
- Others
Type of Production Method
- Chemical Vapor Deposition
- Exfoliation
- Reduction of Graphene Oxide
- Others
Type of Form
- Dispersion
- Film
- Powder
- Others
Type of Quality
- Industrial Grade
- Research Grade
- Others
Type of Application
- Catalyst
- Composites
- Electronic Component
- Energy Storage
- Paint & Coating
- Tires
Type of Distribution Channel
- Direct Sales
- Distributors
- Online Retailers
- Others
Type of End-User
- Aerospace & Defense
- Automotive
- Electronics
- Energy
- Others
Geographical Regions
- North America
- US
- Canada
- Mexico
- Other North American countries
- Europe
- Austria
- Belgium
- Denmark
- France
- Germany
- Ireland
- Italy
- Netherlands
- Norway
- Russia
- Spain
- Sweden
- Switzerland
- UK
- Other European countries
- Asia
- China
- India
- Japan
- Singapore
- South Korea
- Other Asian countries
- Latin America
- Brazil
- Chile
- Colombia
- Venezuela
- Other Latin American countries
- Middle East and North Africa
- Egypt
- Iran
- Iraq
- Israel
- Kuwait
- Saudi Arabia
- UAE
- Other MENA countries
- Rest of the World
- Australia
- New Zealand
- Other countries
Graphene Market: Growth and Trends
Graphene plays a pivotal role in advancing technology across multiple industries, including the development of integrated circuits, where its lightweight structure and high efficiency offer significant benefits. Its unique properties, such as exceptional electrical conductivity, transparency, flexibility, lightness, and outstanding resistance, make it a highly versatile material. Derived from graphite, graphene is composed of a single layer of carbon atoms, making it the thinnest known material at just one atom thick. These characteristics enable its wide application in fields ranging from biological engineering and healthcare to construction and graphene-based electronics.
Remarkably, graphene is about 200 times stronger than steel and conducts electricity and heat more effectively than copper. Different forms of graphene, including monolayer sheets, bilayer graphene, and turbostratic graphene, are valued for their distinct properties and specialized applications.
The graphene market is evolving rapidly, fueled by ongoing innovation and technological breakthroughs. Additionally, advancements in areas such as hydrogen storage and the development of graphene-based temperature sensors is contributing to the its growth. As a result, owing to the above mentioned factors, the graphene market is expected to grow significantly during the forecast period.
Graphene Market: Key Segments
Market Share by Type of Product
Based on type of product, the global graphene market is segmented into graphene oxide, graphene nanoplatelets (GNP) and others. According to our estimates, currently, the graphene oxide segment captures the majority of the market share. This can be attributed to significant demand from various sectors, such as the graphene electronics market and the automotive industry. Additionally, the potential for large-scale production is expected to further advance the graphene oxide market.
Market Share by Type of Production Method
Based on type of production method, the global graphene market is segmented into chemical vapor deposition, exfoliation, reduction of graphene oxide and others. According to our estimates, currently, the chemical vapor deposition segment captures the majority of the market share, due to its capability to manufacture large-area, high-quality graphene. Additionally, increasing applications across various industries, particularly in electronics, are anticipated to propel its long-term growth.
Market Share by Type of Form
Based on type of form, the global graphene market is segmented into dispersion, film, powder and others. According to our estimates, currently, the powder segment captures the majority of the market share. This is primarily due to its distinctive characteristics, superior performance, and compatibility with various industries such as healthcare and automotive.
Market Share by Type of Quality
Based on type of quality, the global graphene market is segmented into industrial grade, research grade and others. According to our estimates, currently, the industrial grade segment captures the majority of the market share. This is due to the widespread use of graphene across multiple industries and applications. Meanwhile, the research grade segment is expected to experience a higher compound annual growth rate (CAGR) during this forecast period.
Market Share by Type of Application
Based on type of application, the global graphene market is segmented into catalyst, composites, electronic component, energy storage, paint & coating and tires. According to our estimates, currently, the electronic component captures the majority of the market share, owing to the growing demand for electronic solutions. Meanwhile, the energy storage segment is expected to experience a higher compound annual growth rate (CAGR) during this forecast period, due to the rising market for graphene batteries.
Market Share by Type of Distribution Channel
Based on type of distribution channel, the global graphene market is segmented into direct sales, distributors, online retailers and others. According to our estimates, currently, the direct sales segment captures the majority of the market share. This growth can be linked to factors such as cost efficiency, direct engagement with customers, and the rise of e-commerce.
Market Share by Type of End-User
Based on type of end-user, the global graphene market is segmented into aerospace & defense, automotive, electronics, energy and others. According to our estimates, currently, the automotive segment captures the majority of the market share. This is primarily due to the growing use of graphene in automotive applications such as structural components, graphene batteries, and tires.
On the other hand, the electronics sector is anticipated to experience a relatively higher CAGR during the forecast period, owing to its outstanding conductivity, heightened consumer awareness, and an increase in research and development funding.
Market Share by Geographical Regions
Based on geographical regions, the graphene market is segmented into North America, Europe, Asia, Latin America, Middle East and North Africa, and the rest of the world. According to our estimates, currently, Asia captures the majority share of the market, driven by increasing industrialization, robust automotive demand in countries like China and India, and rapid economic growth boosting the region's market.
Example Players in Graphene Market
- ACS Material
- Applied Graphene Materials
- BGT Materials
- CVD Equipment
- Directa Plus
- G6 Materials
- Grafoid
- Graphene NanoChem
- Graphenea
- Haydale Graphene Industries
- JCNANO Tech
- Morsh
- NanoXplore
- NeoGraf
- Ningbo Morsh Technology
- Talga
- Thomas Swan
- Vorbeck Materials
- XG Sciences
- Xiamen Knano Graphene Technology
Graphene Market: Research Coverage
The report on the graphene market features insights on various sections, including:
- Market Sizing and Opportunity Analysis: An in-depth analysis of the graphene market, focusing on key market segments, including [A] type of product, [B] type of production method, [C] type of form, [D] type of quality, [E] type of application, [F] type of distribution channel, [G] type of end-user and [H] geographical regions.
- Competitive Landscape: A comprehensive analysis of the companies engaged in the graphene market, based on several relevant parameters, such as [A] year of establishment, [B] company size, [C] location of headquarters and [D] ownership structure.
- Company Profiles: Elaborate profiles of prominent players engaged in the graphene market, providing details on [A] location of headquarters, [B] company size, [C] company mission, [D] company footprint, [E] management team, [F] contact details, [G] financial information, [H] operating business segments, [I] graphene portfolio, [J] moat analysis, [K] recent developments, and an informed future outlook.
- SWOT Analysis: An insightful SWOT framework, highlighting the strengths, weaknesses, opportunities and threats in the domain. Additionally, it provides Harvey ball analysis, highlighting the relative impact of each SWOT parameter.
- Value Chain Analysis: A comprehensive analysis of the value chain, providing information on the different phases and stakeholders involved in the graphene market.
Key Questions Answered in this Report
- How many companies are currently engaged in graphene market?
- Which are the leading companies in this market?
- What factors are likely to influence the evolution of this market?
- What is the current and future market size?
- What is the CAGR of this market?
- How is the current and future market opportunity likely to be distributed across key market segments?
Reasons to Buy this Report
- The report provides a comprehensive market analysis, offering detailed revenue projections of the overall market and its specific sub-segments. This information is valuable to both established market leaders and emerging entrants.
- Stakeholders can leverage the report to gain a deeper understanding of the competitive dynamics within the market. By analyzing the competitive landscape, businesses can make informed decisions to optimize their market positioning and develop effective go-to-market strategies.
- The report offers stakeholders a comprehensive overview of the market, including key drivers, barriers, opportunities, and challenges. This information empowers stakeholders to stay abreast of market trends and make data-driven decisions to capitalize on growth prospects.
Additional Benefits
- Complimentary Excel Data Packs for all Analytical Modules in the Report
- 15% Free Content Customization
- Detailed Report Walkthrough Session with Research Team
- Free Updated report if the report is 6-12 months old or older
TABLE OF CONTENTS
1. PREFACE
- 1.1. Introduction
- 1.2. Market Share Insights
- 1.3. Key Market Insights
- 1.4. Report Coverage
- 1.5. Key Questions Answered
- 1.6. Chapter Outlines
2. RESEARCH METHODOLOGY
- 2.1. Chapter Overview
- 2.2. Research Assumptions
- 2.3. Database Building
- 2.3.1. Data Collection
- 2.3.2. Data Validation
- 2.3.3. Data Analysis
- 2.4. Project Methodology
- 2.4.1. Secondary Research
- 2.4.1.1. Annual Reports
- 2.4.1.2. Academic Research Papers
- 2.4.1.3. Company Websites
- 2.4.1.4. Investor Presentations
- 2.4.1.5. Regulatory Filings
- 2.4.1.6. White Papers
- 2.4.1.7. Industry Publications
- 2.4.1.8. Conferences and Seminars
- 2.4.1.9. Government Portals
- 2.4.1.10. Media and Press Releases
- 2.4.1.11. Newsletters
- 2.4.1.12. Industry Databases
- 2.4.1.13. Roots Proprietary Databases
- 2.4.1.14. Paid Databases and Sources
- 2.4.1.15. Social Media Portals
- 2.4.1.16. Other Secondary Sources
- 2.4.2. Primary Research
- 2.4.2.1. Introduction
- 2.4.2.2. Types
- 2.4.2.2.1. Qualitative
- 2.4.2.2.2. Quantitative
- 2.4.2.3. Advantages
- 2.4.2.4. Techniques
- 2.4.2.4.1. Interviews
- 2.4.2.4.2. Surveys
- 2.4.2.4.3. Focus Groups
- 2.4.2.4.4. Observational Research
- 2.4.2.4.5. Social Media Interactions
- 2.4.2.5. Stakeholders
- 2.4.2.5.1. Company Executives (CXOs)
- 2.4.2.5.2. Board of Directors
- 2.4.2.5.3. Company Presidents and Vice Presidents
- 2.4.2.5.4. Key Opinion Leaders
- 2.4.2.5.5. Research and Development Heads
- 2.4.2.5.6. Technical Experts
- 2.4.2.5.7. Subject Matter Experts
- 2.4.2.5.8. Scientists
- 2.4.2.5.9. Doctors and Other Healthcare Providers
- 2.4.2.6. Ethics and Integrity
- 2.4.2.6.1. Research Ethics
- 2.4.2.6.2. Data Integrity
- 2.4.3. Analytical Tools and Databases
- 2.4.1. Secondary Research
3. ECONOMIC AND OTHER PROJECT SPECIFIC CONSIDERATIONS
- 3.1. Forecast Methodology
- 3.1.1. Top-Down Approach
- 3.1.2. Bottom-Up Approach
- 3.1.3. Hybrid Approach
- 3.2. Market Assessment Framework
- 3.2.1. Total Addressable Market (TAM)
- 3.2.2. Serviceable Addressable Market (SAM)
- 3.2.3. Serviceable Obtainable Market (SOM)
- 3.2.4. Currently Acquired Market (CAM)
- 3.3. Forecasting Tools and Techniques
- 3.3.1. Qualitative Forecasting
- 3.3.2. Correlation
- 3.3.3. Regression
- 3.3.4. Time Series Analysis
- 3.3.5. Extrapolation
- 3.3.6. Convergence
- 3.3.7. Forecast Error Analysis
- 3.3.8. Data Visualization
- 3.3.9. Scenario Planning
- 3.3.10. Sensitivity Analysis
- 3.4. Key Considerations
- 3.4.1. Demographics
- 3.4.2. Market Access
- 3.4.3. Reimbursement Scenarios
- 3.4.4. Industry Consolidation
- 3.5. Robust Quality Control
- 3.6. Key Market Segmentations
- 3.7. Limitations
4. MACRO-ECONOMIC INDICATORS
- 4.1. Chapter Overview
- 4.2. Market Dynamics
- 4.2.1. Time Period
- 4.2.1.1. Historical Trends
- 4.2.1.2. Current and Forecasted Estimates
- 4.2.2. Currency Coverage
- 4.2.2.1. Overview of Major Currencies Affecting the Market
- 4.2.2.2. Impact of Currency Fluctuations on the Industry
- 4.2.3. Foreign Exchange Impact
- 4.2.3.1. Evaluation of Foreign Exchange Rates and Their Impact on Market
- 4.2.3.2. Strategies for Mitigating Foreign Exchange Risk
- 4.2.4. Recession
- 4.2.4.1. Historical Analysis of Past Recessions and Lessons Learnt
- 4.2.4.2. Assessment of Current Economic Conditions and Potential Impact on the Market
- 4.2.5. Inflation
- 4.2.5.1. Measurement and Analysis of Inflationary Pressures in the Economy
- 4.2.5.2. Potential Impact of Inflation on the Market Evolution
- 4.2.6. Interest Rates
- 4.2.6.1. Overview of Interest Rates and Their Impact on the Market
- 4.2.6.2. Strategies for Managing Interest Rate Risk
- 4.2.7. Commodity Flow Analysis
- 4.2.7.1. Type of Commodity
- 4.2.7.2. Origins and Destinations
- 4.2.7.3. Values and Weights
- 4.2.7.4. Modes of Transportation
- 4.2.8. Global Trade Dynamics
- 4.2.8.1. Import Scenario
- 4.2.8.2. Export Scenario
- 4.2.9. War Impact Analysis
- 4.2.9.1. Russian-Ukraine War
- 4.2.9.2. Israel-Hamas War
- 4.2.10. COVID Impact / Related Factors
- 4.2.10.1. Global Economic Impact
- 4.2.10.2. Industry-specific Impact
- 4.2.10.3. Government Response and Stimulus Measures
- 4.2.10.4. Future Outlook and Adaptation Strategies
- 4.2.11. Other Indicators
- 4.2.11.1. Fiscal Policy
- 4.2.11.2. Consumer Spending
- 4.2.11.3. Gross Domestic Product (GDP)
- 4.2.11.4. Employment
- 4.2.11.5. Taxes
- 4.2.11.6. R&D Innovation
- 4.2.11.7. Stock Market Performance
- 4.2.11.8. Supply Chain
- 4.2.11.9. Cross-Border Dynamics
- 4.2.1. Time Period
5. EXECUTIVE SUMMARY
6. INTRODUCTION
- 6.1. Chapter Overview
- 6.2. Overview of Graphene Market
- 6.2.1. Type of Product
- 6.2.2. Type of Applications
- 6.2.3. Type of End-User
- 6.3. Future Perspective
7. COMPETITIVE LANDSCAPE
- 7.1. Chapter Overview
- 7.2. Graphene: Overall Market Landscape
- 7.2.1. Analysis by Year of Establishment
- 7.2.2. Analysis by Company Size
- 7.2.3. Analysis by Location of Headquarters
- 7.2.4. Analysis by Ownership Structure
8. COMPANY PROFILES
- 8.1. Chapter Overview
- 8.2. ACS Material *
- 8.2.1. Company Overview
- 8.2.2. Company Mission
- 8.2.3. Company Footprint
- 8.2.4. Management Team
- 8.2.5. Contact Details
- 8.2.6. Financial Performance
- 8.2.7. Operating Business Segments
- 8.2.8. Service / Product Portfolio (project specific)
- 8.2.9. MOAT Analysis
- 8.2.10. Recent Developments and Future Outlook
- 8.3. Applied Graphene Materials
- 8.4. BGT Materials
- 8.5. CVD Equipment
- 8.6. Directa Plus
- 8.7. G6 Materials
- 8.8. Grafoid
- 8.9. Graphene NanoChem
- 8.10. Graphenea
- 8.11. Haydale Graphene Industries
- 8.12. JCNANO Tech
- 8.13. Morsh
- 8.14. NanoXplore
- 8.15. NeoGraf
- 8.16. Ningbo Morsh Technology
- 8.17. Talga
- 8.18. Thomas Swan
- 8.19. Vorbeck Materials
- 8.20. XG Sciences
- 8.21. Xiamen Knano Graphene Technology
9. VALUE CHAIN ANALYSIS
10. SWOT ANALYSIS
11. GLOBAL GRAPHENE MARKET
- 11.1. Chapter Overview
- 11.2. Key Assumptions and Methodology
- 11.3. Trends Disruption Impacting Market
- 11.4. Global Graphene Market, Historical Trends (Since 2019) and Forecasted Estimates (Till 2035)
- 11.5. Multivariate Scenario Analysis
- 11.5.1. Conservative Scenario
- 11.5.2. Optimistic Scenario
- 11.6. Key Market Segmentations
12. MARKET OPPORTUNITIES BASED ON TYPE OF PRODUCT
- 12.1. Chapter Overview
- 12.2. Key Assumptions and Methodology
- 12.3. Revenue Shift Analysis
- 12.4. Market Movement Analysis
- 12.5. Penetration-Growth (P-G) Matrix
- 12.6. Graphene Market for Graphene Oxide: Historical Trends (Since 2019) and Forecasted Estimates (Till 2035)
- 12.7. Graphene Market for Graphene Nanoplatelets (GNP): Historical Trends (Since 2019) and Forecasted Estimates (Till 2035)
- 12.8. Graphene Market for Others: Historical Trends (Since 2019) and Forecasted Estimates (Till 2035)
- 12.9. Data Triangulation and Validation
13. MARKET OPPORTUNITIES BASED ON TYPE OF PRODUCTION METHOD
- 13.1. Chapter Overview
- 13.2. Key Assumptions and Methodology
- 13.3. Revenue Shift Analysis
- 13.4. Market Movement Analysis
- 13.5. Penetration-Growth (P-G) Matrix
- 13.6. Graphene Market for Chemical Vapor Deposition: Historical Trends (Since 2019) and Forecasted Estimates (Till 2035)
- 13.7. Graphene Market for Exfoliation: Historical Trends (Since 2019) and Forecasted Estimates (Till 2035)
- 13.8. Graphene Market for Reduction of Graphene Oxide: Historical Trends (Since 2019) and Forecasted Estimates (Till 2035)
- 13.9. Graphene Market for Others: Historical Trends (Since 2019) and Forecasted Estimates (Till 2035)
- 13.10. Data Triangulation and Validation
14. MARKET OPPORTUNITIES BASED ON TYPE OF FORM
- 14.1. Chapter Overview
- 14.2. Key Assumptions and Methodology
- 14.3. Revenue Shift Analysis
- 14.4. Market Movement Analysis
- 14.5. Penetration-Growth (P-G) Matrix
- 14.6. Graphene Market for Dispersion: Historical Trends (Since 2019) and Forecasted Estimates (Till 2035)
- 14.7. Graphene Market for Film: Historical Trends (Since 2019) and Forecasted Estimates (Till 2035)
- 14.8. Graphene Market for Powder: Historical Trends (Since 2019) and Forecasted Estimates (Till 2035)
- 14.9. Graphene Market for Others: Historical Trends (Since 2019) and Forecasted Estimates (Till 2035)
- 14.10. Data Triangulation and Validation
15. MARKET OPPORTUNITIES BASED ON TYPE OF QUALITY
- 15.1. Chapter Overview
- 15.2. Key Assumptions and Methodology
- 15.3. Revenue Shift Analysis
- 15.4. Market Movement Analysis
- 15.5. Penetration-Growth (P-G) Matrix
- 15.6. Graphene Market for Industrial Grade: Historical Trends (Since 2019) and Forecasted Estimates (Till 2035)
- 15.7. Graphene Market for Research Grade: Historical Trends (Since 2019) and Forecasted Estimates (Till 2035)
- 15.8. Graphene Market for Others: Historical Trends (Since 2019) and Forecasted Estimates (Till 2035)
- 15.9. Data Triangulation and Validation
16. MARKET OPPORTUNITIES BASED ON TYPE OF APPLICATION
- 16.1. Chapter Overview
- 16.2. Key Assumptions and Methodology
- 16.3. Revenue Shift Analysis
- 16.4. Market Movement Analysis
- 16.5. Penetration-Growth (P-G) Matrix
- 16.6. Graphene Market for Catalyst: Historical Trends (Since 2019) and Forecasted Estimates (Till 2035)
- 16.7. Graphene Market for Composites: Historical Trends (Since 2019) and Forecasted Estimates (Till 2035)
- 16.8. Graphene Market for Electronic Component: Historical Trends (Since 2019) and Forecasted Estimates (Till 2035)
- 16.9. Graphene Market for Energy Storage: Historical Trends (Since 2019) and Forecasted Estimates (Till 2035)
- 16.10. Graphene Market for Paint & Coating: Historical Trends (Since 2019) and Forecasted Estimates (Till 2035)
- 16.11. Graphene Market for Others: Historical Trends (Since 2019) and Forecasted Estimates (Till 2035)
- 16.12. Data Triangulation and Validation
17. MARKET OPPORTUNITIES BASED ON TYPE OF DISTRIBUTION CHANNEL
- 17.1. Chapter Overview
- 17.2. Key Assumptions and Methodology
- 17.3. Revenue Shift Analysis
- 17.4. Market Movement Analysis
- 17.5. Penetration-Growth (P-G) Matrix
- 17.6. Graphene Market for Direct Sales: Historical Trends (Since 2019) and Forecasted Estimates (Till 2035)
- 17.7. Graphene Market for Distributors: Historical Trends (Since 2019) and Forecasted Estimates (Till 2035)
- 17.8. Graphene Market for Online Retailers: Historical Trends (Since 2019) and Forecasted Estimates (Till 2035)
- 17.9. Graphene Market for Others: Historical Trends (Since 2019) and Forecasted Estimates (Till 2035)
- 17.10. Data Triangulation and Validation
18. MARKET OPPORTUNITIES BASED ON TYPE OF END-USER
- 18.1. Chapter Overview
- 18.2. Key Assumptions and Methodology
- 18.3. Revenue Shift Analysis
- 18.4. Market Movement Analysis
- 18.5. Penetration-Growth (P-G) Matrix
- 18.6. Graphene Market for Aerospace & Defense: Historical Trends (Since 2019) and Forecasted Estimates (Till 2035)
- 18.7. Graphene Market for Automotive: Historical Trends (Since 2019) and Forecasted Estimates (Till 2035)
- 18.8. Graphene Market for Electronics: Historical Trends (Since 2019) and Forecasted Estimates (Till 2035)
- 18.9. Graphene Market for Energy: Historical Trends (Since 2019) and Forecasted Estimates (Till 2035)
- 18.10. Graphene Market for Others: Historical Trends (Since 2019) and Forecasted Estimates (Till 2035)
- 18.11. Data Triangulation and Validation
19. MARKET OPPORTUNITIES FOR GRAPHENE IN NORTH AMERICA
- 19.1. Chapter Overview
- 19.2. Key Assumptions and Methodology
- 19.3. Revenue Shift Analysis
- 19.4. Market Movement Analysis
- 19.5. Penetration-Growth (P-G) Matrix
- 19.6. Graphene Market in North America: Historical Trends (Since 2019) and Forecasted Estimates (Till 2035)
- 19.6.1. Graphene Market in the US: Historical Trends (Since 2019) and Forecasted Estimates (Till 2035)
- 19.6.2. Graphene Market in Canada: Historical Trends (Since 2019) and Forecasted Estimates (Till 2035)
- 19.6.3. Graphene Market in Mexico: Historical Trends (Since 2019) and Forecasted Estimates (Till 2035)
- 19.6.4. Graphene Market in Other North American Countries: Historical Trends (Since 2019) and Forecasted Estimates (Till 2035)
- 19.7. Data Triangulation and Validation
20. MARKET OPPORTUNITIES FOR GRAPHENE IN EUROPE
- 20.1. Chapter Overview
- 20.2. Key Assumptions and Methodology
- 20.3. Revenue Shift Analysis
- 20.4. Market Movement Analysis
- 20.5. Penetration-Growth (P-G) Matrix
- 20.6. Graphene Market in Europe: Historical Trends (Since 2019) and Forecasted Estimates (Till 2035)
- 20.6.1. Graphene Market in Austria: Historical Trends (Since 2019) and Forecasted Estimates (Till 2035)
- 20.6.2. Graphene Market in Belgium: Historical Trends (Since 2019) and Forecasted Estimates (Till 2035)
- 20.6.3. Graphene Market in Denmark: Historical Trends (Since 2019) and Forecasted Estimates (Till 2035)
- 20.6.4. Graphene Market in France: Historical Trends (Since 2019) and Forecasted Estimates (Till 2035)
- 20.6.5. Graphene Market in Germany: Historical Trends (Since 2019) and Forecasted Estimates (Till 2035)
- 20.6.6. Graphene Market in Ireland: Historical Trends (Since 2019) and Forecasted Estimates (Till 2035)
- 20.6.7. Graphene Market in Italy: Historical Trends (Since 2019) and Forecasted Estimates (Till 2035)
- 20.6.8. Graphene Market in Netherlands: Historical Trends (Since 2019) and Forecasted Estimates (Till 2035)
- 20.6.9. Graphene Market in Norway: Historical Trends (Since 2019) and Forecasted Estimates (Till 2035)
- 20.6.10. Graphene Market in Russia: Historical Trends (Since 2019) and Forecasted Estimates (Till 2035)
- 20.6.11. Graphene Market in Spain: Historical Trends (Since 2019) and Forecasted Estimates (Till 2035)
- 20.6.12. Graphene Market in Sweden: Historical Trends (Since 2019) and Forecasted Estimates (Till 2035)
- 20.6.13. Graphene Market in Switzerland: Historical Trends (Since 2019) and Forecasted Estimates (Till 2035)
- 20.6.14. Graphene Market in the UK: Historical Trends (Since 2019) and Forecasted Estimates (Till 2035)
- 20.6.15. Graphene Market in Other European Countries: Historical Trends (Since 2019) and Forecasted Estimates (Till 2035)
- 20.7. Data Triangulation and Validation
21. MARKET OPPORTUNITIES FOR GRAPHENE IN ASIA
- 21.1. Chapter Overview
- 21.2. Key Assumptions and Methodology
- 21.3. Revenue Shift Analysis
- 21.4. Market Movement Analysis
- 21.5. Penetration-Growth (P-G) Matrix
- 21.6. Graphene Market in Asia: Historical Trends (Since 2019) and Forecasted Estimates (Till 2035)
- 21.6.1. Graphene Market in China: Historical Trends (Since 2019) and Forecasted Estimates (Till 2035)
- 21.6.2. Graphene Market in India: Historical Trends (Since 2019) and Forecasted Estimates (Till 2035)
- 21.6.3. Graphene Market in Japan: Historical Trends (Since 2019) and Forecasted Estimates (Till 2035)
- 21.6.4. Graphene Market in Singapore: Historical Trends (Since 2019) and Forecasted Estimates (Till 2035)
- 21.6.5. Graphene Market in South Korea: Historical Trends (Since 2019) and Forecasted Estimates (Till 2035)
- 21.6.6. Graphene Market in Other Asian Countries: Historical Trends (Since 2019) and Forecasted Estimates (Till 2035)
- 21.7. Data Triangulation and Validation
22. MARKET OPPORTUNITIES FOR GRAPHENE IN MIDDLE EAST AND NORTH AFRICA (MENA)
- 22.1. Chapter Overview
- 22.2. Key Assumptions and Methodology
- 22.3. Revenue Shift Analysis
- 22.4. Market Movement Analysis
- 22.5. Penetration-Growth (P-G) Matrix
- 22.6. Graphene Market in Middle East and North Africa (MENA): Historical Trends (Since 2019) and Forecasted Estimates (Till 2035)
- 22.6.1. Graphene Market in Egypt: Historical Trends (Since 2019) and Forecasted Estimates (Till 205)
- 22.6.2. Graphene Market in Iran: Historical Trends (Since 2019) and Forecasted Estimates (Till 2035)
- 22.6.3. Graphene Market in Iraq: Historical Trends (Since 2019) and Forecasted Estimates (Till 2035)
- 22.6.4. Graphene Market in Israel: Historical Trends (Since 2019) and Forecasted Estimates (Till 2035)
- 22.6.5. Graphene Market in Kuwait: Historical Trends (Since 2019) and Forecasted Estimates (Till 2035)
- 22.6.6. Graphene Market in Saudi Arabia: Historical Trends (Since 2019) and Forecasted Estimates (Till 2035)
- 22.6.7. Graphene Market in United Arab Emirates (UAE): Historical Trends (Since 2019) and Forecasted Estimates (Till 2035)
- 22.6.8. Graphene Market in Other MENA Countries: Historical Trends (Since 2019) and Forecasted Estimates (Till 2035)
- 22.7. Data Triangulation and Validation
23. MARKET OPPORTUNITIES FOR GRAPHENE IN LATIN AMERICA
- 23.1. Chapter Overview
- 23.2. Key Assumptions and Methodology
- 23.3. Revenue Shift Analysis
- 23.4. Market Movement Analysis
- 23.5. Penetration-Growth (P-G) Matrix
- 23.6. Graphene Market in Latin America: Historical Trends (Since 2019) and Forecasted Estimates (Till 2035)
- 23.6.1. Graphene Market in Argentina: Historical Trends (Since 2019) and Forecasted Estimates (Till 2035)
- 23.6.2. Graphene Market in Brazil: Historical Trends (Since 2019) and Forecasted Estimates (Till 2035)
- 23.6.3. Graphene Market in Chile: Historical Trends (Since 2019) and Forecasted Estimates (Till 2035)
- 23.6.4. Graphene Market in Colombia Historical Trends (Since 2019) and Forecasted Estimates (Till 2035)
- 23.6.5. Graphene Market in Venezuela: Historical Trends (Since 2019) and Forecasted Estimates (Till 2035)
- 23.6.6. Graphene Market in Other Latin American Countries: Historical Trends (Since 2019) and Forecasted Estimates (Till 2035)
- 23.7. Data Triangulation and Validation
24. MARKET OPPORTUNITIES FOR GRAPHENE IN REST OF THE WORLD
- 24.1. Chapter Overview
- 24.2. Key Assumptions and Methodology
- 24.3. Revenue Shift Analysis
- 24.4. Market Movement Analysis
- 24.5. Penetration-Growth (P-G) Matrix
- 24.6. Graphene Market in Rest of the World: Historical Trends (Since 2019) and Forecasted Estimates (Till 2035)
- 24.6.1. Graphene Market in Australia: Historical Trends (Since 2019) and Forecasted Estimates (Till 2035)
- 24.6.2. Graphene Market in New Zealand: Historical Trends (Since 2019) and Forecasted Estimates (Till 2035)
- 24.6.3. Graphene Market in Other Countries
- 24.7. Data Triangulation and Validation
25. TABULATED DATA
26. LIST OF COMPANIES AND ORGANIZATIONS
27. CUSTOMIZATION OPPORTUNITIES
28. ROOTS SUBSCRIPTION SERVICES
29. AUTHOR DETAIL

