
PUBLISHER: Roots Analysis | PRODUCT CODE: 1869578

PUBLISHER: Roots Analysis | PRODUCT CODE: 1869578
Psychedelic Drugs Market: Industry Trends and Global Forecasts - Distribution by Origin of Substance, Psychedelic Substance, Target Disease Indications, Route of Administration and Key Geographical Regions
Global Psychedelic Drugs Market: Overview
As per Roots Analysis, the global psychedelic drugs market is expected to grow from USD 3.19 billion in the current year to USD 12.89 billion, at a CAGR of 15% during the forecast period.
The market sizing and opportunity analysis has been segmented across the following parameters:
Origin of Substance
- Natural
- Synthetic
Type of Psychedelic Substance
- Gamma-hydroxybutyrate
- Ketamine
- MDMA
- Psilocybin
Target Disease Indications
- Depression and Anxiety Disorders
- Pain Disorders
- Sleep Related Disorders
- Trauma
Route of Administration
- Oral
- Intravenous
- Intranasal
- Sublingual
Key Geographical Regions
- North America
- Europe
- Asia-Pacific
- Rest of the World
Global Psychedelic Drugs Market: Growth and Trends
Psychedelic disorders are mental health issues defined by persistent perceptual disturbances following the use of psychedelic substances, especially hallucinogen persisting perception disorder (HPPD). HPPD involves persistent visual phenomena such as visual snow, trails, and altered motion perception, which are not part of another mental or medical condition and cause significant distress.
Psychedelic disorders, in addition to other mental health issues, are projected to lead to worldwide productivity losses surpassing USD 1 trillion each year. Recent data suggests that the pandemic intensified existing trends, especially among younger women, with rates rising 130% quicker for teenagers and 57% quicker for young adults after the COVID-19 pandemic. As of 2022, antidepressants ranked as the third most prevalent category of prescribed medications. The WHO states that there are numerous obstacles for effectively treating depression and other mental health disorders including insufficient understanding of these conditions, ongoing social stigma, incorrect diagnoses, and limited effective treatments. Due to such difficulties, an increase in clinical research emphasizes the treatment possibilities of psychedelic compounds for mental health issues such as depression. Researchers suggest that when given in suitable doses, psychedelics may assist in alleviating certain severe psychological effects in patients.
Psychedelic compounds have been shown to affect multiple neurotransmitter systems, including those related to serotonin, acetylcholine, norepinephrine, and dopamine. At present, various participants in the pharmaceutical sector are involved in research of both natural and synthetic derivatives of psychedelic compounds. The market for psychedelic drugs is expected to experience significant growth in the next decade.
Global Psychedelic Drugs Market: Key Insights
The report delves into the current state of global psychedelic drugs market and identifies potential growth opportunities within industry. Some key findings from the report include:
- More than 45 players from across the world presently claim to be engaged in the development and evaluation of therapeutic candidates based on a number of psychedelic compounds, such as ketamine and psilocybin.
- The pipeline features product candidates based on a variety of psychedelic drug classes, which are being investigated for a wide range of target disease indications and have different routes of administration.
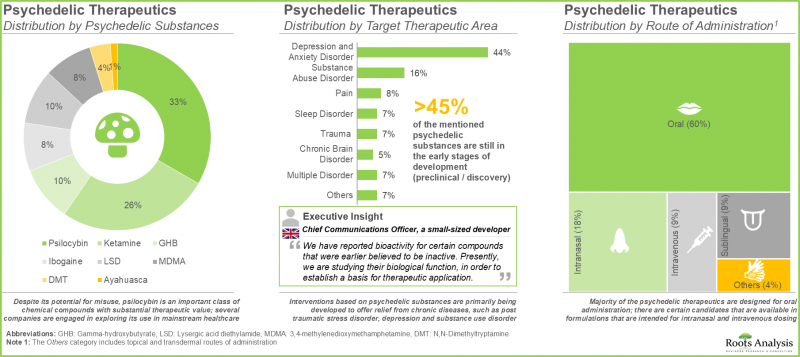
- Despite its potential for misuse, psilocybin (33%) is an important class of chemical compounds with substantial therapeutic value; several companies are engaged in exploring its use in mainstream healthcare.
- Majority (60%) of the psychedelic therapeutics are designed for oral administration; there are certain candidates that are available in formulations that are intended for intranasal and intravenous dosing.
- From a global perspective, this industry is anticipated to evolve significantly over the next few years as federal / regional regulators in different nations are gradually convinced of the clinical significance of this product class.
- Several organizations, having realized the untapped opportunity within this emerging segment of psychedelic therapeutics, have awarded grants of over USD 275 million across 500+ instances.
- The number of grants awarded to stakeholders in this domain (in the US) has increased at a CAGR of 5%; more than 45% of the total amount was awarded under the R01 mechanism.
- The field has witnessed the involvement of various sponsor institutes from within the NIH; of all the involved departments, the participation of the NIMH, NIDA, NIGMS, and NIAAA was observed to be relatively more prominent.
- The word cloud represents the area of interest of research organizations within this emerging domain; indications such as depression and posttraumatic stress disorder have garnered significant attention.
- Several trials evaluating various psychedelic compounds against a wide range of therapeutic indications have been registered in the recent past.
- The growing interest is also reflected in the partnership activity; a number of different types of deals involving various drug classes have been established across multiple geographies.
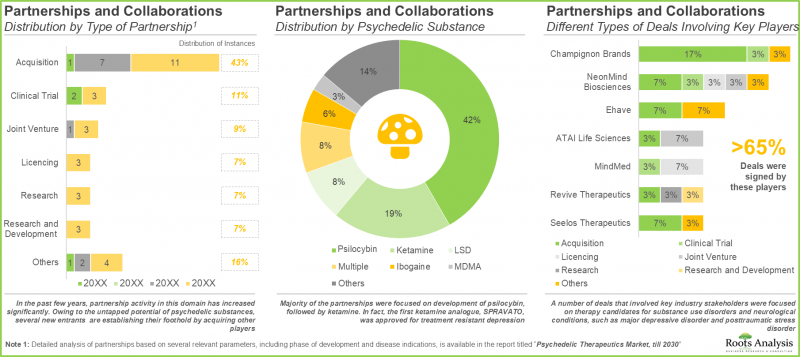
- Majority of the partnerships were focused on development of psilocybin (42%), followed by ketamine (19%). In fact, the first ketamine analogue, SPRAVATO, was approved for treatment of resistant depression.
- A number of deals that involved key industry stakeholders were focused on therapy candidates for substance use disorders and neurological conditions, such as major depressive disorder and posttraumatic stress disorder.
- Presently, North American companies are actively consolidating their indigenous presence through strategic acquisitions; key value drivers behind such deals include both portfolio and geographical expansion.
- A number of eminent scientists from renowned universities have emerged as key opinion leaders in this domain, owing to their active involvement in clinical development efforts related to interventions based on psychedelics.
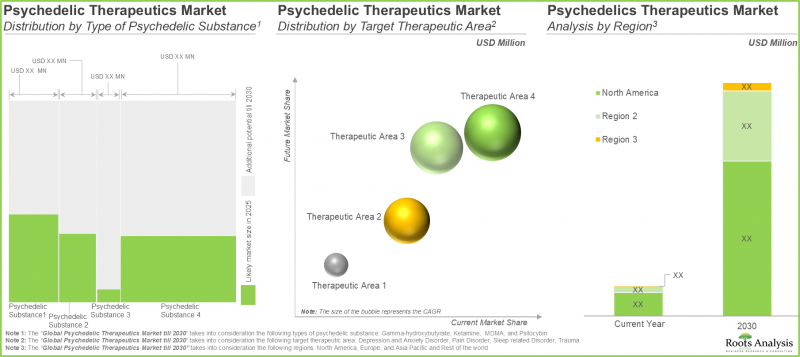
- Future market size, based on revenue reported from the sales of marketed and late-stage psychedelic-based therapies, is anticipated to be distributed across different therapeutic areas and key geographical regions.
- In fact, opinions from industry experts confirm the vast potential of this segment; the overall opportunity is well distributed across the various natural / synthetically derived substances and routes of administration.
Global Psychedelic Drugs Market: Key Segments
Trauma Segment Occupies the Largest Share of the Psychedelic Drugs Market
In terms of target disease indications, the market is segmented into depression and anxiety disorders, pain disorders, sleep related disorders and trauma. Currently, the trauma segment dominates the psychedelic drug market, capturing majority share of the market.
North America Accounts for the Largest Share of the Market
In terms of key geographical regions, the market is segmented into North America, Europe, Asia-Pacific and Rest of the World. Currently, North America dominates the psychedelic drugs market and accounts for the largest revenue share.
Primary Research Overview
Discussions with multiple stakeholders in this domain influenced the opinions and insights presented in this study. The market report includes detailed transcripts of interviews conducted with the following individuals:
- Founder & Chief Executive Officer, Small Company
- Chief Operating Officer and Chief Medical Officer, Mid-sized Company
- Chief Operating Officer, Small Company
- Chief Communications Officer, Mid-sized Company
- Associate Research Scientist, Large Company
Example Players in the Global Psychedelic Drugs Market
- Celon Pharma
- iX Biopharma
- MAPS Public Benefit
- MindMed
- Janssen Pharmaceuticals
- Jazz Pharmaceutical
Global Psychedelic Drugs Market: Research Coverage
- Market Sizing and Opportunity Analysis: The report features an in-depth analysis of the global psychedelic drugs market, focusing on key market segments, including [A] origin of substance, [B] type of psychedelic substance [C] target disease indications, [D] route of administration and [H] key geographical regions.
- Market Landscape: A comprehensive evaluation of marketed / pipeline molecules, considering various parameters, such as [A] phase of development of lead candidates, [B] type of psychedelic substance, [C] origin of psychedelic substance, [D] target therapeutic area (s), [E] route of administration and [F] dosing frequency. Additionally, a comprehensive evaluation of drug developer(s), based on [A] year of their establishment, [B] company size, and [C] location of headquarters.
- Company Profiles: In-depth profiles of companies that are engaged in the development of at least two or more psychedelic-based therapies, focusing on [A] company overview, [B] financial information (if available), [C] product portfolio, and [E] recent developments and an informed future outlook.
- Clinical Trial Analysis: An in-depth analysis of completed, ongoing and planned clinical studies of various psychedelic therapeutics, highlighting prevalent trends across various relevant parameters, such as [A] trial registration year, [B] phase of development, [C] current trial status, [D] enrolled patient population, [E] geographical distribution of trials, [F] study design, [G] leading industry, [H] study focus, [I] target therapeutic area and [J] key geographical regions.
- Clinical Trial Site Analysis: A detailed analysis of clinical trial sites where the studies have been / are being conducted for evaluation of various psychedelic therapeutics, based on relevant parameters, such as [A] type of psychedelic substance, [B] trial phase, [C] target disease indications and [D] location of the trial.
- Grant Analysis: An insightful analysis of nearly 550 grants that were awarded to research institutes engaged in psychedelic therapeutics related projects, based on the parameters, such as the [A] year of grant award, [B] amount awarded, [C] funding institute center, [D] support period, [E] type of grant application, [F] purpose of grant award, [G] activity code, [H] responsible study section, [I] prominent program officers and [J] type of recipient organizations.
- Partnerships and Collaborations: A comprehensive analysis of various collaborations and partnerships that have been inked amongst stakeholders in this domain, based on [A] year of partnership, [B] type of partnership and [C] regional activity.
- Mergers and Acquisitions: A detailed analysis of the various mergers and acquisitions that have taken place in this domain, based on parameters, such as [A] key value drivers, [B] year of acquisition, [C] type of acquisition, [D] geographical location of the acquirer and [E] the acquired company.
Key Questions Answered in this Report
- How many companies are currently engaged in this market?
- Which are the leading companies in this market?
- What factors are likely to influence the evolution of this market?
- What is the current and future market size?
- What is the CAGR of this market?
- How is the current and future market opportunity likely to be distributed across key market segments?
Reasons to Buy this Report
- The report provides a comprehensive market analysis, offering detailed revenue projections of the overall market and its specific sub-segments. This information is valuable to both established market leaders and emerging entrants.
- Stakeholders can leverage the report to gain a deeper understanding of the competitive dynamics within the market. By analyzing the competitive landscape, businesses can make informed decisions to optimize their market positioning and develop effective go-to-market strategies.
- The report offers stakeholders a comprehensive overview of the market, including key drivers, barriers, opportunities, and challenges. This information empowers stakeholders to stay abreast of market trends and make data-driven decisions to capitalize on growth prospects.
Additional Benefits
- Complimentary PPT Insights Packs
- Complimentary Excel Data Packs for all Analytical Modules in the Report
- 15% Free Content Customization
- Detailed Report Walkthrough Session with Research Team
- Free Updated report if the report is 6-12 months old or older
TABLE OF CONTENTS
1. PREFACE
- 1.1. Scope of the Report
- 1.2. Research Methodology
- 1.2.1. Research Assumptions
- 1.2.2. Project Methodology
- 1.2.3. Forecast Methodology
- 1.2.4. Robust Quality Control
- 1.2.5. Key Considerations
- 1.2.5.1. Demographics
- 1.2.5.2. Economic Factors
- 1.2.5.3. Government Regulations
- 1.2.5.4. Supply Chain
- 1.2.5.5. COVID Impact / Related Factors
- 1.2.5.6. Market Access
- 1.2.5.7. Healthcare Policies
- 1.2.5.8. Industry Consolidation
- 1.3 Key Questions Answered
- 1.4. Chapter Outlines
2. EXECUTIVE SUMMARY
3. INTRODUCTION
- 3.1. Chapter Overview
- 3.2. History of Psychedelic Substances
- 3.3. Potential Therapeutic Applications of Psychedelic Substances
- 3.4. Regulation, Toxicity Concerns, Procurement-related Challenges and Perceptions Regarding Medical Use
- 3.5. Future Opportunities
4. MARKET LANDSCAPE: PSYCHEDELIC THERAPEUTICS
- 4.1. Chapter Overview
- 4.2. Psychedelic Therapeutics: Marketed and Development Pipeline
- 4.2.1. Analysis by Phase of Development
- 4.2.2. Analysis by Type of Psychedelic Substance
- 4.2.3. Analysis by Origin of Psychedelic Substance
- 4.2.4. Analysis by Target Therapeutic Area
- 4.2.5. Analysis by Route of Administration
- 4.2.6. Analysis by Dosing Frequency
- 4.3. Psychedelic Therapeutics: List of Developers
- 4.3.1. Analysis by Year of Establishment
- 4.3.2. Analysis by Company Size
4. 3.3. Analysis by Location of Headquarters
- 4.4. Grid Analysis: Distribution by Phase of Development, Origin of Psychedelic Substance and Location of Headquarters
5. COMPANY PROFILES
- 5.1. Chapter Overview
- 5.2. Celon Pharma
- 5.2.1. Company Overview
- 5.2.2. Financial Information
- 5.2.3. Psychedelic Therapeutics Portfolio
- 5.2.3.1. Esketamine DPI
- 5.2.4. Recent Developments and Future Outlook
- 5.3. iX Biopharma
- 5.3.1. Company Overview
- 5.3.2. Financial Information
- 5.3.3. Psychedelic Therapeutics Portfolio
- 5.3.3.1. Wafermine(TM)
- 5.3.3.2. Unnamed (Ketamine)
- 5.3.4. Recent Developments and Future Outlook
- 5.4. MAPS Public Benefit
- 5.4.1. Company Overview
- 5.4.2. Financial Information
- 5.4.3. Psychedelic Therapeutics Portfolio
- 5.4.3.1. Unnamed (MDMA)
- 5.4.3.2. Unnamed (Ibogaine Hydrochloride)
- 5.4.3.3. Unnamed (LSD)
- 5.4.3.4. Unnamed (Ayahuasca)
- 5.4.4. Recent Developments and Future Outlook
- 5.5. MindMed
- 5.5.1. Company Overview
- 5.5.2. Psychedelic Therapeutics Portfolio
- 5.5.2.1. LSD Micro-dosing
- 5.5.2.2. 18-MC
- 5.5.2.3. Unnamed (LSD and MDMA)
- 5.5.3. Recent Developments and Future Outlook
- 5.6. Janssen Pharmaceuticals
- 5.6.1. Company Overview
- 5.6.2. Financial Information
- 5.6.3. Psychedelic Therapeutics Portfolio
- 5.6.3.1. SPRAVATO(R)
- 5.6.4. Recent Developments and Future Outlook
- 5.7. Jazz Pharmaceutical
- 5.7.1. Company Overview
- 5.7.2. Financial Information
- 5.7.3. Psychedelic Therapeutics Portfolio
- 5.7.3.1. XYREM(R)
- 5.7.3.2. JZP-258
- 5.7.3.3. JZP-324
- 5.7.4. Recent Developments and Future Outlook
6. CLINICAL TRIAL ANALYSIS
- 6.1. Chapter Overview
- 6.2. Scope and Methodology
- 6.3. Psychedelic Therapeutics: Clinical Trial Analysis
- 6.3.1. Analysis by Trial Registration Year
- 6.3.2. Analysis by Trial Phase
- 6.3.3. Analysis by Trial Recruitment Status
- 6.3.4. Analysis by Trial Registration Year and Number of Patients Enrolled
- 6.3.5. Analysis by Study Design
- 6.3.6. Leading Trial Sponsors: Analysis by Number of Registered Trials
- 6.3.7. Leading Industry Sponsors: Analysis by Number of Registered Trials
- 6.3.8. Word Cloud: Key Focus Areas
- 6.3.9. Analysis by Target Therapeutic Area
- 6.3.10. Popular Interventions: Analysis by Number of Registered Trials
- 6.3.11. Geographical Analysis by Number of Registered Trials
- 6.3.12. Geographical Analysis by Trial Recruitment Status
- 6.3.13. Geographical Analysis by Number of Patients Enrolled
7. CLINICAL TRIAL SITE ANALYSIS
- 7.1. Chapter Overview
- 7.2. Scope and Methodology
- 7.3. Psychedelic Therapeutics: Clinical Trial Site Analysis
- 7.3.1. Analysis by Type of Psychedelic Substance
- 7.3.2. Analysis by Trial Phase
- 7.3.3. Analysis by Target Therapeutic Area
- 7.3.4. Analysis by Location of Clinical Trial Site
8. KEY OPINION LEADER (KOL) ANALYSIS
- 8.1. Chapter Overview
- 8.2. Assumptions and Methodology
- 8.3. Principal Investigators Involved in Clinical Trials
- 8.3.1. Analysis by Type of Organization (KOL Affiliation)
- 8.3.2. Geographical Distribution of KOLs
- 8.4. Prominent KOLs
- 8.5. KOL Benchmarking: Roots Analysis' Assessment versus Third Party (ResearchGate Score)
- 8.6. Most Active KOLs
- 8.6.1. KOL Profile: A (Emory School of Medicine)
- 8.6.2. KOL Profile: B (Imperial College London)
- 8.6.3. KOL Profile: C (Rigshospitalet)
- 8.6.4. KOL Profile: D (Thriving Mind South Florida)
- 8.6.5. KOL Profile: E (University Health Network)
9. ACADEMIC GRANTS ANALYSIS
- 9.1. Chapter Overview
- 9.2. Scope and Methodology
- 9.3. Psychedelic Therapeutics: Analysis of Academic Grants
- 9.3.1. Analysis by Year of Grant Award
- 9.3.2. Analysis by Amount Awarded
- 9.3.3. Analysis by Funding Institute Center
- 9.3.4. Analysis by Support Period
- 9.3.5. Analysis by Funding Institute Center and Support Period
- 9.3.6. Analysis by Type of Grant Application
- 9.3.7. Analysis by Purpose of Grant Award
- 9.3.8. Analysis by Activity Code
- 9.3.9. Analysis by Study Section Involved
- 9.3.10. Analysis by Recipient Organization
- 9.3.11. Geographical Distribution of Recipient Organizations
- 9.3.12. Word Cloud: Emerging Focus Areas
- 9.3.13. Popular Psychedelic Therapeutics: Analysis by Number of Grants
- 9.3.14. Popular Funding Institute Centers: Analysis by Number of Grants
- 9.3.15. Prominent Program Officers: Analysis by Number of Grants
- 9.3.16. Popular Recipient Organizations: Analysis by Number of Grants
10. PARTNERSHIPS AND COLLABORATIONS
- 10.1. Chapter Overview
- 10.2. Partnership Models
- 10.3. Psychedelic Therapeutics: List of Partnerships and Collaborations
- 10.3.1. Analysis by Year of Partnership
- 10.3.2. Analysis by Type of Partnership
- 10.3.3. Analysis by Type of Partnership and Type of Psychedelic Substance Involved
- 10.3.4. Analysis by Type of Partnership and Phase of Development of Involved Intervention
- 10.3.5. Analysis by Type of Partnership and Target Therapeutic Area Mentioned
- 10.3.6. Analysis by Type of Psychedelic Substance and Target Therapeutic Area
- 10.3.7. Analysis by Type of Partnership and Type of Partner
- 10.3.8. Analysis by Type of Psychedelic Substance Involved and Type of Partner
- 10.3.9. Most Active Players: Analysis by Number of Partnerships
- 10.3.10. Regional Analysis
- 10.3.10.1 Intercontinental and Intracontinental Agreements
11. MERGERS AND ACQUISITIONS
- 11.1. Chapter Overview
- 11.2. Acquisition Models
- 11.3. Psychedelic Therapeutics: Mergers and Acquisitions
- 11.3.1. Cumulative Year-wise Trend of Mergers and Acquisitions
- 11.3.2. Analysis by Type of Acquisition
- 11.3.3. Analysis by Type of Psychedelic Substance Involved
- 11.3.4. Analysis by Year of Acquisition and Type of Psychedelic Substance Involved
- 11.3.5. Most Active Players: Analysis by Number of Acquisitions
- 11.3.6. Regional Analysis
- 11.3.6.1. Continent-Wise Distribution of Acquisitions
- 11.3.6.2. Country-Wise Distribution of Acquisitions
- 11.3.7. Analysis by Key Value Drivers
- 11.3.7.1, Analysis by Year of Acquisition and Key Value Drivers
12. MARKET FORECAST AND OPPORTUNITY ANALYSIS
- 12.1. Chapter Overview
- 12.2. Forecast Methodology and Assumptions
- 12.3. Global Psychedelic Therapeutics Market
- 12.4. Global Psychedelic Therapeutics Market: Individual Product Sales Forecasts
- 12.4.1. COMP360 (COMPASS Pathways)
- 12.4.1.1. Target Patient Population
- 12.4.1.2. Sales Forecast
- 12.4.2. Esketamine DPI (Celon Pharma)
- 12.4.2.1. Target Patient Population
- 12.4.2.2. Sales Forecast
- 12.4.3. FT218 (Avadel Pharmaceuticals)
- 12.4.3.1. Target Patient Population
- 12.4.3.2. Sales Forecast
- 12.4.4. JZP-258 (Jazz Pharmaceuticals)
- 12.4.4.1. Target Patient Population
- 12.4.4.2. Sales Forecast
- 12.4.5. NRX-100 (NeuroRx)
- 12.4.5.1. Target Patient Population
- 12.4.5.2. Sales Forecast
- 12.4.6. R-107 (Doughlas pharmaceuticals)
- 12.4.6.1. Target Patient Population
- 12.4.6.2. Sales Forecast
- 12.4.7. SPRAVATO(R) (Janssen Pharmaceuticals)
- 12.4.7.1. Target Patient Population
- 12.4.7.2. Sales Forecast
- 12.4.8. Unnamed (MDMA) (MAPS Public Benefit)
- 12.4.8.1. Target Patient Population
- 12.4.8.2. Sales Forecast
- 12.4.9. Unnamed (Psilocybin) (The Emmes Company)
- 12.4.9.1. Target Patient Population
- 12.4.9.2. Sales Forecast
- 12.4.10. Wafermine(TM) (iX Biopharma)
- 12.4.10.1. Target Patient Population
- 12.4.10.2. Sales Forecast
- 12.4.11. XYREM(R) (Jazz Pharmaceuticals)
- 12.4.11.1. Target Patient Population
- 12.4.11.2. Sales Forecast
- 12.4.1. COMP360 (COMPASS Pathways)
- 12.5. Global Psychedelic Therapeutics Market: Distribution by Origin of Psychedelic Substance, Till 2035
- 12.5.1. Global Psychedelic Therapeutics Market for Synthetic Substances, Till 2035
- 12.5.2. Global Psychedelic Therapeutics Market for Natural Substances, Till 2035
- 12.6. Global Psychedelic Therapeutics Market: Distribution by Type of Psychedelic Substance, Till 2035
- 12.6.1. Global Psychedelic Therapeutics Market for GHB, Till 2035
- 12.6.2. Global Psychedelic Therapeutics Market for Ketamine, Till 2035
- 12.6.3. Global Psychedelic Therapeutics Market for MDMA, Till 2035
- 12.6.4. Global Psychedelic Therapeutics Market for Psilocybin, Till 2035
- 12.7. Global Psychedelic Therapeutics Market: Distribution by Geography, Till 2035
- 12.7.1. Psychedelic Therapeutics Market in North America, Till 2035
- 12.7.2. Psychedelic Therapeutics Market in Europe, Till 2035
- 12.7.3. Psychedelic Therapeutics Market in Asia-Pacific and Rest of the World, Till 2035
- 12.8. Psychedelic Therapeutics Market: Distribution by Target Therapeutic Area, Till 2035
- 12.8.1. Global Psychedelic Therapeutics Market for Depression and Anxiety Disorders, Till 2035
- 12.8.2. Global Psychedelic Therapeutics Market for Pain Disorders, Till 2035
- 12.8.3. Global Psychedelic Therapeutics Market for Sleep-Related Disorders, Till 2035
- 12.8.4. Global Psychedelic Therapeutics Market for Trauma, Till 2035
- 12.9. Global Psychedelic Therapeutics Market: Distribution by Route of Administration, Till 2035
- 12.9.1. Global Psychedelic Therapeutics Market for Intranasal Therapies, Till 2035
- 12.9.2. Global Psychedelic Therapeutics Market for Intravenous Therapies, Till 2035
- 12.9.3. Global Psychedelic Therapeutics Market for Oral Therapies, Till 2035
- 12.9.4. Global Psychedelic Therapeutics Market for Sublingual Therapies, Till 2035
13. CONCLUDING REMARKS
- 13.1. Chapter Overview
- 13.2. Key Takeaways
14. EXECUTIVE INSIGHTS
- 14.1. Chapter Overview
- 14.2 Company A
- 14.2.1. Company Snapshot
- 14.2.2. Interview Transcript: Founder & Chief Executive Officer
- 14.3. Company B
- 14.3.1. Company Snapshot
- 14.3.2. Interview Transcript: Founder & Chief Executive Officer
- 14.4. Company C
- 14.4.1. Company Snapshot
- 14.4.2. Interview Transcript: Chief Operating Officer and Chief Medical Officer
- 14.5 Company D
- 14.5.1. Company Snapshot
- 14.5.2. Interview Transcript: Chief Operating Officer
- 14.6 Company E
- 14.6.1. Company Snapshot
- 14.6.2. Interview Transcript: Chief Communications Officer
- 14.7 Company F
- 14.7.1. Company Snapshot
- 14.7.2. Interview Transcript: Assistant Professor of Psychiatry
15. APPENDIX 1: TABULATED DATA
16. APPENDIX 2: LIST OF COMPANIES AND ORGANIZATIONS
List of Tables
- Table 4.1. Psychedelic Therapeutics: Marketed and Development Pipeline
- Table 4.2. Psychedelic Therapeutics: List of Developers
- Table 5.1. Psychedelic Therapeutics: List of Companies Profiled
- Table 5.2. Celon Pharma: Company Snapshot
- Table 5.3. Drug Profile: Esketamine DPI
- Table 5.4. Celon Pharma: Recent Developments and Future Outlook
- Table 5.5. iX Biopharma: Company Snapshot
- Table 5.6. Drug Profile: Wafermine(R)
- Table 5.7. Drug Profile: Unnamed (Ketamine)
- Table 5.8. iX Biopharm: Recent Developments and Future Outlook
- Table 5.9. MAPS Public Benefit: Company Snapshot
- Table 5.10. Drug Profile: Unnamed (MDMA)
- Table 5.11. Drug Profile: Unnamed Ibogaine Hydrochloride
- Table 5.12. Drug Profile: Unnamed (LSD)
- Table 5.13. Drug Profile: Unnamed (Ayahuasca)
- Table 5.14. MAPS Public Benefit: Recent Developments and Future Outlook
- Table 5.15. MindMed: Company Snapshot
- Table 5.16. Drug Profile: LSD Micro-Dosing
- Table 5.17. Drug Profile: 18-MC
- Table 5.18. MindMed: Recent Developments and Future Outlook
- Table 5.19. Janssen Pharmaceutical: Company Snapshot
- Table 5.20. Drug Profile: SPRAVATO(R)
- Table 5.21. Janssen Pharmaceutical: Recent Developments and Future Outlook
- Table 5.22. Jazz Pharmaceutical: Company Snapshot
- Table 5.23. Drug Profile: XYREM(R)
- Table 5.24. Drug Profile: JZP-258
- Table 5.25. Drug Profile: JZP-324
- Table 5.26. Jazz pharmaceutical: Recent Developments and Future Outlook
- Table 7.1. Psychedelic Therapeutics: List of Principal Investigators
- Table 7.2. KOLs: Roots Analysis Proprietary Scoring System
- Table 7.3. KOL Profile: A (Emory School of Medicine)
- Table 7.4. KOL Profile: B (Imperial College London)
- Table 7.5. KOL Profile: C (Rigshospitalet)
- Table 7.6. KOL Profile: D (Thriving Mind South Florida)
- Table 7.7. KOL Profile: E (University Health Network)
- Table 10.1. Psychedelic Therapeutics: List of Partnerships and Collaborations
- Table 11.1. Psychedelic Therapeutics: List of Mergers and Acquisition
- Table 11.2. Psychedelic Therapeutics: Key Growth Drivers
- Table.15.1. Psychedelic Therapeutics: Distribution by Phase of Development
- Table.15.2. Psychedelic Therapeutics: Distribution by Type of Psychedelic Substance
- Table.15.3. Psychedelic Therapeutics: Distribution by Origin of Psychedelic Substance
- Table.15.4. Psychedelic Therapeutics: Distribution by Target Therapeutic Area
- Table.15.5. Psychedelic Therapeutics: Distribution by Route of Administration
- Table.15.6. Psychedelic Therapeutics: Distribution by Dosing Frequency
- Table.15.7. Psychedelic Therapeutics Developers: Distribution by Year of Establishment
- Table.15.8. Psychedelic Therapeutics Developers: Distribution by Company Size
- Table.15.9. Celon Pharma: Annual Revenues, Since 2016 (PLN Million)
- Table.15.10. iX Biopharma: Annual Revenues, Since 2015 (USD Million)
- Table.15.11. MAPS Public Benefit: Annual Revenues, Since 2016 (USD Million)
- Table.15.12. Janssen Pharmaceuticals: Annual Revenues, Since 2016 (USD Million)
- Table.15.13. Jazz Pharmaceutical: Annual Revenues, Since 2015 (USD Million)
- Table.15.14. Clinical Trial Analysis: Cumulative Distribution of Trials by Registration Year
- Table.15.15. Clinical Trial Analysis: Distribution by Trial Phase
- Table.15.16. Clinical Trial Analysis: Distribution by Trial Recruitment Status
- Table.15.17. Clinical Trial Analysis: Distribution by Trial Registration Year and Number of Patients Enrolled
- Table.15.18. Clinical Trial Analysis: Distribution by Study Design
- Table.15.19. Leading Trial Sponsors: Distribution by Number of Registered Trials
- Table.15.20. Leading Industry Sponsors: Distribution by Number of Registered Trials
- Table.15.21. Clinical Trial Analysis: Distribution by Target Therapeutic Area
- Table.15.22. Popular Interventions: Distribution by Number of Registered Trials
- Table.15.23. Clinical Trial Analysis: Geographical Distribution by Number of Registered Trials
- Table.15.24. Clinical Trial Analysis: Geographical Distribution by Trial Recruitment Status
- Table.15.25. Clinical Trial Analysis: Geographical Distribution by Number of Patients Enrolled
- Table.15.26. Clinical Trial Site Analysis: Cumulative Distribution of Clinical Trial Centre
- Table.15.27. Clinical Trial Site Analysis: Distribution by Type of Psychedelic Substance
- Table.15.28. Clinical Trial Site Analysis: Distribution by Trial Phase
- Table.15.29. Clinical Trial Site Analysis: Distribution by Target Therapeutic Area
- Table.15.30. Clinical Trial Site Analysis: Distribution by Location of Clinical Trial Center
- Table.15.31. KOL Analysis: Distribution by Type of Organization (KOL Affiliation)
- Table.15.32. KOL Analysis: Distribution by Location of Organization (KOL Affiliation)
- Table.15.33. KOL Analysis: Leading Organizations (KOL Affiliation)
- Table.15.34. KOL Benchmarking: Roots Analysis' Assessment versus Third Party (ResearchGate Score)
- Table.15.35. KOL Analysis: Most Prominent KOLs
- Table.15.36. Grant Analysis: Cumulative Trend by Year of Grant Award, Since 2015
- Table.15.37. Grant Analysis: Cumulative Distribution by Amount Awarded, Since 2015 (USD Million)
- Table.15.38. Grant Analysis: Distribution by Funding Institute Center
- Table.15.39. Grant Analysis: Distribution by Support Period
- Table.15.40. Grant Analysis: Distribution by Funding Institute Center and Support Period
- Table.15.41. Grant Analysis: Distribution by Type of Grant Application
- Table.15.42. Grant Analysis: Distribution by Purpose of Grant Award
- Table.15.43. Grant Analysis: Distribution by Activity Code
- Table.15.44. Grant Analysis: Distribution by Study Section Involved
- Table.15.45. Grant Analysis: Distribution by Recipient Organization
- Table.15.46. Word Cloud Analysis: Emerging Focus Areas
- Table.15.47. Popular Psychedelic Therapeutics: Distribution by Number of Grants
- Table.15.48. Popular Funding Institute Centers: Distribution by Number of Grants
- Table.15.49. Grant Analysis: Prominent Program Officers
- Table.15.50. Popular Recipient Organizations: Distribution by Number of Grants
- Table.15.51. Partnerships and Collaborations: Cumulative Year-wise Trend, Since 2017
- Table.15.52. Partnerships and Collaborations: Distribution by Type of Partnership
- Table.15.53. Partnerships and Collaborations: Distribution by Type of Partnership and Type of Psychedelic Substance Involved
- Table.15.54. Partnerships and Collaborations: Distribution by Type of Partnership and Phase of Development of Involved Intervention
- Table.15.55. Partnerships and Collaborations: Distribution by Type of Psychedelic Substance and Target Therapeutic Area
- Table.15.56. Partnerships and Collaborations: Distribution by Type of Partnership and Type of Partner
- Table.15.57. Partnerships and Collaborations: Distribution by Type of Psychedelic Substance Involved and Type of Partner
- Table.15.58. Most Active Players: Distribution by Number of Partnerships
- Table.15.59. Partnership and Collaborations: Regional Distribution
- Table.15.60. Mergers and Acquisitions: Cumulative Year-wise Trend, Since 2017
- Table.15.61. Mergers and Acquisitions: Distribution by Type of Acquisition
- Table.15.62. Mergers and Acquisitions: Distribution by Type of Psychedelic Substance Involved
- Table.15.63. Mergers and Acquisitions: Distribution by Year of Acquisition and Type of Psychedelic Substance Involved
- Table.15.64. Most Active Players: Distribution by Number of Acquisition
- Table.15.65. Mergers and Acquisitions: Regional Distribution
- Table.15.66. Mergers and Acquisitions: Distribution by Key Value Drivers
- Table.15.67. Mergers and Acquisitions: Distribution by Year of Acquisition and Key Value Drivers
- Table.15.68. Global Psychedelic Therapeutics Market, Till 2035 (USD Million)
- Table.15.69. COMP360 (COMPASS Pathways): Sales Forecast
- Table.15.70. Esketamine DPI (Celon Pharma): Sales Forecast
- Table.15.71. FT218 (Avadel Pharmaceuticals): Sales Forecast
- Table.15.72. JZP-258 (Jazz Pharmaceuticals): Sales Forecast
- Table.15.73. NRX-100 (NeuroRx): Sales Forecast
- Table.15.74. R-107 (Doughlas pharmaceuticals): Sales Forecast
- Table.15.75. SPRAVATO(R) (Janssen Pharmaceuticals): Sales Forecast
- Table.15.76. Unnamed (MDMA) (MAPS Public Benefit): Sales Forecast
- Table.15.77. Unnamed (Psilocybin) (The Emmes Company): Sales Forecast
- Table.15.78. Wafermine(TM) (iX Biopharma): Sales Forecast
- Table.15.79. XYREM(R) (Jazz Pharmaceuticals): Sales Forecast
- Table.15.80. Global Psychedelic Therapeutics Market: Distribution by Origin of Psychedelic Substances, Till 2035 (USD Million)
- Table.15.81. Global Psychedelic Therapeutics Market for Synthetic Substances, Till 2035 (USD Million)
- Table.15.82. Global Psychedelic Therapeutics Market for Natural Substances, Till 2035 (USD Million)
- Table.15.83. Global Psychedelic Therapeutics Market: Distribution by Type of Psychedelic Substance, Till 2035 (USD Million)
- Table.15.84. Global Psychedelic Therapeutics Market for GHB, Till 2035 (USD Million)
- Table.15.85. Global Psychedelic Therapeutics Market for Ketamine, Till 2035 (USD Million)
- Table.15.86. Global Psychedelic Therapeutics Market for MDMA, Till 2035 (USD Million)
- Table.15.87. Global Psychedelic Therapeutics Market for Psilocybin, Till 2035 (USD Million)
- Table.15.88. Global Psychedelic Therapeutics Market: Distribution by Geography, Till 2035 (USD Million)
- Table.15.89. Global Psychedelic Therapeutics Market in North America, Till 2035 (USD Million)
- Table.15.90. Global Psychedelic Therapeutics Market in Europe, Till 2035 (USD Million)
- Table.15.91. Global Psychedelic Therapeutics Market in Asia Pacific and Rest of the World, Till 2035 (USD Million)
- Table.15.92. Psychedelic Therapeutics Market: Distribution by Target Therapeutic Area, Till 2035 (USD Million)
- Table.15.93. Global Psychedelic Therapeutics Market for Depression and Anxiety Disorders, Till 2035 (USD Million)
- Table.15.94. Global Psychedelic Therapeutics Market for Pain Disorders, Till 2035 (USD Million)
- Table.15.95. Global Psychedelic Therapeutics Market for Sleep-Related Disorders, Till 2035 (USD Million)
- Table.15.96. Global Psychedelic Therapeutics Market for Trauma, Till 2035 (USD Million)
- Table.15.97. Global Psychedelic Therapeutics Market: Distribution by Route of Administration, Till 2035 (USD Million)
- Table.15.98. Global Psychedelic Therapeutics Market for Intranasal Therapies, Till 2035 (USD Million)
List of Figures
- Figure 3.1. Historical Evolution of Psychedelics
- Figure 3.2. Psychedelic Substances: Potential Therapeutic Areas
- Figure 3.3. Classification of Psychedelic Substances under the Federal Controlled Substances Act
- Figure 3.4. Psychedelic Therapeutics: Status of Legalization / Decriminalization Across Different Geographies
- Figure 3.5. Psychedelic Therapeutics: Toxicity Comparison of Different Substances
- Figure 4.1. Psychedelic Therapeutics: Distribution by Phase of Development
- Figure 4.2. Psychedelic Therapeutics: Distribution by Type of Psychedelic Substance
- Figure 4.3. Psychedelic Therapeutics: Distribution by Origin of Psychedelic Substance
- Figure 4.4. Psychedelic Therapeutics: Distribution by Target Therapeutic Area
- Figure 4.5. Psychedelic Therapeutics: Distribution by Route of Administration
- Figure 4.6. Psychedelic Therapeutics: Distribution by Dosing Frequency
- Figure 4.7. Psychedelic Therapeutics Developers: Distribution by Year of Establishment
- Figure 4.8. Psychedelic Therapeutics Developers: Distribution by Company Size
- Figure 4.9. Psychedelic Therapeutics Developers: Distribution by Location of Headquarters
- Figure 4.10. Grid Representation: Distribution by Phase of Development, Origin of Psychedelic Substance and Location of Headquarters
- Figure 5.1. Celon Pharma: Annual Revenues, Since 2016 (PLN Million)
- Figure 5.2. iX Biopharma: Annual Revenues, Since 2015 (USD Million)
- Figure 5.3. MAPS Public Benefit: Annual Revenues, Since 2016 (USD Million)
- Figure 5.4. Janssen Pharmaceuticals: Annual Revenues, Since 2016 (USD Million)
- Figure 5.5. Jazz Pharmaceutical: Annual Revenues, Since 2015 (USD Million)
- Figure 6.1. Clinical Trial Analysis: Cumulative Distribution of Trials by Registration Year
- Figure 6.2. Clinical Trial Analysis: Distribution by Trial Phase
- Figure 6.3. Clinical Trial Analysis: Distribution by Trial Recruitment Status
- Figure 6.4. Clinical Trial Analysis: Distribution by Trial Registration Year and Number of Patients Enrolled
- Figure 6.5. Clinical Trial Analysis: Distribution by Study Design
- Figure 6.6. Leading Trial Sponsors: Distribution by Number of Registered Trials
- Figure 6.7. Leading Industry Sponsors: Distribution by Number of Registered Trials
- Figure 6.8. Word Cloud: Key Focus Areas
- Figure 6.9. Clinical Trial Analysis: Distribution by Target Therapeutic Area
- Figure 6.10. Popular Interventions: Distribution by Number of Registered Trials
- Figure 6.11. Clinical Trial Analysis: Geographical Distribution by Number of Registered Trials
- Figure 6.12. Clinical Trial Analysis: Geographical Distribution by Trial Recruitment Status
- Figure 6.13. Clinical Trial Analysis: Geographical Distribution by Number of Patients Enrolled
- Figure 7.1. Clinical Trial Site Analysis: Cumulative Distribution of Clinical Trial Centre
- Figure 7.2. Clinical Trial Site Analysis: Distribution by Type of Psychedelic Substance
- Figure 7.3. Clinical Trial Site Analysis: Distribution by Trial Phase
- Figure 7.4. Clinical Trial Site Analysis: Distribution by Target Therapeutic Area
- Figure 7.5. Clinical Trial Site Analysis: Distribution by Location of Clinical Trial Center
- Figure 8.1. KOL Analysis: Distribution by Type of Organization (KOL Affiliation)
- Figure 8.2. KOL Analysis: Geographical Distribution of KOLs in America
- Figure 8.3. KOL Analysis: Geographical Distribution of KOLs in Europe, Asia-Pacific and RoW
- Figure 8.4. KOL Analysis: Distribution by Location of Organization (KOL Affiliation)
- Figure 8.5. KOL Analysis: Leading Organizations (KOL Affiliation)
- Figure 8.6. KOL Analysis: Dot-Plot of KOLs
- Figure 8.7. KOL Benchmarking: Roots Analysis' Assessment versus Third Party (ResearchGate Score)
- Figure 8.8. KOL Analysis: Most Prominent KOLs
- Figure 9.1. Grant Analysis: Cumulative Trend by Year of Grant Award, Since 2015
- Figure 9.2. Grant Analysis: Cumulative Distribution by Amount Awarded, Since 2015 (USD Million)
- Figure 9.3. Grant Analysis: Distribution by Funding Institute Center
- Figure 9.4. Grant Analysis: Distribution by Support Period
- Figure 9.5. Grant Analysis: Distribution by Funding Institute Center and Support Period
- Figure 9.6. Grant Analysis: Distribution by Type of Grant Application
- Figure 9.7. Grant Analysis: Distribution by Purpose of Grant Award
- Figure 9.8. Grant Analysis: Distribution by Activity Code
- Figure 9.9. Grant Analysis: Distribution by Study Section Involved
- Figure 9.10. Grant Analysis: Distribution by Recipient Organization
- Figure 9.11. Grant Analysis: Regional Distribution of Recipient Organizations
- Figure 9.12. Word Cloud Analysis: Emerging Focus Areas
- Figure 9.13. Popular Psychedelic Therapeutics: Distribution by Number of Grants
- Figure 9.14. Popular Funding Institute Centers: Distribution by Number of Grants
- Figure 9.15. Grant Analysis: Prominent Program Officers
- Figure 9.16. Popular Recipient Organizations: Distribution by Number of Grants
- Figure 10.1. Partnerships and Collaborations: Cumulative Year-wise Trend, Since 2017
- Figure 10.2. Partnerships and Collaborations: Distribution by Type of Partnership
- Figure 10.3. Partnerships and Collaborations: Distribution by Type of Partnership and Type of Psychedelic Substance Involved
- Figure 10.4. Partnerships and Collaborations: Distribution by Type of Partnership and Phase of Development of Involved Intervention
- Figure 10.5. Partnerships and Collaborations: Distribution by Type of Psychedelic Substance and Target Therapeutic Area
- Figure 10.6. Partnerships and Collaborations: Distribution by Type of Partnership and Type of Partner
- Figure 10.7. Partnerships and Collaborations: Distribution by Type of Psychedelic Substance Involved and Type of Partner
- Figure 10.8. Most Active Players: Distribution by Number of Partnerships
- Figure 10.9. Partnership and Collaborations: Regional Distribution
- Figure 10.10. Partnerships and Collaborations: Intercontinental and Intracontinental Deals
- Figure 11.1. Mergers and Acquisitions: Cumulative Year-wise Trend, Since 2017
- Figure 11.2. Mergers and Acquisitions: Distribution by Type of Acquisition
- Figure 11.3. Mergers and Acquisitions: Distribution by Type of Psychedelic Substance Involved
- Figure 11.4. Mergers and Acquisitions: Distribution by Year of Acquisition and Type of Psychedelic Substance Involved
- Figure 11.5. Most Active Players: Distribution by Number of Acquisition
- Figure 11.6. Mergers and Acquisitions: Regional Distribution
- Figure 11.7. Mergers and Acquisitions: Intercontinental and Intracontinental Deals
- Figure 11.8. Mergers and Acquisitions: Distribution by Key Value Drivers
- Figure 11.9. Mergers and Acquisitions: Distribution by Year of Acquisition and Key Value Drivers
- Figure 12.1. Global Psychedelic Therapeutics Market, Till 2035 (USD Million)
- Figure 12.2. COMP360 (COMPASS Pathways): Target Patient Population
- Figure 12.3. COMP360 (COMPASS Pathways): Sales Forecast
- Figure 12.4. Esketamine DPI (Celon Pharma): Target Patient Population
- Figure 12.5. Esketamine DPI (Celon Pharma): Sales Forecast
- Figure 12.6. FT218 (Avadel Pharmaceuticals): Target Patient Population
- Figure 12.7. FT218 (Avadel Pharmaceuticals): Sales Forecast
- Figure 12.8. JZP-258 (Jazz Pharmaceuticals): Target Patient Population
- Figure 12.9. JZP-258 (Jazz Pharmaceuticals): Sales Forecast
- Figure 12.10. NRX-100 (NeuroRx): Target Patient Population
- Figure 12.11. NRX-100 (NeuroRx): Sales Forecast
- Figure 12.12. R-107 (Doughlas pharmaceuticals): Target Patient Population
- Figure 12.13. R-107 (Doughlas pharmaceuticals): Sales Forecast
- Figure 12.14. SPRAVATO(R) (Janssen Pharmaceuticals): Target Patient Population
- Figure 12.15. SPRAVATO(R) (Janssen Pharmaceuticals): Sales Forecast
- Figure 12.16. Unnamed (MDMA) (MAPS Public Benefit): Target Patient Population
- Figure 12.17. Unnamed (MDMA) (MAPS Public Benefit): Sales Forecast
- Figure 12.18. Unnamed (Psilocybin) (The Emmes Company): Target Patient Population
- Figure 12.19. Unnamed (Psilocybin) (The Emmes Company): Sales Forecast
- Figure 12.20. Wafermine(TM) (iX Biopharma): Target Patient Population
- Figure 12.21. Wafermine(TM) (iX Biopharma): Sales Forecast
- Figure 12.22. XYREM(R) (Jazz Pharmaceuticals): Target Patient Population
- Figure 12.23. XYREM(R) (Jazz Pharmaceuticals): Sales Forecast
- Figure 12.24. Global Psychedelic Therapeutics Market: Distribution by Origin of Psychedelic Substances, Till 2035 (USD Million)
- Figure 12.25. Global Psychedelic Therapeutics Market for Synthetic Substances, Till 2035
- Figure 12.26. Global Psychedelic Therapeutics Market for Natural Substances, Till 2035
- Figure 12.27. Global Psychedelic Therapeutics Market: Distribution by Type of Psychedelic Substance, Till 2035 (USD Million)
- Figure 12.28. Global Psychedelic Therapeutics Market for GHB, Till 2035
- Figure 12.29. Global Psychedelic Therapeutics Market for Ketamine, Till 2035
- Figure 12.30. Global Psychedelic Therapeutics Market for MDMA, Till 2035
- Figure 12.31. Global Psychedelic Therapeutics Market for Psilocybin, Till 2035
- Figure 12.32. Global Psychedelic Therapeutics Market: Distribution by Geography, Till 2035 (USD Million)
- Figure 12.33. Global Psychedelic Therapeutics Market in North America, Till 2035 (USD Million)
- Figure 12.34. Global Psychedelic Therapeutics Market in Europe, Till 2035 (USD Million)
- Figure 12.35. Global Psychedelic Therapeutics Market in Asia Pacific and Rest of the World, Till 2035 (USD Million)
- Figure 12.36. Psychedelic Therapeutics Market: Distribution by Target Therapeutic Area, Till 2035 (USD Million)
- Figure 12.37. Global Psychedelic Therapeutics Market for Depression and Anxiety Disorders, Till 2035 (USD Million)
- Figure 12.38. Global Psychedelic Therapeutics Market for Pain Disorders, Till 2035 (USD Million)
- Figure 12.39. Global Psychedelic Therapeutics Market for Sleep-Related Disorders, Till 2035 (USD Million)
- Figure 12.40. Global Psychedelic Therapeutics Market for Trauma, Till 2035 (USD Million)
- Figure 12.41. Global Psychedelic Therapeutics Market: Distribution by Route of Administration, Till 2035 (USD Million)
- Figure 12.42. Global Psychedelic Therapeutics Market for Intranasal Therapies, Till 2035 (USD Million)
- Figure 12.43. Global Psychedelic Therapeutics Market for Intravenous Therapies, Till 2035 (USD Million)
- Figure 12.44. Global Psychedelic Therapeutics Market for Oral Therapies, Till 2035 (USD Million)
- Figure 12.45. Global Psychedelic Therapeutics Market for Sublingual Therapies, Till 2035 (USD Million)

