
PUBLISHER: Roots Analysis | PRODUCT CODE: 1883292

PUBLISHER: Roots Analysis | PRODUCT CODE: 1883292
Solar Vehicle Market, Till 2035: Distribution by Type of Vehicle, Type of Battery, Type of Electronic Vehicle, Type of Solar Panel, Type of Enterprise, and Geographical Regions: Industry Trends and Global Forecasts
Solar Vehicle Market Overview
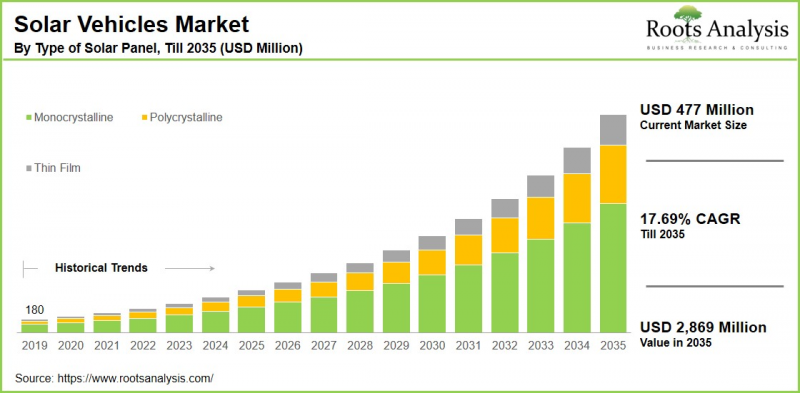
As per Roots Analysis, the global solar vehicle market size is estimated to grow from USD 477 million in the current year USD 2,869 million by 2035, at a CAGR of 17.69% during the forecast period, till 2035.
The opportunity for solar vehicle market has been distributed across the following segments:
Type of Vehicle
- Commercial Vehicles
- Passenger Vehicles
Type of Battery
- Lead Acid
- Lithium Ion
- Nickel Cadmium
- Others
Type of Electronic Vehicle
- Battery Electric Vehicle
- Hybrid Electric Vehicle
Type of Solar Panel
- Monocrystalline
- Polycrystalline
- Thin Film
Type of Enterprise
- Large
- Small and Medium Enterprise
Geographical Regions
- North America
- US
- Canada
- Mexico
- Other North American countries
- Europe
- Austria
- Belgium
- Denmark
- France
- Germany
- Ireland
- Italy
- Netherlands
- Norway
- Russia
- Spain
- Sweden
- Switzerland
- UK
- Other European countries
- Asia
- China
- India
- Japan
- Singapore
- South Korea
- Other Asian countries
- Latin America
- Brazil
- Chile
- Colombia
- Venezuela
- Other Latin American countries
- Middle East and North Africa
- Egypt
- Iran
- Iraq
- Israel
- Kuwait
- Saudi Arabia
- UAE
- Other MENA countries
- Rest of the World
- Australia
- New Zealand
- Other countries
Solar Vehicle Market: Growth and Trends
On average, a standard passenger vehicle produces over 4.5 metric tons of carbon dioxide annually. This statistic highlights the importance of solar vehicles, which utilize sunlight to drive electric motors. Solar cars operate using photovoltaic (PV) cells that transform sunlight into electricity, either for immediate use in powering the vehicle or for storage in batteries. It is important to note that solar vehicles are preferred for their advancements in lightweight materials, effective energy conversion systems, and their capacity to function with minimal environmental impact. Moreover, the growth trend in the solar vehicle market is driven by increasing demand for eco-friendly alternatives to gasoline-powered cars.
The solar vehicle market is anticipated to grow substantially over the forecast period, due to strict regulations aimed at promoting sustainability within the automotive sector. A significant innovation is the development of maximum power point tracking (MPPT) circuits, which have optimized energy production from solar panels. Additionally, other advancements in manufacturing encompass enhanced battery performance and hybrid-electric technology. Importantly, rising environmental concerns related to greenhouse gas emissions have prompted authorities and regulatory organizations in various countries to promote the use of eco-friendly vehicles while ensuring road safety.
Solar Vehicle Market: Key Segments
Market Share by Type of Vehicle
Based on type of vehicle, the global solar vehicle market is segmented into commercial vehicles and passenger vehicles. According to our estimates, currently, the passenger vehicles segment captures the majority of the market share. Additionally, this segment is expected to expand at a notably higher CAGR in the near future. This growth can be linked to increasing consumer awareness regarding environmental concerns, advancements in solar technology, and favorable government initiatives.
Market Share by Type of Battery
Based on type of battery, the global solar vehicle market is segmented into lead acid, lithium ion, nickel cadmium and others. According to our estimates, currently, the lithium-ion segment captures the majority of the market share. Additionally, this segment is projected to experience a relatively higher CAGR during the forecast period. This growth can be linked to their superior energy density, enabling more energy storage in a compact size, along with their extended cycle life, ensuring long-term durability and cost-effectiveness.
Market Share by Type of Electronic Vehicle
Based on type of electronic vehicle, the global solar vehicle market is segmented into battery electric vehicle and hybrid electric vehicle. According to our estimates, currently, the hybrid solar vehicle segment captures the majority of the market share. Additionally, this segment is expected to experience a comparatively higher compound annual growth rate during the forecast period. This growth is driven by government incentives for solar vehicles and strict emission regulations that improve their cost-effectiveness.
Market Share by Type of Solar Panel
Based on type of solar panel, the global solar vehicle market is segmented into monocrystalline, polycrystalline and others. According to our estimates, currently, the monocrystalline segment captures the majority of the market share. This is due to the high energy efficiency in solar cars, enabling more electricity generation in smaller spaces.
Conversely, the polycrystalline segment is expected to experience a faster growth rate during the forecast period. This can be attributed to their affordability and ease of manufacturing, as polycrystalline panels are generally about 20% cheaper, making them an appealing choice for both consumers and manufacturers looking for cost-effective solar options.
Market Share by Type of Enterprise
Based on type of enterprise, the global solar vehicle market is segmented into large and small and medium enterprise. According to our estimates, currently, the large enterprise segment captures the majority of the market share. This growth can be attributed to their ability to invest in solar vehicle technologies, take advantage of considerable resources, achieve economies of scale, and promote business expansion.
Market Share by Geographical Regions
Based on geographical regions, the solar vehicle market is segmented into North America, Europe, Asia, Latin America, Middle East and North Africa, and the rest of the world. According to our estimates, currently North America captures the majority share of the market, owing to strong governmental backing, growing awareness of the environmental advantages of solar vehicles, and notable advancements in solar technology for transportation.
Consequently, Asia is projected to experience the highest compound annual growth rate (CAGR) during the forecast period. Key factors driving this growth include the rapid development of solar vehicle charging infrastructure and an increasing consumer demand for sustainable transportation solutions.
Example Players in Solar Vehicle Market
- Aptera
- BMW
- Daimler
- Fiat Chrysler
- Fiat Chrysler
- Fisker
- Ford
- Hyundai Motor
- Lightyear
- Mahindra & Mahindra
- Nissan
- Sono Motors
- Tata Motors
- Tesla
- Toyota
- Volkswagen
Solar Vehicle Market: Research Coverage
The report on the solar vehicle market features insights on various sections, including:
- Market Sizing and Opportunity Analysis: An in-depth analysis of the solar vehicle market, focusing on key market segments, including [A] type of vehicle, [B] type of battery, [C] type of electronic vehicle, [D] type of solar panel, [E] type of enterprise, and [F] geographical regions.
- Competitive Landscape: A comprehensive analysis of the companies engaged in the solar vehicle market, based on several relevant parameters, such as [A] year of establishment, [B] company size, [C] location of headquarters and [D] ownership structure.
- Company Profiles: Elaborate profiles of prominent players engaged in the solar vehicle market, providing details on [A] location of headquarters, [B] company size, [C] company mission, [D] company footprint, [E] management team, [F] contact details, [G] financial information, [H] operating business segments, [I] portfolio, [J] moat analysis, [K] recent developments, and an informed future outlook.
- Megatrends: An evaluation of ongoing megatrends in the solar vehicle industry.
- Patent Analysis: An insightful analysis of patents filed / granted in the solar vehicle domain, based on relevant parameters, including [A] type of patent, [B] patent publication year, [C] patent age and [D] leading players.
- Recent Developments: An overview of the recent developments made in the solar vehicle market, along with analysis based on relevant parameters, including [A] year of initiative, [B] type of initiative, [C] geographical distribution and [D] most active players.
- Porter's Five Forces Analysis: An analysis of five competitive forces prevailing in the solar vehicle market, including threats of new entrants, bargaining power of buyers, bargaining power of suppliers, threats of substitute products and rivalry among existing competitors.
- SWOT Analysis: An insightful SWOT framework, highlighting the strengths, weaknesses, opportunities and threats in the domain. Additionally, it provides Harvey ball analysis, highlighting the relative impact of each SWOT parameter.
- Value Chain Analysis: A comprehensive analysis of the value chain, providing information on the different phases and stakeholders involved in the solar vehicle market.
Key Questions Answered in this Report
- How many companies are currently engaged in solar vehicle market?
- Which are the leading companies in this market?
- What factors are likely to influence the evolution of this market?
- What is the current and future market size?
- What is the CAGR of this market?
- How is the current and future market opportunity likely to be distributed across key market segments?
Reasons to Buy this Report
- The report provides a comprehensive market analysis, offering detailed revenue projections of the overall market and its specific sub-segments. This information is valuable to both established market leaders and emerging entrants.
- Stakeholders can leverage the report to gain a deeper understanding of the competitive dynamics within the market. By analyzing the competitive landscape, businesses can make informed decisions to optimize their market positioning and develop effective go-to-market strategies.
- The report offers stakeholders a comprehensive overview of the market, including key drivers, barriers, opportunities, and challenges. This information empowers stakeholders to stay abreast of market trends and make data-driven decisions to capitalize on growth prospects.
Additional Benefits
- Complimentary Excel Data Packs for all Analytical Modules in the Report
- 15% Free Content Customization
- Detailed Report Walkthrough Session with Research Team
- Free Updated report if the report is 6-12 months old or older
TABLE OF CONTENTS
SECTION I: REPORT OVERVIEW
1. PREFACE
- 1.1. Introduction
- 1.2. Market Share Insights
- 1.3. Key Market Insights
- 1.4. Report Coverage
- 1.5. Key Questions Answered
- 1.6. Chapter Outlines
2. RESEARCH METHODOLOGY
- 2.1. Chapter Overview
- 2.2. Research Assumptions
- 2.3. Database Building
- 2.3.1. Data Collection
- 2.3.2. Data Validation
- 2.3.3. Data Analysis
- 2.4. Project Methodology
- 2.4.1. Secondary Research
- 2.4.1.1. Annual Reports
- 2.4.1.2. Academic Research Papers
- 2.4.1.3. Company Websites
- 2.4.1.4. Investor Presentations
- 2.4.1.5. Regulatory Filings
- 2.4.1.6. White Papers
- 2.4.1.7. Industry Publications
- 2.4.1.8. Conferences and Seminars
- 2.4.1.9. Government Portals
- 2.4.1.10. Media and Press Releases
- 2.4.1.11. Newsletters
- 2.4.1.12. Industry Databases
- 2.4.1.13. Roots Proprietary Databases
- 2.4.1.14. Paid Databases and Sources
- 2.4.1.15. Social Media Portals
- 2.4.1.16. Other Secondary Sources
- 2.4.2. Primary Research
- 2.4.2.1. Introduction
- 2.4.2.2. Types
- 2.4.2.2.1. Qualitative
- 2.4.2.2.2. Quantitative
- 2.4.2.3. Advantages
- 2.4.2.4. Techniques
- 2.4.2.4.1. Interviews
- 2.4.2.4.2. Surveys
- 2.4.2.4.3. Focus Groups
- 2.4.2.4.4. Observational Research
- 2.4.2.4.5. Social Media Interactions
- 2.4.2.5. Stakeholders
- 2.4.2.5.1. Company Executives (CXOs)
- 2.4.2.5.2. Board of Directors
- 2.4.2.5.3. Company Presidents and Vice Presidents
- 2.4.2.5.4. Key Opinion Leaders
- 2.4.2.5.5. Research and Development Heads
- 2.4.2.5.6. Technical Experts
- 2.4.2.5.7. Subject Matter Experts
- 2.4.2.5.8. Scientists
- 2.4.2.5.9. Doctors and Other Healthcare Providers
- 2.4.2.6. Ethics and Integrity
- 2.4.2.6.1. Research Ethics
- 2.4.2.6.2. Data Integrity
- 2.4.3. Analytical Tools and Databases
- 2.4.1. Secondary Research
3. MARKET DYNAMICS
- 3.1. Forecast Methodology
- 3.1.1. Top-Down Approach
- 3.1.2. Bottom-Up Approach
- 3.1.3. Hybrid Approach
- 3.2. Market Assessment Framework
- 3.2.1. Total Addressable Market (TAM)
- 3.2.2. Serviceable Addressable Market (SAM)
- 3.2.3. Serviceable Obtainable Market (SOM)
- 3.2.4. Currently Acquired Market (CAM)
- 3.3. Forecasting Tools and Techniques
- 3.3.1. Qualitative Forecasting
- 3.3.2. Correlation
- 3.3.3. Regression
- 3.3.4. Time Series Analysis
- 3.3.5. Extrapolation
- 3.3.6. Convergence
- 3.3.7. Forecast Error Analysis
- 3.3.8. Data Visualization
- 3.3.9. Scenario Planning
- 3.3.10. Sensitivity Analysis
- 3.4. Key Considerations
- 3.4.1. Demographics
- 3.4.2. Market Access
- 3.4.3. Reimbursement Scenarios
- 3.4.4. Industry Consolidation
- 3.5. Robust Quality Control
- 3.6. Key Market Segmentations
- 3.7. Limitations
4. MACRO-ECONOMIC INDICATORS
- 4.1. Chapter Overview
- 4.2. Market Dynamics
- 4.2.1. Time Period
- 4.2.1.1. Historical Trends
- 4.2.1.2. Current and Forecasted Estimates
- 4.2.2. Currency Coverage
- 4.2.2.1. Overview of Major Currencies Affecting the Market
- 4.2.2.2. Impact of Currency Fluctuations on the Industry
- 4.2.3. Foreign Exchange Impact
- 4.2.3.1. Evaluation of Foreign Exchange Rates and Their Impact on Market
- 4.2.3.2. Strategies for Mitigating Foreign Exchange Risk
- 4.2.4. Recession
- 4.2.4.1. Historical Analysis of Past Recessions and Lessons Learnt
- 4.2.4.2. Assessment of Current Economic Conditions and Potential Impact on the Market
- 4.2.5. Inflation
- 4.2.5.1. Measurement and Analysis of Inflationary Pressures in the Economy
- 4.2.5.2. Potential Impact of Inflation on the Market Evolution
- 4.2.6. Interest Rates
- 4.2.6.1. Overview of Interest Rates and Their Impact on the Market
- 4.2.6.2. Strategies for Managing Interest Rate Risk
- 4.2.7. Commodity Flow Analysis
- 4.2.7.1. Type of Commodity
- 4.2.7.2. Origins and Destinations
- 4.2.7.3. Values and Weights
- 4.2.7.4. Modes of Transportation
- 4.2.8. Global Trade Dynamics
- 4.2.8.1. Import Scenario
- 4.2.8.2. Export Scenario
- 4.2.9. War Impact Analysis
- 4.2.9.1. Russian-Ukraine War
- 4.2.9.2. Israel-Hamas War
- 4.2.10. COVID Impact / Related Factors
- 4.2.10.1. Global Economic Impact
- 4.2.10.2. Industry-specific Impact
- 4.2.10.3. Government Response and Stimulus Measures
- 4.2.10.4. Future Outlook and Adaptation Strategies
- 4.2.11. Other Indicators
- 4.2.11.1. Fiscal Policy
- 4.2.11.2. Consumer Spending
- 4.2.11.3. Gross Domestic Product (GDP)
- 4.2.11.4. Employment
- 4.2.11.5. Taxes
- 4.2.11.6. R&D Innovation
- 4.2.11.7. Stock Market Performance
- 4.2.11.8. Supply Chain
- 4.2.11.9. Cross-Border Dynamics
- 4.2.1. Time Period
SECTION II: QUALITATIVE INSIGHTS
5. EXECUTIVE SUMMARY
6. INTRODUCTION
- 6.1. Chapter Overview
- 6.2. Overview of Solar Vehicle Market
- 6.2.1. Type of Vehicle
- 6.2.2. Type of Battery
- 6.2.3. Type of Electronic Vehicle
- 6.2.4. Type of Solar Panel
- 6.2.5. Type of Enterprise
- 6.3. Future Perspective
7. REGULATORY SCENARIO
SECTION III: MARKET OVERVIEW
8. COMPREHENSIVE DATABASE OF LEADING PLAYERS
9. COMPETITIVE LANDSCAPE
- 9.1. Chapter Overview
- 9.2. Solar Vehicle: Overall Market Landscape
- 9.2.1. Analysis by Year of Establishment
- 9.2.2. Analysis by Company Size
- 9.2.3. Analysis by Location of Headquarters
- 9.2.4. Analysis by Ownership Structure
10. WHITE SPACE ANALYSIS
11. COMPANY COMPETITIVENESS ANALYSIS
12. STARTUP ECOSYSTEM IN THE SOLAR VEHICLE MARKET
- 12.1. Solar Vehicle Market: Market Landscape of Startups
- 12.1.1. Analysis by Year of Establishment
- 12.1.2. Analysis by Company Size
- 12.1.3. Analysis by Company Size and Year of Establishment
- 12.1.4. Analysis by Location of Headquarters
- 12.1.5. Analysis by Company Size and Location of Headquarters
- 12.1.6. Analysis by Ownership Structure
- 12.2. Key Findings
SECTION IV: COMPANY PROFILES
13. COMPANY PROFILES
- 13.1. Chapter Overview
- 13.2. Aptera*
- 13.2.1. Company Overview
- 13.2.2. Company Mission
- 13.2.3. Company Footprint
- 13.2.4. Management Team
- 13.2.5. Contact Details
- 13.2.6. Financial Performance
- 13.2.7. Operating Business Segments
- 13.2.8. Service / Product Portfolio (project specific)
- 13.2.9. MOAT Analysis
- 13.2.10. Recent Developments and Future Outlook
- 13.3. BMW
- 13.4. Daimler
- 13.5. Fiat Chrysler
- 13.6. Fiat Chrysler
- 13.7. Fisker
- 13.8. Ford
- 13.9. Hyundai Motor
- 13.10. Lightyear
- 13.11. Mahindra & Mahindra
- 13.12. Nissan
- 13.13. Sono Motors
- 13.14. Tata Motors
- 13.15. Tesla
- 13.16. Toyota
- 13.17. Volkswagen
SECTION V: MARKET TRENDS
14. MEGA TRENDS ANALYSIS
15. UNMET NEED ANALYSIS
16. PATENT ANALYSIS
17. RECENT DEVELOPMENTS
- 17.1. Chapter Overview
- 17.2. Recent Funding
- 17.3. Recent Partnerships
- 17.4. Other Recent Initiatives
SECTION VI: MARKET OPPORTUNITY ANALYSIS
18. GLOBAL SOLAR VEHICLE MARKET
- 18.1. Chapter Overview
- 18.2. Key Assumptions and Methodology
- 18.3. Trends Disruption Impacting Market
- 18.4. Demand Side Trends
- 18.5. Supply Side Trends
- 18.6. Global Solar Vehicle Market, Historical Trends (Since 2019) and Forecasted Estimates (Till 2035)
- 18.7. Multivariate Scenario Analysis
- 18.7.1. Conservative Scenario
- 18.7.2. Optimistic Scenario
- 18.8. Investment Feasibility Index
- 18.9. Key Market Segmentations
19. MARKET OPPORTUNITIES BASED ON TYPE OF VEHICLE
- 19.1. Chapter Overview
- 19.2. Key Assumptions and Methodology
- 19.3. Revenue Shift Analysis
- 19.4. Market Movement Analysis
- 19.5. Penetration-Growth (P-G) Matrix
- 19.6. Solar Vehicle Market for Commercial Vehicles: Historical Trends (Since 2019) and Forecasted Estimates (Till 2035)
- 19.7. Solar Vehicle Market for Passenger Vehicles: Historical Trends (Since 2019) and Forecasted Estimates (Till 2035)
- 19.8. Data Triangulation and Validation
- 19.8.1. Secondary Sources
- 19.8.2. Primary Sources
- 19.8.3. Statistical Modeling
20. MARKET OPPORTUNITIES BASED ON TYPE OF BATTERY
- 20.1. Chapter Overview
- 20.2. Key Assumptions and Methodology
- 20.3. Revenue Shift Analysis
- 20.4. Market Movement Analysis
- 20.5. Penetration-Growth (P-G) Matrix
- 20.6. Solar Vehicle Market for Lead Acid: Historical Trends (Since 2019) and Forecasted Estimates (Till 2035)
- 20.7. Solar Vehicle Market for Lithium Ion: Historical Trends (Since 2019) and Forecasted Estimates (Till 2035)
- 20.8. Solar Vehicle Market for Nickel Cadmium: Historical Trends (Since 2019) and Forecasted Estimates (Till 2035)
- 20.9. Solar Vehicle Market for Others: Historical Trends (Since 2019) and Forecasted Estimates (Till 2035)
- 20.10. Data Triangulation and Validation
- 20.10.1. Secondary Sources
- 20.10.2. Primary Sources
- 20.10.3. Statistical Modeling
21. MARKET OPPORTUNITIES BASED ON TYPE OF ELECTRONIC VEHICLE
- 21.1. Chapter Overview
- 21.2. Key Assumptions and Methodology
- 21.3. Revenue Shift Analysis
- 21.4. Market Movement Analysis
- 21.5. Penetration-Growth (P-G) Matrix
- 21.6. Solar Vehicle Market for Battery Electric Vehicle: Historical Trends (Since 2019) and Forecasted Estimates (Till 2035)
- 21.7. Solar Vehicle Market for Hybrid Electric Vehicle: Historical Trends (Since 2019) and Forecasted Estimates (Till 2035)
- 21.8. Data Triangulation and Validation
- 21.8.1. Secondary Sources
- 21.8.2. Primary Sources
- 21.8.3. Statistical Modeling
22. MARKET OPPORTUNITIES BASED ON TYPE OF SOLAR PANEL
- 22.1. Chapter Overview
- 22.2. Key Assumptions and Methodology
- 22.3. Revenue Shift Analysis
- 22.4. Market Movement Analysis
- 22.5. Penetration-Growth (P-G) Matrix
- 22.6. Solar Vehicle Market for Monocrystalline: Historical Trends (Since 2019) and Forecasted Estimates (Till 2035)
- 22.7. Solar Vehicle Market for Polycrystalline: Historical Trends (Since 2019) and Forecasted Estimates (Till 2035)
- 22.8. Solar Vehicle Market for Thin Film: Historical Trends (Since 2019) and Forecasted Estimates (Till 2035)
- 22.9. Data Triangulation and Validation
- 22.9.1. Secondary Sources
- 22.9.2. Primary Sources
- 22.9.3. Statistical Modeling
23. MARKET OPPORTUNITIES BASED ON TYPE OF ENTERPRISE
- 23.1. Chapter Overview
- 23.2. Key Assumptions and Methodology
- 23.3. Revenue Shift Analysis
- 23.4. Market Movement Analysis
- 23.5. Penetration-Growth (P-G) Matrix
- 23.6. Solar Vehicle Market for Large: Historical Trends (Since 2019) and Forecasted Estimates (Till 2035)
- 23.7. Solar Vehicle Market for Small and Medium Enterprise: Historical Trends (Since 2019) and Forecasted Estimates (Till 2035)
- 23.8. Data Triangulation and Validation
- 23.8.1. Secondary Sources
- 23.8.2. Primary Sources
- 23.8.3. Statistical Modeling
24. MARKET OPPORTUNITIES FOR SOLAR VEHICLE IN NORTH AMERICA
- 24.1. Chapter Overview
- 24.2. Key Assumptions and Methodology
- 24.3. Revenue Shift Analysis
- 24.4. Market Movement Analysis
- 24.5. Penetration-Growth (P-G) Matrix
- 24.6. Solar Vehicle Market in North America: Historical Trends (Since 2019) and Forecasted Estimates (Till 2035)
- 24.6.1. Solar Vehicle Market in the US: Historical Trends (Since 2019) and Forecasted Estimates (Till 2035)
- 24.6.2. Solar Vehicle Market in Canada: Historical Trends (Since 2019) and Forecasted Estimates (Till 2035)
- 24.6.3. Solar Vehicle Market in Mexico: Historical Trends (Since 2019) and Forecasted Estimates (Till 2035)
- 24.6.4. Solar Vehicle Market in Other North American Countries: Historical Trends (Since 2019) and Forecasted Estimates (Till 2035)
- 24.7. Data Triangulation and Validation
25. MARKET OPPORTUNITIES FOR SOLAR VEHICLE IN EUROPE
- 25.1. Chapter Overview
- 25.2. Key Assumptions and Methodology
- 25.3. Revenue Shift Analysis
- 25.4. Market Movement Analysis
- 25.5. Penetration-Growth (P-G) Matrix
- 25.6. Solar Vehicle Market in Europe: Historical Trends (Since 2019) and Forecasted Estimates (Till 2035)
- 25.6.1. Solar Vehicle Market in Austria: Historical Trends (Since 2019) and Forecasted Estimates (Till 2035)
- 25.6.2. Solar Vehicle Market in Belgium: Historical Trends (Since 2019) and Forecasted Estimates (Till 2035)
- 25.6.3. Solar Vehicle Market in Denmark: Historical Trends (Since 2019) and Forecasted Estimates (Till 2035)
- 25.6.4. Solar Vehicle Market in France: Historical Trends (Since 2019) and Forecasted Estimates (Till 2035)
- 25.6.5. Solar Vehicle Market in Germany: Historical Trends (Since 2019) and Forecasted Estimates (Till 2035)
- 25.6.6. Solar Vehicle Market in Ireland: Historical Trends (Since 2019) and Forecasted Estimates (Till 2035)
- 25.6.7. Solar Vehicle Market in Italy: Historical Trends (Since 2019) and Forecasted Estimates (Till 2035)
- 25.6.8. Solar Vehicle Market in Netherlands: Historical Trends (Since 2019) and Forecasted Estimates (Till 2035)
- 25.6.9. Solar Vehicle Market in Norway: Historical Trends (Since 2019) and Forecasted Estimates (Till 2035)
- 25.6.10. Solar Vehicle Market in Russia: Historical Trends (Since 2019) and Forecasted Estimates (Till 2035)
- 25.6.11. Solar Vehicle Market in Spain: Historical Trends (Since 2019) and Forecasted Estimates (Till 2035)
- 25.6.12. Solar Vehicle Market in Sweden: Historical Trends (Since 2019) and Forecasted Estimates (Till 2035)
- 25.6.13. Solar Vehicle Market in Switzerland: Historical Trends (Since 2019) and Forecasted Estimates (Till 2035)
- 25.6.14. Solar Vehicle Market in the UK: Historical Trends (Since 2019) and Forecasted Estimates (Till 2035)
- 25.6.15. Solar Vehicle Market in Other European Countries: Historical Trends (Since 2019) and Forecasted Estimates (Till 2035)
- 25.7. Data Triangulation and Validation
26. MARKET OPPORTUNITIES FOR SOLAR VEHICLE IN ASIA
- 26.1. Chapter Overview
- 26.2. Key Assumptions and Methodology
- 26.3. Revenue Shift Analysis
- 26.4. Market Movement Analysis
- 26.5. Penetration-Growth (P-G) Matrix
- 26.6. Solar Vehicle Market in Asia: Historical Trends (Since 2019) and Forecasted Estimates (Till 2035)
- 26.6.1. Solar Vehicle Market in China: Historical Trends (Since 2019) and Forecasted Estimates (Till 2035)
- 26.6.2. Solar Vehicle Market in India: Historical Trends (Since 2019) and Forecasted Estimates (Till 2035)
- 26.6.3. Solar Vehicle Market in Japan: Historical Trends (Since 2019) and Forecasted Estimates (Till 2035)
- 26.6.4. Solar Vehicle Market in Singapore: Historical Trends (Since 2019) and Forecasted Estimates (Till 2035)
- 26.6.5. Solar Vehicle Market in South Korea: Historical Trends (Since 2019) and Forecasted Estimates (Till 2035)
- 26.6.6. Solar Vehicle Market in Other Asian Countries: Historical Trends (Since 2019) and Forecasted Estimates (Till 2035)
- 26.7. Data Triangulation and Validation
27. MARKET OPPORTUNITIES FOR SOLAR VEHICLE IN MIDDLE EAST AND NORTH AFRICA (MENA)
- 27.1. Chapter Overview
- 27.2. Key Assumptions and Methodology
- 27.3. Revenue Shift Analysis
- 27.4. Market Movement Analysis
- 27.5. Penetration-Growth (P-G) Matrix
- 27.6. Solar Vehicle Market in Middle East and North Africa (MENA): Historical Trends (Since 2019) and Forecasted Estimates (Till 2035)
- 27.6.1. Solar Vehicle Market in Egypt: Historical Trends (Since 2019) and Forecasted Estimates (Till 205)
- 27.6.2. Solar Vehicle Market in Iran: Historical Trends (Since 2019) and Forecasted Estimates (Till 2035)
- 27.6.3. Solar Vehicle Market in Iraq: Historical Trends (Since 2019) and Forecasted Estimates (Till 2035)
- 27.6.4. Solar Vehicle Market in Israel: Historical Trends (Since 2019) and Forecasted Estimates (Till 2035)
- 27.6.5. Solar Vehicle Market in Kuwait: Historical Trends (Since 2019) and Forecasted Estimates (Till 2035)
- 27.6.6. Solar Vehicle Market in Saudi Arabia: Historical Trends (Since 2019) and Forecasted Estimates (Till 2035)
- 27.6.7. Solar Vehicle Market in United Arab Emirates (UAE): Historical Trends (Since 2019) and Forecasted Estimates (Till 2035)
- 27.6.8. Solar Vehicle Market in Other MENA Countries: Historical Trends (Since 2019) and Forecasted Estimates (Till 2035)
- 27.7. Data Triangulation and Validation
28. MARKET OPPORTUNITIES FOR SOLAR VEHICLE IN LATIN AMERICA
- 28.1. Chapter Overview
- 28.2. Key Assumptions and Methodology
- 28.3. Revenue Shift Analysis
- 28.4. Market Movement Analysis
- 28.5. Penetration-Growth (P-G) Matrix
- 28.6. Solar Vehicle Market in Latin America: Historical Trends (Since 2019) and Forecasted Estimates (Till 2035)
- 28.6.1. Solar Vehicle Market in Argentina: Historical Trends (Since 2019) and Forecasted Estimates (Till 2035)
- 28.6.2. Solar Vehicle Market in Brazil: Historical Trends (Since 2019) and Forecasted Estimates (Till 2035)
- 28.6.3. Solar Vehicle Market in Chile: Historical Trends (Since 2019) and Forecasted Estimates (Till 2035)
- 28.6.4. Solar Vehicle Market in Colombia Historical Trends (Since 2019) and Forecasted Estimates (Till 2035)
- 28.6.5. Solar Vehicle Market in Venezuela: Historical Trends (Since 2019) and Forecasted Estimates (Till 2035)
- 28.6.6. Solar Vehicle Market in Other Latin American Countries: Historical Trends (Since 2019) and Forecasted Estimates (Till 2035)
- 28.7. Data Triangulation and Validation
29. MARKET OPPORTUNITIES FOR SOLAR VEHICLE IN REST OF THE WORLD
- 29.1. Chapter Overview
- 29.2. Key Assumptions and Methodology
- 29.3. Revenue Shift Analysis
- 29.4. Market Movement Analysis
- 29.5. Penetration-Growth (P-G) Matrix
- 29.6. Solar Vehicle Market in Rest of the World: Historical Trends (Since 2019) and Forecasted Estimates (Till 2035)
- 29.6.1. Solar Vehicle Market in Australia: Historical Trends (Since 2019) and Forecasted Estimates (Till 2035)
- 29.6.2. Solar Vehicle Market in New Zealand: Historical Trends (Since 2019) and Forecasted Estimates (Till 2035)
- 29.6.3. Solar Vehicle Market in Other Countries
- 29.7. Data Triangulation and Validation
30. MARKET CONCENTRATION ANALYSIS: DISTRIBUTION BY LEADING PLAYERS
- 30.1. Leading Player 1
- 30.2. Leading Player 2
- 30.3. Leading Player 3
- 30.4. Leading Player 4
- 30.5. Leading Player 5
- 30.6. Leading Player 6
- 30.7. Leading Player 7
- 30.8. Leading Player 8
31. ADJACENT MARKET ANALYSIS
SECTION VII: STRATEGIC TOOLS
32. KEY WINNING STRATEGIES
33. PORTER'S FIVE FORCES ANALYSIS
34. SWOT ANALYSIS
35. VALUE CHAIN ANALYSIS
36. ROOTS STRATEGIC RECOMMENDATIONS
- 36.1. Chapter Overview
- 36.2. Key Business-related Strategies
- 36.2.1. Research & Development
- 36.2.2. Product Manufacturing
- 36.2.3. Commercialization / Go-to-Market
- 36.2.4. Sales and Marketing
- 36.3. Key Operations-related Strategies
- 36.3.1. Risk Management
- 36.3.2. Workforce
- 36.3.3. Finance
- 36.3.4. Others
SECTION VIII: OTHER EXCLUSIVE INSIGHTS
37. INSIGHTS FROM PRIMARY RESEARCH
38. REPORT CONCLUSION
SECTION IX: APPENDIX
39. TABULATED DATA
40. LIST OF COMPANIES AND ORGANIZATIONS
41. CUSTOMIZATION OPPORTUNITIES
42. ROOTS SUBSCRIPTION SERVICES
43. AUTHOR DETAILS

