
PUBLISHER: Roots Analysis | PRODUCT CODE: 1883719

PUBLISHER: Roots Analysis | PRODUCT CODE: 1883719
Metal and Lipid Nanoparticle Manufacturing Market: Industry Trends and Global Forecasts, Till 2035 - Distribution by Type of Service, Company Size, Type of Nanoparticles Manufactured, Scale of Operation, Type of End User and Key Geographical Regions
Metal and Lipid nanoparticle Manufacturing Market: Overview
As per Roots Analysis, the metal and lipid nanoparticle manufacturing market is estimated to be worth USD 2.1 billion in the current year and is likely to grow at a CAGR of 8.6% during the forecast period, till 2035.
Metal And Lipid Nanoparticle Manufacturing Market
The market sizing and opportunity analysis has been segmented across the following parameters:
Company Size
- Very Small
- Small
- Mid-sized
- Large
Type of Nanoparticle(s) Manufactured
- Lipid Nanoparticle
- Metal Nanoparticle
Scale of Operation
- Preclinical
- Clinical
- Commercial
Type of End-user
- Educational Institutions
- Pharmaceutical Companies
- Research Institutions
- Other End Users
Geographical Regions
- North America
- Europe
- Asia
- Middle East and North Africa
- Latin America
- Rest of the World
Metal and Lipid nanoparticle Manufacturing Market: Growth and Trends
In recent decades, the pharmaceutical sector has experienced considerable growth, as reflected in the steadily increasing pipeline of drug candidates that have been launched or are under development at various development stages. A recent study featured in the journal of Analytical and Pharmaceutical Research has stated that approximately 90% of candidates in the ongoing preclinical development pipeline and over 40% of marketed pharmaceutical drugs are associated with issues concerning solubility / permeability. Additionally, it was observed that a pharmacological product exhibited a 10% decrease in robustness each time it was combined with another product, resulting from drug incompatibility. Consequently, participants in the metal and lipid nanoparticle manufacturing market are actively seeking methods to enhance or supplement the physicochemical attributes and drug-like characteristics of pharmacological products. Among other options, the application of nanoparticles has attracted the interest of numerous pharmaceutical developers. During the COVID-19 pandemic, the newly developed vaccines designed were encapsulated in a layer of lipid nanoparticles helping transport the active components to the intended area of effect. Additionally, numerous drug developers are utilizing lipid / metal nanoparticles to re-engineer current product candidates to enhance their bioavailability / biocompatibility. However, certain nanoparticles used in medical industry have manufacturing processes that are very intricate, costly, and filled with various challenges, including the requirement for specialized knowledge (particularly with lipid nanoparticles), insufficient facilities with the requisite infrastructure, and issues concerning storage and stability. Given the routine operational and technical difficulties, a growing number of pharmaceutical firms have shown a preference for outsourcing their nanoparticle manufacturing processes to specialized service providers.
Metal and Lipid nanoparticle Manufacturing Market: Key Insights
The report delves into the current state of the metal and lipid nanoparticle manufacturing market and identifies potential growth opportunities within industry. Some key findings from the report include:
- At present, more than 50 companies across the globe claim to have the required capabilities to offer a range of services for the development and manufacturing of lipid / metal nanoparticles.
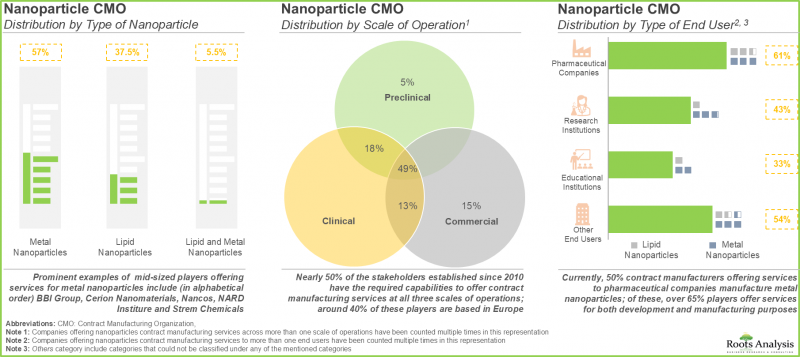
- Several CMOs have the necessary expertise to provide production services for different types of nanoparticles across varied scales of operations; such players cater to the needs of a number of end users.
- Most of the players offering contract services for nanoparticles to different end users are headquartered in North America and Europe; the US and Germany have emerged as the most prominent countries within these regions.
- In order to gain an edge in this competitive industry, nanoparticle contract manufacturers are continuously undertaking initiatives to upgrade their existing service offerings.
- The growing interest is also evident from the rise in partnership activity; a major proportion of the deals were signed by companies based in North America.
- Driven by the rising demand for drugs that can overcome the existing challenges associated with solubility, the nanoparticle contract manufacturing market is estimated to grow at an annualized rate of 8.6%, till 2035.
- The projected market opportunity is likely to be distributed across different scales of operations, company size and key geographical regions.
Metal and Lipid Nanoparticle Manufacturing Market: Key Segments
Large Players Dominate the Metal and Lipid Nanoparticle Manufacturing Market
In terms of company size, the market is segmented across very small, small, mid-sized, and larger players. Currently, the metal and lipid nanoparticle manufacturing market is likely to capture around 40% of the overall market share. Further, the market for mid-sized players is likely to grow at a higher CAGR of 9.78%, during the given time period.
Metal Nanoparticles are Anticipated to Dominate the Metal and Lipid Nanoparticle Manufacturing Market
In terms of nanoparticle manufactured, the market is segmented across lipid and metal nanoparticles. Currently, the metal nanoparticle manufacturing market is likely to capture around 60% of the overall market share. Further, the market for lipid nanoparticles will grow at a higher CAGR of 8.98%, during the given time period.
Commercial Scale is Anticipated to Capture a Higher Metal and Lipid Nanoparticle Manufacturing Market Share
In terms of scale of operation, the market is segmented across preclinical, clinical and commercial segments. Currently, the majority (60%) of the metal nanoparticle manufacturing market is captured by commercial segment. Further, the market for preclinical and clinical segments is likely to grow at a higher CAGR of 9.24%, each during the forecast period.
Pharmaceutical Companies are Likely to Hold Majority of the Metal and Lipid Nanoparticle Manufacturing Market Share
In terms of end-user, the market is segmented across educational institutions, pharmaceutical companies, research institutes, and other end users. Currently, the majority (60%) of the metal nanoparticle manufacturing market is captured by pharmaceutical companies. Further, the market for research institutes is likely to grow at a higher CAGR of 10.27%, during the forecast period.
North America is Anticipated to Hold the Majority of the Metal and Lipid Nanoparticle Manufacturing Market Share
In terms of region, the market is segmented across North America, Europe, Asia, Middle East and North Africa, Latin America and Rest of the World. Currently, the majority (40%) of the metal nanoparticle manufacturing market is captured by pharmaceutical North America. Further, the market in Middle East and North Africa is likely to grow at a higher CAGR of 10.83%, during the forecast period.
Example Players in the Metal and Lipid Nanoparticle Manufacturing Market
- Ardena
- CordenPharma
- Curia
- Evonik
- LSNE Contract Manufacturing
- Polymun
- TechNanoIndia
Metal and Lipid nanoparticle Manufacturing Market: Research Coverage
- Market Sizing and Opportunity Analysis: The report features an in-depth analysis of the metal and lipid nanoparticle manufacturing market, focusing on key market segments, including [A] type of service, [B] company size, [C] type of nanoparticles manufactured, [D] scale of operation, [E] type of end-user [F] geographical regions.
- Market Landscape: provides a detailed assessment of nanoparticle contract manufacturers based on several relevant parameters, such as [A] company size, [B] location of headquarters, [C] type of organization, [D] type of nanoparticle(s) manufactured, [E] location and number of manufacturing facilities, [F] scale of operation, [G] type of end user, [H] type of service(s) offered, [I] quality certifications and [J] regulatory organizations.
- Company Competitiveness Analysis: A comprehensive competitive analysis of nanoparticle contract manufacturers, examining factors, such as [A] service strength and [B] partnership strength.
- Company Profiles: In-depth profiles of prominent players engaged in this domain that offer contract manufacturing services for nanoparticle(s), focusing on [A] year of establishment, [B] location of headquarters, [C] product portfolio, [D] recent developments and [E] an informed future outlook.
- Partnerships and Collaborations An insightful analysis of the partnerships and collaborations inked between stakeholders engaged in the metal and lipid nanoparticle manufacturing market based on various relevant parameters, including [A] year of partnership, [B] type of partnership, [C] type of partner and [D] most active players.
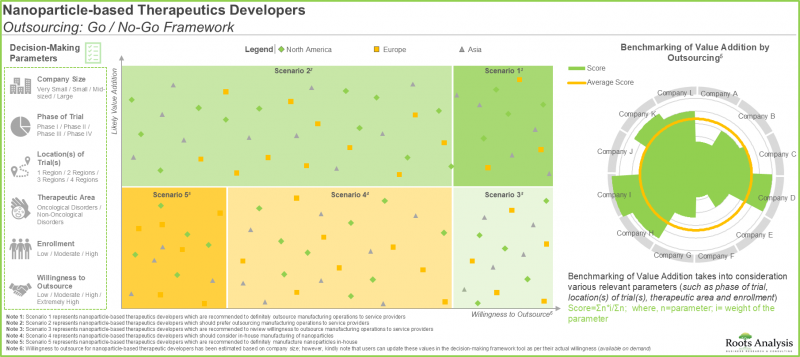
- Outsourcing: Go / No-Go Framework: An insightful analysis that highlights the various factors that need to be taken into consideration by nanoparticle-based therapeutics developers, while deciding whether to manufacture their respective therapeutics in-house or engage the services of a CMOs.
Key Questions Answered in this Report
- How many companies are currently engaged in this market?
- Which are the leading companies in this market?
- What is the current global capacity of developers?
- What factors are likely to influence the evolution of this market?
- What is the current and future market size?
- What is the CAGR of this market?
- How is the current and future market opportunity likely to be distributed across key market segments?
Reasons to Buy this Report
- The report provides a comprehensive market analysis, offering detailed revenue projections of the overall market and its specific sub-segments. This information is valuable to both established market leaders and emerging entrants.
- Stakeholders can leverage the report to gain a deeper understanding of the competitive dynamics within the market. By analyzing the competitive landscape, businesses can make informed decisions to optimize their market positioning and develop effective go-to-market strategies.
- The report offers stakeholders a comprehensive overview of the market, including key drivers, barriers, opportunities, and challenges. This information empowers stakeholders to stay abreast of market trends and make data-driven decisions to capitalize on growth prospects.
Additional Benefits
- Complimentary PPT Insights Packs
- Complimentary Excel Data Packs for all Analytical Modules in the Report
- 15% Free Content Customization
- Detailed Report Walkthrough Session with Research Team
- Free Updated report if the report is 6-12 months old or older
TABLE OF CONTENTS
1. PREFACE
- 1.1. Scope of the Report
- 1.2. Research Methodology
- 1.3. Key Questions Answered
- 1.4. Chapter Outlines
2. EXECUTIVE SUMMARY
3. INTRODUCTION
- 3.1. Chapter Overview
- 3.2. Introduction to Nanoparticles
- 3.2.1. Type of Nanoparticles
- 3.3. Challenges Associated with Manufacturing of Nanoparticles
- 3.4 Overview of Contract Manufacturing
- 3.4.1 Commonly Outsourced Nanoparticle Manufacturing Operations
- 3.5. Advantages of Outsourcing Nanoparticle Manufacturing Operations
- 3.6. Key Considerations while Selecting a Contract Manufacturing Partner
- 3.7. Future Perspective
4. MARKET LANDSCAPE
- 4.1. Chapter Overview
- 4.2. Nanoparticle Contract Manufacturers: Overall Market Landscape
- 4.2.1. Analysis by Year of Establishment
- 4.2.2. Analysis by Company Size
- 4.2.3. Analysis by Location of Headquarters
- 4.2.4. Analysis by Type of Organization
- 4.2.5. Analysis by Type of Nanoparticle(s) Manufactured
- 4.2.6. Analysis by Location of Manufacturing Facilities
- 4.2.7. Analysis by Scale of Operation
- 4.2.8. Analysis by Type of End User
- 4.2.9. Analysis by Type of Service(s) Offered
- 4.2.10. Analysis by Quality Certifications
- 4.2.11. Analysis by Regulatory Organizations
- 4.2.12. Leading Nanoparticle Contract Manufacturers: Analysis by Number of Manufacturing Facilities
5. KEY INSIGHTS
- 5.1. Chapter Overview
- 5.2. Analysis by Company Size and Type of Organization
- 5.3. Analysis by Company Size and Type of Nanoparticle(s) Manufactured
- 5.4. Analysis by Company Size and Scale of Operation
- 5.5. Analysis by Location of Headquarters (Country-wise)
- 5.6. Analysis by Company Size, Type of Nanoparticle(s) Manufactured, Number of Manufacturing Facilities, and Number of Services Offered (4D Bubble Representation)
- 5.7. Analysis by Type of Organization, Type of Nanoparticle(s) Manufactured, Scale of Operation, Type of End User, Type of Service(s) Offered (Grid Representation)
6. COMPANY COMPETITIVENESS ANALYSIS
- 6.1. Chapter Overview
- 6.2. Assumptions and Key Parameters
- 6.3. Methodology
- 6.4. Benchmarking of Service Strength
- 6.5. Benchmarking of Partnership Activity
- 6.6. Nanoparticle Contract Manufacturers: Company Competitiveness Analysis
- 6.6.1. Company Competitiveness Analysis: Very Small Companies
- 6.6.2. Company Competitiveness Analysis: Small Companies
- 6.6.3. Company Competitiveness Analysis: Mid-Sized Companies
- 6.6.4. Company Competitiveness Analysis: Large Companies
7. COMPANY PROFILES
- 7.1. Chapter Overview
- 7.2. Ardena
- 7.2.1. Company Overview
- 7.2.2. Recent Developments and Future Outlook
- 7.3. CordenPharma
- 7.3.1. Company Overview
- 7.3.2. Recent Developments and Future Outlook
- 7.4. Curia
- 7.4.1. Company Overview
- 7.4.2. Recent Developments and Future Outlook
- 7.5. Evonik
- 7.5.1. Company Overview
- 7.5.2. Recent Developments and Future Outlook
- 7.6. LSNE Contract Manufacturing
- 7.6.1. Company Overview
- 7.6.2. Recent Developments and Future Outlook
- 7.7. Polymun
- 7.7.1. Company Overview
- 7.7.2. Recent Developments and Future Outlook
- 7.8. TechNanoIndia
- 7.8.1. Company Overview
- 7.8.2. Recent Developments and Future Outlook
8. PARTNERSHIPS AND COLLABORATIONS
- 8.1. Chapter Overview
- 8.2. Partnership Models
- 8.3. Nanoparticle Contract Manufacturing: Partnerships and Collaborations
- 8.3.1. Analysis by Year of Partnership
- 8.3.2. Analysis by Type of Partnership
- 8.3.3. Analysis by Type of Partner
- 8.3.4. Analysis by Type of Nanoparticle(s) Manufactured
- 8.3.5. Emerging Focus Areas
- 8.3.6. Most Active Players: Analysis by Number of Partnerships
- 8.3.7. Analysis by Geography
- 8.3.7.1. Region-wise Distribution
- 8.3.7.2. Country-wise Distribution
- 8.8. Concluding Remarks
9. OUTSOURCING: GO / NO-GO FRAMEWORK
- 9.1. Chapter Overview
- 9.2. Outsourcing: Go / No-Go Framework
- 9.3. Nanoparticle-based Therapeutics Developers Outsourcing: Go / No-Go Framework
- 9.3.1. Assumptions and Parameter Definitions
- 9.3.2. Methodology
- 9.3.3. Results and Interpretations
- 9.3.3.1. Very Small Companies
9. 3.3.2. Small Companies
9. 3.3.3. Mid-Sized Companies
9. 3.3.4. Large Companies
9. 3.3.4. Very Large Companies
10. MARKET FORECAST AND OPPORTUNITY ANALYSIS
- 10.1. Chapter Overview
- 10.2. Forecast Methodology and Key Assumptions
- 10.3. Global Nanoparticle Contract Manufacturing Market, Till 2035
- 10.4. Nanoparticle Contract Manufacturing Market: Distribution by Company Size
- 10.4.1. Nanoparticle Contract Manufacturing Market for Very Small Companies, Till 2035
- 10.4.2. Nanoparticle Contract Manufacturing Market for Small Companies, Till 2035
- 10.4.3. Nanoparticle Contract Manufacturing Market for Mid-Sized Companies, Till 2035
- 10.4.4. Nanoparticle Contract Manufacturing Market for Large Companies, Till 2035
- 10.5. Nanoparticle Contract Manufacturing Market: Distribution by Type of Nanoparticle(s) Manufactured
- 10.5.1. Nanoparticle Contract Manufacturing Market for Lipid Nanoparticles, Till 2035
- 10.5.2. Nanoparticle Contract Manufacturing Market for Metal Nanoparticles, Till 2035
- 10.6. Nanoparticle Contract Manufacturing Market: Distribution by Scale of Operation
- 10.6.1. Nanoparticle Contract Manufacturing Market for Preclinical Scale Operations, Till 2035
- 10.6.2. Nanoparticle Contract Manufacturing Market for Clinical Scale Operations, Till 2035
- 10.6.3. Nanoparticle Contract Manufacturing Market for Commercial Scale Operations, Till 2035
- 10.7. Nanoparticle Contract Manufacturing Market: Distribution by Type of End User
- 10.7.1. Nanoparticle Contract Manufacturing Market for Educational Institutions, Till 2035
- 10.7.2. Nanoparticle Contract Manufacturing Market for Pharmaceutical Companies, Till 2035
- 10.7.3. Nanoparticle Contract Manufacturing Market for Research Institutions, Till 2035
- 10.7.4. Nanoparticle Contract Manufacturing Market for Other End Users, Till 2035
- 10.8. Nanoparticle Contract Manufacturing Market: Distribution by Region
- 10.8.1. Nanoparticle Contract Manufacturing Market in North America, Till 2035
- 10.8.2. Nanoparticle Contract Manufacturing Market in Europe, Till 2035
- 10.8.3. Nanoparticle Contract Manufacturing Market in Asia, Till 2035
- 10.8.4. Nanoparticle Contract Manufacturing Market in MENA, Till 2035
- 10.8.5. Nanoparticle Contract Manufacturing Market in Latin America, Till 2035
- 10.8.6. Nanoparticle Contract Manufacturing Market in Rest of the World, Till 2035
- 10.9. Nanoparticle Contract Manufacturing Market: Distribution by Type of Nanoparticle and Region
- 10.9.1. Nanoparticle Contract Manufacturing Market for Lipid Nanoparticles in North America, Till 2035
- 10.9.2. Nanoparticle Contract Manufacturing Market for Lipid Nanoparticles in Europe, Till 2035
- 10.9.3. Nanoparticle Contract Manufacturing Market for Lipid Nanoparticles in Asia, Till 2035
- 10.9.4. Nanoparticle Contract Manufacturing Market for Lipid Nanoparticles in MENA, Till 2035
- 10.9.5. Nanoparticle Contract Manufacturing Market for Lipid Nanoparticles in Latin America, Till 2035
- 10.9.6. Nanoparticle Contract Manufacturing Market for Lipid Nanoparticles in Rest of the World, Till 2035
- 10.9.7. Nanoparticle Contract Manufacturing Market for Metal Nanoparticles in North America, Till 2035
- 10.9.8. Nanoparticle Contract Manufacturing Market for Metal Nanoparticles in Europe, Till 2035
- 10.9.9. Nanoparticle Contract Manufacturing Market for Metal Nanoparticles in Asia, Till 2035
- 10.9.10. Nanoparticle Contract Manufacturing Market for Metal Nanoparticles in MENA, Till 2035
- 10.9.11. Nanoparticle Contract Manufacturing Market for Metal Nanoparticles in Latin America, Till 2035
- 10.9.12. Nanoparticle Contract Manufacturing Market for Metal Nanoparticles in Rest of the World, Till 2035
- 10.10. Concluding Remarks
11. CONCLUDING REMARKS
- 11.1. Chapter Overview
12. EXECUTIVE INSIGHTS
13. APPENDIX I: TABULATED DATA
14. APPENDIX II: LIST OF COMPANIES AND ORGANIZATION
List of Tables
- Table 4.1 Nanoparticle Contract Manufacturers: List of Companies
- Table 4.2 Nanoparticle Contract Manufacturers: Information on Type of Organization and Type of Nanoparticle(s) Manufactured
- Table 4.3 Nanoparticle Contract Manufacturers: Information on Location of Manufacturing Facility
- Table 4.4 Nanoparticle Contract Manufacturers: Information on Scale of Operation
- Table 4.5 Nanoparticle Contract Manufacturers: Information on Type of End User
- Table 4.6 Nanoparticle Contract Manufacturers: Information on Type of Service(s) Offered
- Table 4.7 Nanoparticle Contract Manufacturers: Information on Quality Certifications and Regulatory Bodies
- Table 6.1 Company Competitiveness Analysis: Benchmarking of Service Strength
- Table 6.2 Company Competitiveness Analysis: Benchmarking of Partnership Strength
- Table 6.3 Company Competitiveness Analysis: List of Very Small Players
- Table 6.3 Company Competitiveness Analysis: List of Small Players
- Table 6.3 Company Competitiveness Analysis: List of Mid-Sized Players
- Table 6.3 Company Competitiveness Analysis: List of Large Players
- Table 7.1 Nanoparticle Contract Manufacturers: List of Companies Profiled
- Table 7.2 Ardena: Company Snapshot
- Table 7.3 Ardena: Recent Developments and Future Outlook
- Table 7.4 CordenPharma: Company Snapshot
- Table 7.5 CordenPharma: Recent Developments and Future Outlook
- Table 7.6 Curia: Company Snapshot
- Table 7.7 Curia: Recent Developments and Future Outlook
- Table 7.8 Evonik: Company Snapshot
- Table 7.9 Evonik: Recent Developments and Future Outlook
- Table 7.10 LSNE Contract Manufacturing: Company Snapshot
- Table 7.11 LSNE Contract Manufacturing: Recent Developments and Future Outlook
- Table 7.12 Polymun: Company Snapshot
- Table 7.13 Polymun: Recent Developments and Future Outlook
- Table 7.14 TeachNanoIndia: Company Snapshot
- Table 8.1 Nanoparticle Contract Manufacturers: List of Collaborations, Since 2015
- Table 8.2 Nanoparticle Contract Manufacturers: Partnerships and Collaborations, Information on Type of Agreement (Region-wise and Geography-wise) and Designation of Stakeholder
- Table 12.1: LIPOSOMA: Company Snapshot
- Table 13.1 Nanoparticle Contract Manufactures: Cumulative Distribution by Year of Establishment
- Table 13.2 Nanoparticle Contract Manufactures: Distribution by Company Size
- Table 13.3 Nanoparticle Contract Manufactures: Distribution by Location of Headquarters
- Table 13.4 Nanoparticle Contract Manufactures: Distribution by Company Size and Location of Headquarters
- Table 13.5 Nanoparticle Contract Manufactures: Distribution by Type of Organization
- Table 13.6 Nanoparticle Contract Manufactures: Distribution by Type of Nanoparticle(s) Manufactured
- Table 13.7 Nanoparticle Contract Manufactures: Distribution by Location of Headquarters and Type of Nanoparticle(s) Manufactured
- Table 13.8 Nanoparticle Contract Manufactures: Distribution by Type of Organization and Type of Nanoparticle(s) Manufactured
- Table 13.9 Nanoparticle Contract Manufactures: Distribution by Location of Manufacturing Facility
- Table 13.10 Nanoparticle Contract Manufactures: Distribution by Location of Manufacturing Facility (Country-wise)
- Table 13.11 Nanoparticle Contract Manufactures: Distribution by Scale of Operation
- Table 13.12 Nanoparticle Contract Manufactures: Distribution by Type of Organization and Scale of Operation
- Table 13.13 Nanoparticle Contract Manufactures: Distribution by Type of Nanoparticle(s) Manufactured and Scale of Operation
- Table 13.14 Nanoparticle Contract Manufactures: Distribution by Type of End User
- Table 13.15 Nanoparticle Contract Manufactures: Distribution by Type of Nanoparticle(s) Manufactured and Type of End User
- Table 13.16 Nanoparticle Contract Manufactures: Distribution by Type of Service(s) Offered
- Table 13.17 Nanoparticle Contract Manufactures: Distribution by Type of Organization and Type of End User
- Table 13.18 Nanoparticle Contract Manufactures: Distribution by Type of Nanoparticle(s) Manufactured and Type of Service(s) Offered
- Table 13.19 Nanoparticle Contract Manufactures: Distribution by Quality Certifications
- Table 13.20 Nanoparticle Contract Manufactures: Distribution by Regulatory Bodies
- Table 13.21 Leading Nanoparticle Contract Manufacturers: Distribution by Number of Manufacturing Facilities
- Table 13.22 Key Insights: Distribution by Company Size and Type of Organization
- Table 13.23 Key Insights: Distribution by Company Size and Type of Nanoparticle(s) Manufactured
- Table 13.24 Key Insights: Distribution by Company Size and Scale of Operation
- Table 13.25 Key Insights: Distribution by Location of Headquarters (Country-wise)
- Table 13.26 4D Bubble Representation: Distribution by Number of Manufacturing Facilities, Number of Services Offered, Company Size, and Type of Nanoparticle(s) Manufactured,
- Table 13.27 Grid Representation: Distribution by Type of Organization, Type of Nanoparticle(s) Manufactured, Scale of Operation, Type of End User, and Type of Service(s) Offered
- Table 13.28 Partnerships and Collaborations: Cumulative Year-wise Trend, Since 2015
- Table 13.29 Partnerships and Collaborations: Distribution by Type of Partnership
- Table 13.30 Partnerships and Collaborations: Cumulative Year-wise Trend by Type of Partnership
- Table 13.31 Partnerships and Collaborations: Distribution by Type of Partner
- Table 13.32 Partnerships and Collaborations: Year-wise Distribution by Type of Partner
- Table 13.33 Partnerships and Collaborations: Cumulative Distribution by Type of Partnership and Type of Partner
- Table 13.34 Partnerships and Collaborations: Type of Partner and Company Size
- Table 13.35 Partnerships and Collaborations: Distribution by Type of Partner, Company Size and Location of Headquarters
- Table 13.36 Partnerships and Collaborations: Distribution by Type of Nanoparticle(s) Manufactured
- Table 13.37 Partnerships and Collaborations: Distribution by Type of Partnership and Type of Nanoparticle(s) Manufactured
- Table 13.38 Partnerships and Collaborations: Partnerships and Collaborations: Distribution by Location of Partner and Type of Nanoparticle(s) Manufactured
- Table 13.39 Most Active Players: Distribution by Number of Partnerships
- Table 13.40 Partnerships and Collaborations: Region-wise Distribution
- Table 13.41 Partnerships and Collaborations: Country-wise Distribution
- Table 13.42 Partnerships and Collaborations: Concluding Remarks
- Table 13.43 Global Nanoparticle Contract Manufacturing Market, Conservative, Base and Optimistic Scenarios, Till 2035 (USD Million)
- Table 13.44 Nanoparticle Contract Manufacturing Market: Distribution by Company Size
- Table 13.45 Nanoparticle Contract Manufacturing Market for Very Small Companies, Conservative, Base and Optimistic Scenarios, Till 2035 (USD Million)
- Table 13.46 Nanoparticle Contract Manufacturing Market for Small Companies, Conservative, Base and Optimistic Scenarios, Till 2035 (USD Million)
- Table 13.47 Nanoparticle Contract Manufacturing Market for Mid-Sized Companies, Conservative, Base and Optimistic Scenarios, Till 2035 (USD Million)
- Table 13.48 Nanoparticle Contract Manufacturing Market for Large Companies, Conservative, Base and Optimistic Scenarios, Till 2035 (USD Million)
- Table 13.49 Nanoparticle Contract Manufacturing Market: Distribution by Type of Nanoparticle(s) Manufactured
- Table 13.50 Nanoparticle Contract Manufacturing Market for Lipid Nanoparticles, Conservative, Base and Optimistic Scenarios, Till 2035 (USD Million)
- Table 13.51 Nanoparticle Contract Manufacturing Market for Metal Nanoparticles, Conservative, Base and Optimistic Scenarios, Till 2035 (USD Million)
- Table 13.52 Nanoparticle Contract Manufacturing Market: Distribution by Scale of Operation
- Table 13.53 Nanoparticle Contract Manufacturing Market for Preclinical Scale Operations, Conservative, Base and Optimistic Scenarios, Till 2035 (USD Million)
- Table 13.54 Nanoparticle Contract Manufacturing Market for Clinical Scale Operations, Conservative, Base and Optimistic Scenarios, Till 2035 (USD Million)
- Table 13.55 Nanoparticle Contract Manufacturing Market for Commercial Scale Operations, Conservative, Base and Optimistic Scenarios, Till 2035 (USD Million)
- Table 13.56 Nanoparticle Contract Manufacturing Market: Distribution by Type of End User
- Table 13.57 Nanoparticle Contract Manufacturing Market for Educational Institutions, Conservative, Base and Optimistic Scenarios, Till 2035 (USD Million)
- Table 13.58 Nanoparticle Contract Manufacturing Market for Pharmaceutical Companies, Conservative, Base and Optimistic Scenarios, Till 2035 (USD Million)
- Table 13.59 Nanoparticle Contract Manufacturing Market for Research Institutions, Conservative, Base and Optimistic Scenarios, Till 2035 (USD Million)
- Table 13.60 Nanoparticle Contract Manufacturing Market for Other End Users, Conservative, Base and Optimistic Scenarios, Till 2035 (USD Million)
- Table 13.61 Nanoparticle Contract Manufacturing Market: Distribution by Region
- Table 13.62 Nanoparticle Contract Manufacturing Market in North America, Conservative, Base and Optimistic Scenarios, Till 2035 (USD Million)
- Table 13.63 Nanoparticle Contract Manufacturing Market in Europe, Conservative, Base and Optimistic Scenarios, Till 2035 (USD Million)
- Table 13.64 Nanoparticle Contract Manufacturing Market in Asia, Conservative, Base and Optimistic Scenarios, Till 2035 (USD Million)
- Table 13.65 Nanoparticle Contract Manufacturing Market in MENA, Conservative, Base and Optimistic Scenarios, Till 2035 (USD Million)
- Table 13.66 Nanoparticle Contract Manufacturing Market in Latin America, Conservative, Base and Optimistic Scenarios, Till 2035 (USD Million)
- Table 13.67 Nanoparticle Contract Manufacturing Market in Rest of the World, Conservative, Base and Optimistic Scenarios, Till 2035 (USD Million)
- Table 13.68 Nanoparticle Contract Manufacturing Market: Distribution by Type of Nanoparticle(s) Manufactured and Region
- Table 13.69 Nanoparticle Contract Manufacturing Market for Lipid Nanoparticles in North America, Conservative, Base and Optimistic Scenarios, Till 2035 (USD Million)
- Table 13.70 Nanoparticle Contract Manufacturing Market for Lipid Nanoparticles in Europe, Conservative, Base and Optimistic Scenarios, Till 2035 (USD Million)
- Table 13.71 Nanoparticle Contract Manufacturing Market for Lipid Nanoparticles in Asia, Conservative, Base and Optimistic Scenarios, Till 2035 (USD Million)
- Table 13.72 Nanoparticle Contract Manufacturing Market for Lipid Nanoparticles in MENA, Conservative, Base and Optimistic Scenarios, Till 2035 (USD Million)
- Table 13.73 Nanoparticle Contract Manufacturing Market for Lipid Nanoparticles in Latin America, Conservative, Base and Optimistic Scenarios, Till 2035 (USD Million)
- Table 13.74 Nanoparticle Contract Manufacturing Market for Lipid Nanoparticles in Rest of the World, Conservative, Base and Optimistic Scenarios, Till 2035 (USD Million)
- Table 13.75 Nanoparticle Contract Manufacturing Market for Metal Nanoparticles in North America, Conservative, Base and Optimistic Scenarios, Till 2035 (USD Million)
- Table 13.76 Nanoparticle Contract Manufacturing Market for Metal Nanoparticles in Europe, Conservative, Base and Optimistic Scenarios, Till 2035 (USD Million)
- Table 13.77 Nanoparticle Contract Manufacturing Market for Metal Nanoparticles in Asia, Conservative, Base and Optimistic Scenarios, Till 2035 (USD Million)
- Table 13.78 Nanoparticle Contract Manufacturing Market for Metal Nanoparticles in MENA, Conservative, Base and Optimistic Scenarios, Till 2035 (USD Million)
- Table 13.79 Nanoparticle Contract Manufacturing Market for Metal Nanoparticles in Latin America, Conservative, Base and Optimistic Scenarios, Till 2035 (USD Million)
- Table 13.80 Nanoparticle Contract Manufacturing Market for Metal Nanoparticles in Rest of the World, Till 2035 (USD Million)
- Table 13.81 Nanoparticle Contract Manufacturing Market, Conservative, Base and Optimistic Scenarios (USD Million)
List of Figures
- Figure 2.1 Executive Summary: Market Landscape
- Figure 2.2 Executive Summary: Partnerships and Collaborations
- Figure 2.3 Executive Summary: Market Forecast
- Figure 3.1 Application of Nanoparticles in Healthcare
- Figure 3.2 Type of Nanoparticles: Based on Source of Material
- Figure 3.3 Challenges Associated with Manufacturing of Nanoparticles
- Figure 3.4 Type of the Third- Party Service Providers
- Figure 3.5 Commonly Outsourced Nanoparticle Manufacturing Operations
- Figure 4.1 Nanoparticle Contract Manufactures: Distribution by Year of Establishment
- Figure 4.2 Nanoparticle Contract Manufactures: Distribution by Company Size
- Figure 4.3 Nanoparticle Contract Manufactures: Distribution by Location of Headquarters
- Figure 4.4 Nanoparticle Contract Manufactures: Distribution by Company Size and Location of Headquarters
- Figure 4.5 Nanoparticle Contract Manufactures: Distribution by Type of Organization
- Figure 4.6 Nanoparticle Contract Manufactures: Distribution by Type of Nanoparticle(s) Manufactured
- Figure 4.7 Nanoparticle Contract Manufactures: Distribution by Location of Headquarters and Type of Nanoparticle(s) Manufactured
- Figure 4.8 Nanoparticle Contract Manufactures: Distribution by Type of Organization and Type of Nanoparticle(s) Manufactured
- Figure 4.9 Nanoparticle Contract Manufactures: Distribution by Location of Manufacturing Facility
- Figure 4.10 Nanoparticle Contract Manufactures: Distribution by Location of Manufacturing Facility (Country-wise)
- Figure 4.11 Nanoparticle Contract Manufactures: Distribution by Scale of Operation
- Figure 4.12 Nanoparticle Contract Manufactures: Distribution by Type of Organization and Scale of Operation
- Figure 4.13 Nanoparticle Contract Manufactures: Distribution by Type of Nanoparticle(s) Manufactured and Scale of Operation
- Figure 4.14 Nanoparticle Contract Manufactures: Distribution by Type of End User
- Figure 4.15 Nanoparticle Contract Manufactures: Distribution by Type of Nanoparticle(s) Manufactured and Type of End User
- Figure 4.16 Nanoparticle Contract Manufactures: Distribution by Type of Service(s) Offered
- Figure 4.17 Nanoparticle Contract Manufactures: Distribution by Type of Organization and Type of End User
- Figure 4.18 Nanoparticle Contract Manufactures: Distribution by Type of Nanoparticle(s) Manufactured and Type of Service(s) Offered
- Figure 4.19 Nanoparticle Contract Manufactures: Distribution by Quality Certifications
- Figure 4.20 Nanoparticle Contract Manufactures: Distribution by Regulatory Bodies
- Figure 4.21 Leading Nanoparticle Contract Manufacturers: Distribution by Number of Manufacturing Facilities
- Figure 5.1 Key Insights: Distribution by Company Size and Type of Organization
- Figure 5.2 Key Insights: Distribution by Company Size and Type of Nanoparticle(s) Manufactured
- Figure 5.3 Key Insights: Distribution by Company Size and Scale of Operation
- Figure 5.4 Key Insights: Distribution by Location of Headquarters (Country-wise)
- Figure 5.5 4D Bubble Representation: Distribution by Number of Manufacturing Facilities, Number of Service(s) Offered, Company Size, and Type of Nanoparticle(s) Manufactured
- Figure 5.6 Grid Representation: Distribution by Type of Organization, Type of Nanoparticle(s) Manufactured, Scale of Operation, Type of End User, and Type of Service(s) Offered
- Figure 6.1 Nanoparticle Contract Manufacturers: Benchmarking of Service Strength
- Figure 6.2 Nanoparticle Contract Manufacturers: Benchmarking of Partnership Activity
- Figure 6.3 Company Competitiveness Analysis: Very Small Companies
- Figure 6.4 Company Competitiveness Analysis: Small Companies
- Figure 6.5 Company Competitiveness Analysis: Mid-sized Companies
- Figure 6.6 Company Competitiveness Analysis: Large Companies
- Figure 8.1 Partnerships and Collaborations: Cumulative Year-wise Trend, Since 2015
- Figure 8.2 Partnerships and Collaborations: Distribution by Type of Partnership
- Figure 8.3 Partnerships and Collaborations: Year-wise Cumulative Distribution by Type of Partnership
- Figure 8.4 Partnerships and Collaborations: Distribution by Type of Partner
- Figure 8.5 Partnerships and Collaborations: Year-wise Distribution by Type of Partner
- Figure 8.6 Partnerships and Collaborations: Distribution by Type of Partnership and Type of Partner
- Figure 8.7 Partnerships and Collaborations: Distribution by Type of Partner and Company Size
- Figure 8.8 Partnerships and Collaborations: Distribution by Type of Partner, Company Size and Location of Headquarters
- Figure 8.9 Partnerships and Collaborations: Distribution by Type of Nanoparticle(s) Manufactured
- Figure 8.10 Partnerships and Collaborations: Distribution by Type of Partnership and Type of Nanoparticle(s) Manufactured
- Figure 8.11 Partnerships and Collaborations: Distribution by Location of Partner and Type of Nanoparticle(s) Manufactured
- Figure 8.12 Partnerships and Collaborations: Emerging Focus Area
- Figure 8.13 Most Active Players: Distribution by Number of Partnerships
- Figure 8.14 Partnerships and Collaboration: Region-wise Distribution
- Figure 8.15 Partnerships and Collaborations: Country-wise Distribution
- Figure 8.15 Partnerships and Collaboration: Concluding Remarks
- Figure 9.1 Outsourcing: Go / No-Go Framework
- Figure 9.2 Outsourcing: Go / No-Go Framework Methodology
- Figure 9.3 Outsourcing: Go / No-Go Framework for Nanoparticle-based Therapeutic Developers
- Figure 9.4 Nanoparticle-based Therapeutic Developers: Benchmarking of Very Small Companies
- Figure 9.5 Nanoparticle-based Therapeutic Developers: Benchmarking of Small Companies
- Figure 9.6 Nanoparticle-based Therapeutic Developers: Benchmarking of Mid-sized Companies
- Figure 9.7 Nanoparticle-based Therapeutic Developers: Benchmarking of Large Companies
- Figure 9.8 Nanoparticle-based Therapeutic Developers: Benchmarking of Very Large Companies
- Figure 10.1 Global Nanoparticle Contract Manufacturing Market, Till 2035 (USD Million)
- Figure 10.2 Nanoparticle Contract Manufacturing Market: Distribution by Company Size
- Figure 10.3 Nanoparticle Contract Manufacturing Market for Very Small Companies, Till 2035 (USD Million)
- Figure 10.4 Nanoparticle Contract Manufacturing Market for Small Companies, Till 2035 (USD Million)
- Figure 10.5 Nanoparticle Contract Manufacturing Market for Mid-Sized Companies, Till 2035 (USD Million)
- Figure 10.6 Nanoparticle Contract Manufacturing Market for Large Companies, Till 2035 (USD Million)
- Figure 10.7 Nanoparticle Contract Manufacturing Market: Distribution by Type of Nanoparticle(s) Manufactured
- Figure 10.8 Nanoparticle Contract Manufacturing Market for Lipid Nanoparticles, Till 2035 (USD Million)
- Figure 10.9 Nanoparticle Contract Manufacturing Market for Metal Nanoparticles, Till 2035 (USD Million)
- Figure 10.10 Nanoparticle Contract Manufacturing Market: Distribution by Scale of Operation,
- Figure 10.11 Nanoparticle Contract Manufacturing Market for Preclinical Scale Operations, Till 2035 (USD Million)
- Figure 10.12 Nanoparticle Contract Manufacturing Market for Clinical Scale Operations, Till 2035 (USD Million)
- Figure 10.13 Nanoparticle Contract Manufacturing Market for Commercial Scale Operations, Till 2035 (USD Million)
- Figure 10.14 Nanoparticle Contract Manufacturing Market: Distribution by Type of End User
- Figure 10.15 Nanoparticle Contract Manufacturing Market for Educational Institutions, Till 2035 (USD Million)
- Figure 10.16 Nanoparticle Contract Manufacturing Market for Pharmaceutical Companies, Till 2035 (USD Million)
- Figure 10.17 Nanoparticle Contract Manufacturing Market for Research Institutions, Till 2035 (USD Million)
- Figure 10.18 Nanoparticle Contract Manufacturing Market for Other End Users, Till 2035 (USD Million)
- Figure 10.19 Nanoparticle Contract Manufacturing Market: Distribution by Region
- Figure 10.20 Nanoparticle Contract Manufacturing Market in North America, Till 2035 (USD Million)
- Figure 10.21 Nanoparticle Contract Manufacturing Market in Europe, Till 2035 (USD Million)
- Figure 10.22 Nanoparticle Contract Manufacturing Market in Asia, Till 2035 (USD Million)
- Figure 10.23 Nanoparticle Contract Manufacturing Market in MENA, Till 2035 (USD Million)
- Figure 10.24 Nanoparticle Contract Manufacturing Market in Latin America, Till 2035 (USD Million)
- Figure 10.25 Nanoparticle Contract Manufacturing Market in Rest of the World, Till 2035 (USD Million)
- Figure 10.26 Nanoparticle Contract Manufacturing Market for Lipid Nanoparticles in North America, Till 2035 (USD Million)
- Figure 10.27 Nanoparticle Contract Manufacturing Market for Lipid Nanoparticles in Europe, Till 2035 (USD Million)
- Figure 10.28 Nanoparticle Contract Manufacturing Market for Lipid Nanoparticles in Asia, Till 2035 (USD Million)
- Figure 10.29 Nanoparticle Contract Manufacturing Market for Lipid Nanoparticles in MENA, Till 2035 (USD Million)
- Figure 10.30 Nanoparticle Contract Manufacturing Market for Lipid Nanoparticles in Latin America, Till 2035 (USD Million)
- Figure 10.31 Nanoparticle Contract Manufacturing Market for Lipid Nanoparticles in Rest of the World, Till 2035 (USD Million)
- Figure 10.32 Nanoparticle Contract Manufacturing Market for Metal Nanoparticles in North America, Till 2035 (USD Million)
- Figure 10.33 Nanoparticle Contract Manufacturing Market for Metal Nanoparticles in Europe, Till 2035 (USD Million)
- Figure 10.34 Nanoparticle Contract Manufacturing Market for Metal Nanoparticles in Asia, Till 2035 (USD Million)
- Figure 10.35 Nanoparticle Contract Manufacturing Market for Metal Nanoparticles in MENA, Till 2035 (USD Million)
- Figure 10.36 Nanoparticle Contract Manufacturing Market for Metal Nanoparticles in Latin America, Till 2035 (USD Million)
- Figure 10.37 Nanoparticle Contract Manufacturing Market for Metal Nanoparticles in Rest of the World, Till 2035 (USD Million)
- Figure 10.38 Nanoparticle Contract Manufacturing Market, Conservative, Base and Optimistic Scenarios(USD Million)
- Figure 11.1 Concluding Remarks: Current Market Landscape
- Figure 11.2 Concluding Remarks: Key Insights
- Figure 11.3 Concluding Remarks: Company Competitiveness Analysis: Small Companies
- Figure 11.4 Concluding Remarks: Partnerships and Collaborations
- Figure 11.5 Concluding Remarks: Outsourcing: Go / No-Go Framework
- Figure 11.6 Concluding Remarks: Market Sizing and Opportunity Analysis
- Figure 11.7 Concluding Remarks: Market Sizing and Opportunity Analysis

