
PUBLISHER: Roots Analysis | PRODUCT CODE: 1883720

PUBLISHER: Roots Analysis | PRODUCT CODE: 1883720
Peptide Therapeutics Market: Industry Trends and Global Forecasts, Till 2040 - Distribution by Type of Peptide, Route of Administration, Key Therapeutic Area and Geographical Regions
PEPTIDE THERAPEUTICS MARKET: OVERVIEW
As per Roots Analysis, the peptide therapeutics market is estimated to grow from USD 84.2 billion in the current year to USD 162.4 billion by 2035, at a CAGR of 6.8% during the forecast period, till 2035.
Peptide Therapeutics Market
The market sizing and opportunity analysis has been segmented across the following parameters:
Route of Administration
- Intravenous
- Oral
- Subcutaneous
- Topical
- Other
Key Therapeutic Area
- Metabolic Diseases
- Oncological Diseases
- Endocrine Diseases
- Digestive and Gastrointestinal Diseases
- Others
Geographical Regions
- North America
- Europe
- Asia-Pacific
- Rest of the World
Peptide Therapeutics Market: Growth and Trends
Peptide therapeutics are a class of medications developed with polypeptides to cater to various illnesses. Generally, naturally occurring peptides can serve as growth factors, hormones, neurotransmitters, anti-infectives, and ligands for ion channels. Such peptides have been utilized in creating peptide-based therapies that are commonly employed in treating metabolic diseases, cancer, and hormone-related treatments. It is noteworthy that more than 100 peptide-based therapies have been authorized by the FDA in various nations. Examples of recognized peptide therapeutics include Tirzepatide (Mounjaro(R)), Lutetium Lu-177 vipivotide tetraxetan (Pluvicto(R)), and Lupkynis(TM). Driven by the rising prevalence of chronic conditions, such as diabetes, osteoarthritis, obesity, autoimmune disorders, rheumatoid arthritis, and cancer, an increased demand for biologics in disease treatment has been observed in recent years.
Biologics such as recombinant proteins and peptides present multiple benefits, including heightened target specificity, good safety profiles, low toxicity, and reduced likelihood of off-target effects. Notably, many pharmaceutical firms are focusing on the advancement of innovative drug conjugates, including peptide drug conjugates, peptide therapeutics, and cell-penetrating peptides to address a wide array of diseases. Moreover, recent progress in this area has resulted in the authorization and clinical application of peptide medications for disorders such as type 2 diabetes, obesity, and several cancers. We are led to believe that the market is likely to achieve notable growth in the foreseeable future.
Peptide Therapeutics Market: Key Insights
The report delves into the current state of the peptide therapeutics market and identifies potential growth opportunities within industry. Some key findings from the report include:
- With 25 approved drugs and over 280 candidates under development, peptide therapeutics currently represent one of the fastest growing drug classes, capable of treating a diverse range of diseases.
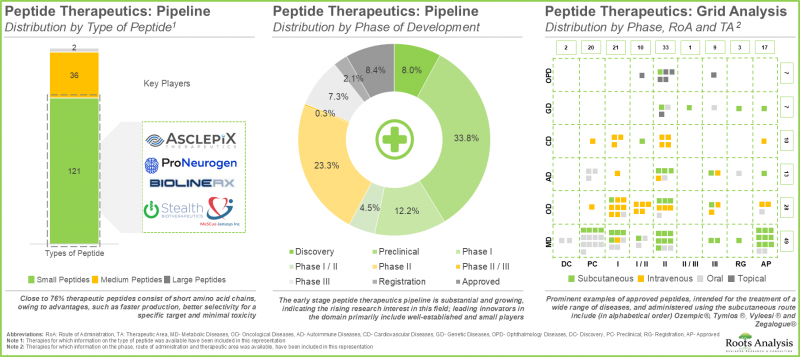
- The pipeline features a variety of peptides being evaluated for delivery via different routes, and mostly intended for treating metabolic and oncological disorders
- In lieu of the growing competition from several viable candidate therapies, innovators are putting in significant efforts to ensure that their proprietary offerings are both clinically and commercially differentiated.
- Over 1,200 peptide focused clinical trials have been registered across the world; presently, most of these studies are evaluating product candidates intended for the treatment of metabolic diseases.
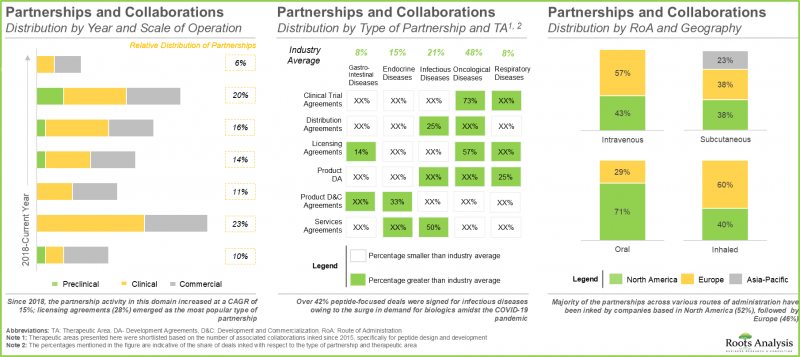
- The growing interest in this field is also evident in the increase in recent partnership activity; majority of the deals were focused on technology and / or product licensing.
- Foreseeing promising returns, many public and private sector investors have invested over USD 7 billion, across more than 200 instances.
- In order to tap into the lucrative opportunity in this rapidly growing market, several big pharma players have undertaken initiatives, ranging from proprietary product development to strategic investments, in this direction.
- With a promising development pipeline and encouraging clinical outcomes, the peptide therapeutics market is anticipated to grow at an annualized rate of 6.8%, over the next decade.
Peptide Therapeutics Market: Key Segments
Medium Size Peptides in the Peptide Therapeutics Industry Holds the Largest Share
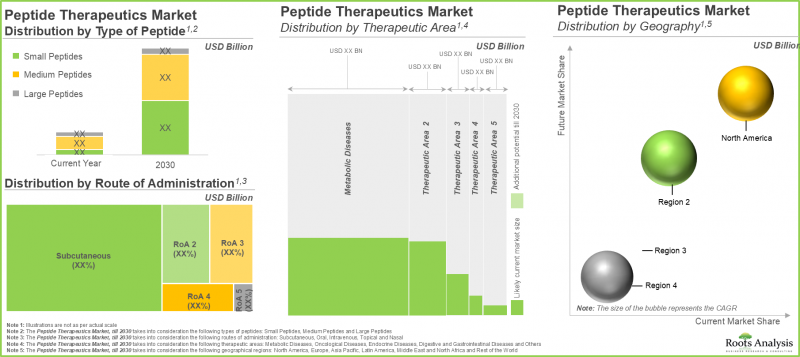
In the current year, medium sized peptides capture the majority (close to 65% of the market) share. This is probably because medium-sized peptides (ranging from 10 to 40 amino acids) effectively strike a balance between larger proteins and smaller molecules. It is worth highlighting that, small peptides will grow at a CAGR of more than 20% during the forecast period, owing to the increasing usage in manufacturing target specific drugs.
Subcutaneous Route of Administration to Dominate the Peptide Therapeutics Market
The overall market is segmented into intravenous, oral, subcutaneous, topical, and others. In the current year, subcutaneous route of administration accounts for more than 65% of the overall market. The subcutaneous route can avoid the gastrointestinal tract and liver (first-pass metabolism), resulting in greater therapeutic effectiveness. Owing to the ongoing demand for non-invasive or target specific routes of administration, the topical route of administration is likely to grow at a CAGR of ~30% during the forecast period.
Metabolic Diseases Segment to Hold the Highest Peptide Therapeutics Market
Currently, the metabolic diseases segment is likely to capture more than 60% of the overall market share. This is attributed to the increasing need for peptide-based therapies aimed at addressing metabolic conditions like diabetes and obesity. Notably, the peptide therapeutics market for gastrointestinal diseases will expand with a higher CAGR of 25% during the forecast period.
North America to Propel in the Peptide Therapeutics Industry in the Coming Years
This segment highlights the distribution of market across various geographies, such as North America, Europe and Asia-Pacific. According to our projections, North America accounts for the majority of the market share in the current year, and this trend is unlikely to change in the future. According to the report of Centers for Disease Control and Prevention, nearly 129 million people in the United States have at least one or more chronic disease such as diabetes, obesity, heart disease, and hypertension. This is leading to growing demand for peptide therapeutics in this region. It is worth highlighting that the market in Asia-Pacific is likely to grow at a relatively higher CAGR during the forecast period.
Example Players in the Peptide Therapeutics Market
- Apellis Pharmaceuticals
- BioLineRx
- Eli Lilly
- FirstString Research
- Novo Nordisk
- Palatin Technologies
- RegeneRx Biopharmaceuticals
- Stealth BioTherapeutics
- Takeda
- Zealand Pharma
Peptide Therapeutics Market: Research Coverage
- Market Sizing and Opportunity Analysis: The report features an in-depth analysis of the peptide therapeutics market, focusing on key market segments, including [A] type of peptide, [B] route of administration, [C] key therapeutic area, [D] geographical regions.
- Market Landscape: provides a detailed assessment of over 300 peptide-based therapies that are currently approved or are in different stages of development, based on several relevant parameters, such as [A] phase of development, [B] type of peptide, [C] route of administration, [D] key therapeutic areas, [E] year of establishment, [F] company size, and [G] location of headquarters.
- Company Profiles: In-depth profiles of prominent players engaged in this domain, focusing on [A] year of establishment, [B] location of headquarters, [C] peptide details [D] recent developments and [E] an informed future outlook.
- Big Pharma Initiatives: An analysis of top big biopharma players engaged in the field of therapeutic peptides, based on several parameters, including [A] number of amino acids, [B] route of administration and [C] therapeutic area.
- Partnerships and Collaborations An insightful analysis of the partnerships and collaborations inked between stakeholders engaged in the peptide therapeutics market based on various relevant parameters, including [A] year of partnership, [B] type of partnership, [C] type of partner and [D] most active players.
- Funding and Investment Analysis: A comprehensive examination of various funding and investments raised by developers of peptide therapeutics, based on relevant parameters, including [A] such as year of funding, [B] amount invested [C] type of funding, [D] regional distribution, and [E] most active players.
- Clinical Trial Analysis: A detailed review of completed, ongoing, and planned clinical studies of various therapeutic peptides, based on relevant parameters, such as [A] trail registration year, [B] phase of development, [C] current trial status and [D] enrolled patient population.
- Case Study 1: A case study focused on the role of service providers that operate within the peptide therapeutics market and captures information on the various CROs, CMOs and custom peptide manufacturers that are actively involved in this segment of the peptide therapeutics market.
- Case Study 2: A case study presenting the key characteristics of novel peptides drugs, along with information on the applications, advantages and key challenges involved in their development processes.
Key Questions Answered in this Report
- How many companies are currently engaged in this market?
- Which are the leading companies in this market?
- What is the current global capacity of developers?
- What factors are likely to influence the evolution of this market?
- What is the current and future market size?
- What is the CAGR of this market?
- How is the current and future market opportunity likely to be distributed across key market segments?
Reasons to Buy this Report
- The report provides a comprehensive market analysis, offering detailed revenue projections of the overall market and its specific sub-segments. This information is valuable to both established market leaders and emerging entrants.
- Stakeholders can leverage the report to gain a deeper understanding of the competitive dynamics within the market. By analyzing the competitive landscape, businesses can make informed decisions to optimize their market positioning and develop effective go-to-market strategies.
- The report offers stakeholders a comprehensive overview of the market, including key drivers, barriers, opportunities, and challenges. This information empowers stakeholders to stay abreast of market trends and make data-driven decisions to capitalize on growth prospects.
Additional Benefits
- Complimentary PPT Insights Packs
- Complimentary Excel Data Packs for all Analytical Modules in the Report
- 15% Free Content Customization
- Detailed Report Walkthrough Session with Research Team
- Free Updated report if the report is 6-12 months old or older
TABLE OF CONTENTS
1. PREFACE
- 1.1. Scope of the Report
- 1.2. Research Methodology
- 1.3. Key Questions Answered
- 1.4. Chapter Outlines
2. EXECUTIVE SUMMARY
3. INTRODUCTION
- 3.1. Chapter Overview
- 3.2. Structure of Peptides
- 3.3. Classification of Peptides
- 3.4. Modification of Peptides
- 3.4.1. N-Terminal Modifications
- 3.4.2. Internal Modifications
- 3.4.3. C-Terminal Modifications
- 3.4.4. Other Modifications
- 3.5. Evolution of Peptide Therapeutics
- 3.6. Design and Development of Peptide Therapeutics
- 3.6.1. Traditional versus Novel Peptide Technologies
- 3.7. Advantages and Disadvantages of Peptide Therapeutics
- 3.8. Applications of Peptide Therapeutics
- 3.9. Future Perspectives
4. MARKET OVERVIEW
- 4.1. Chapter Overview
4.2. Peptide Therapeutics: Overall Market Overview
- 4.2.1. Analysis by Phase of Development
- 4.2.2. Analysis by Type of Peptide
- 4.2.3. Analysis by Route of Administration
- 4.2.4. Analysis by Phase of Development and Route of Administration
- 4.2.5. Analysis by Therapeutic Area
- 4.2.6. Analysis by Phase of Development and Therapeutic Area
- 4.2.7. Analysis by Route of Administration and Therapeutic Area
- 4.2.8. Analysis by Phase of Development, Route of Administration and Therapeutic Area (Grid Representation)
5. COMPETITIVE LANDSCAPE
- 5.1. Chapter Overview
- 5.2. Peptide Therapeutics: List of Developers
- 5.2.1. Analysis by Year of Establishment
- 5.2.2. Analysis by Company Size
- 5.2.3. Analysis by Geography
- 5.2.4. Analysis by Phase of Development and Geography (Logo Landscape)
- 5.2.5.Key Players: Analysis by Number of Product Candidates
- 5.3.Analysis by Company Size, Key Therapeutic Area and Geography (Heat Map Representation)
6. COMPANY PROFILES
- 6.1. Chapter Overview
- 6.2. Apellis Pharmaceuticals
- 6.2.1. Company Overview
- 6.2.2 Pipeline Details
- 6.2.2. Recent Developments and Future Outlook
- 6.3. BioLineRx
- 6.3.1. Company Overview
- 6.3.2. Pipeline Details
- 6.3.3. Recent Developments and Future Outlook
- 6.4. Eli Lilly
- 6.4.1. Company Overview
- 6.4.2. Financial Information
- 6.4.3. Pipeline Details
- 6.4.4. Recent Developments and Future Outlook
- 6.5. FirstString Research
- 6.5.1. Company Overview
- 6.5.2. Pipeline Details
- 6.5.3. Recent Developments and Future Outlook
- 6.6. Novo Nordisk
- 6.6.1. Company Overview
- 6.6.2. Financial Information
- 6.6.3. Pipeline Details
- 6.6.4. Recent Developments and Future Outlook
- 6.7. Palatin Technologies
- 6.7.1. Company Overview
- 6.7.2. Financial Information
- 6.7.3. Pipeline Details
- 6.7.4. Recent Developments and Future Outlook
- 6.8. RegeneRx Biopharmaceuticals
- 6.8.1. Company Overview
- 6.8.2. Pipeline Details
- 6.8.3. Recent Developments and Future Outlook
- 6.9. Stealth BioTherapeutics
- 6.9.1. Company Overview
- 6.9.2. Pipeline Details
- 6.9.3. Recent Developments and Future Outlook
- 6.10. Takeda
- 6.10.1. Company Overview
- 6.10.2. Financial Information
- 6.10.3. Pipeline Details
- 6.10.4. Recent Developments and Future Outlook
- 6.11. Zealand Pharma
- 6.11.1. Company Overview
- 6.11.2. Financial Information
- 6.11.3. Pipeline Details
- 6.11.4. Recent Developments and Future Outlook
7. PEPTIDE THERAPEUTICS FOCUSED INITIATIVES OF BIG PHARMA PLAYERS
- 7.1. Chapter Overview
- 7.2. Top Pharmaceutical Companies: Peptide Therapeutics Focused Initiatives
- 7.2.1. Analysis by Number of Amino Acids
- 7.2.2. Analysis by Route of Administration
- 7.2.3. Analysis by Therapeutic Area
- 7.3. Benchmark Analysis of Key Parameters
- 7.3.1. Spider Web Analysis: Pipeline Strength
- 7.3.2. Spider Web Analysis: Partnerships and Collaborations
- 7.3.3. Spider Web Analysis: Funding and Investments
- 7.3.4. Spider Web Analysis: Clinical Trials
- 7.4. Benchmark Analysis of Big Pharmaceutical Players
- 7.4.1. Spider Web Analysis: Novo Nordisk
- 7.4.2. Spider Web Analysis: Amgen
- 7.4.3. Spider Web Analysis: Takeda
- 7.4.4. Spider Web Analysis: Eli Lilly
- 7.4.5. Spider Web Analysis: Johnson and Johnson
8. PARTNERSHIPS AND COLLABORATIONS
- 8.1. Chapter Overview
- 8.2. Partnership Models
- 8.3. Peptide Therapeutics: List of Partnerships and Collaborations
- 8.3.1. Analysis by Year of Partnership
- 8.3.2. Analysis by Type of Partnership
- 8.3.3. Analysis by Year and Type of Partnership
- 8.3.4. Analysis by Focus Area
- 8.3.5. Analysis by Type of Partnership and Focus Area
- 8.3.6. Analysis by Type of Peptide
- 8.3.7. Analysis by Route of Administration
- 8.3.8. Analysis by Route of Administration and Geography
- 8.3.9. Analysis by Type of Partnership and Phase of Development
- 8.3.10. Analysis by Therapeutic Area
- 8.3.11. Analysis by Type of Partnership and Therapeutic Area
- 8.4. Most Active Players: Analysis by Number of Partnerships
- 8.5. Regional Analysis
- 8.5.1. Intracontinental and Intercontinental Agreements
- 8.5.2. Local and International Agreements
9. FUNDING AND INVESTMENT ANALYSIS
- 9.1. Chapter Overview
- 9.2. Types of Funding
- 9.3. Peptide Therapeutics: Funding and Investment Analysis
- 9.3.1. Analysis by Number of Funding Instances
- 9.3.2. Analysis by Amount Invested
- 9.3.3. Analysis by Type of Funding
- 9.3.4. Analysis by Year and Type of Funding
- 9.3.5. Analysis of Amount Invested by Geography
- 9.3.6. Most Active Players: Analysis by Number of Funding Instances and Amount Invested
- 9.3.7. Key Investors: Analysis by Number of Funding Instances
- 9.3.8. Analysis by Phase of Development
- 9.3.9. Analysis by Therapeutic Area
10. CLINICAL TRIAL ANALYSIS
- 10.1. Chapter Overview
- 10.2. Scope and Methodology
- 10.3. Peptide Therapeutics: Clinical Trial Analysis
- 10.3.1. Analysis by Trial Registration Year
- 10.3.2. Analysis by Trial Status
- 10.3.3. Analysis by Trial Phase
- 10.3.4. Analysis by Trial Recruitment Status
- 10.3.5. Analysis by Trial Registration Year and Enrolled Patient Population
- 10.3.6. Analysis by Study Design
- 10.3.7. Analysis by Type of Sponsor / Collaborator
- 10.3.8. Most Active Players: Analysis by Number of Registered Trials
- 10.3.9. Emerging Focus Area
- 10.3.10. Analysis by Therapeutic Area
- 10.3.11. Geographical Analysis by Number of Registered Trials
- 10.3.12. Geographical Analysis by Enrolled Patient Population
11. CLINICAL AND COMMERCIAL ATTRACTIVENESS ANALYSIS
- 11.1. Chapter Overview
- 11.2. Methodology
- 11.2.1. Assumptions and Key Parameters
- 11.3. Affiliated Insights
- 11.3.1. Clinical and Commercial Attractiveness Analysis: Autoimmune Diseases
- 11.3.2. Clinical and Commercial Attractiveness Analysis: Central Nervous System (CNS) Diseases
- 11.3.3. Clinical and Commercial Attractiveness Analysis: Endocrine Diseases
- 11.3.4. Clinical and Commercial Attractiveness Analysis: Gastrointestinal Diseases
- 11.3.5. Clinical and Commercial Attractiveness Analysis: Genetic Diseases
- 11.3.6. Clinical and Commercial Attractiveness Analysis: Hematological Diseases
- 11.3.7. Clinical and Commercial Attractiveness Analysis: Infectious Diseases
- 11.3.8. Clinical and Commercial Attractiveness Analysis: Inflammatory Diseases
- 11.3.9. Clinical and Commercial Attractiveness Analysis: Metabolic Diseases
- 11.3.10. Clinical and Commercial Attractiveness Analysis: Oncological Diseases
- 11.3.11. Clinical and Commercial Attractiveness Analysis: Ophthalmic Diseases
- 11.3.12. Clinical and Commercial Attractiveness Analysis: Other Diseases
12. CASE STUDY: CONTRACT SERVICES LANDSCAPE
- 12.1. Chapter Overview
- 12.1.1. Chapter Overview
- 12.2. Role of Service Providers
- 12.2.1. List of Peptide CROs
- 12.2.2. List of Platform Providers
- 12.2.3. List of Peptide CMOs
- 12.2.3.1. List of Custom Peptide Manufacturers
- 12.3. Advantages of Outsourcing
- 12.4. Risks and Challenges Associated with Outsourcing
13. CASE STUDY: NOVEL PEPTIDE THERAPEUTICS
- 13.1. Chapter Overview
- 13.2. Overview of Novel Peptide Therapeutics
- 13.3. Advantages and Applications of Novel Peptide Therapeutics
- 13.4. Key Challenges Associated with Novel Peptide Therapeutics
14. MARKET FORECAST AND OPPORTUNITY ANALYSIS
- 14.1. Chapter Overview
- 14.2. Scope and Limitations
- 14.3. Key Assumptions and Forecast Methodology
- 14.4. Global Peptide Therapeutics Market, till 2030
- 14.4.1. Global Peptide Therapeutics Market, till 2030: Distribution by Type of Peptide
- 14.4.2. Peptide Therapeutics Market, till 2030: Distribution by Number of Amino Acids
- 14.4.3. Peptide Therapeutics Market, till 2030: Distribution by Route of Administration
- 14.4.4. Peptide Therapeutics Market, till 2030: Distribution by Geography
- 14.4.5. Peptide Therapeutics Market, till 2030: Distribution by Key Therapeutic Area
- 14.5. Autoimmune Diseases
- 14.5.1. Value Creation Analysis
- 14.5.2. Sales Forecast for Approved Peptide Therapeutics
- 14.5.2.1. Tymlos (R)
- 14.5.3. Sales Forecast for Clinical Peptide Therapeutics
- 14.5.3.1. Ampion / DMI 9523
- 14.5.3.2. TBRIA
- 14.6. Cardiovascular Diseases
- 14.6.1. Value Creation Analysis
- 14.6.2. Sales Forecast for Approved Peptide Therapeutics
- 14.6.2.1. Giapreza (R)
- 14.7. CNS Diseases
- 14.7.1. Value Creation Analysis
- 14.7.2. Sales Forecast for Clinical Peptide Therapeutics
- 14.7.2.1. Nerinitide
- 14.7.2.2. Rybelsus (R)
- 14.8. Dermatological Diseases
- 14.8.1. Value Creation Analysis
- 14.8.2. Sales Forecast for Approved Peptide Therapeutics
- 14.8.2.1. Melgain
- 14.9. Endocrine Diseases
- 14.9.1. Value Creation Analysis
- 14.9.2. Sales Forecast for Approved Peptide Therapeutics
- 14.9.2.1. Parsabiv (R)
- 14.9.2.2. Lupykins
- 14.9.3. Sales Forecast for Clinical Peptide Therapeutics
- 14.9.3.1. Difelikefalin / KORSUVA / Oral CR845
- 14.10. Gastrointestinal Diseases
- 14.10.1. Value Creation Analysis
- 14.10.2. Sales Forecast for Approved Peptide Therapeutics
- 14.10.2.1. Gattex (R)
- 14.10.2.2. Trulance (R)
- 14.10.3. Sales Forecast for Clinical Peptide Therapeutics
- 14.10.3.1. Glepaglutide / ZP1848
- 14.10.3.2. Larazotide / INN-202
- 14.11. Genetic Diseases
- 14.11.1. Value Creation Analysis
- 14.11.2. Sales Forecast for Approved Peptide Therapeutics
- 14.11.2.1. Scenesse (R)
- 14.11.3. Sales Forecast for Clinical Peptide Therapeutics
- 14.11.3.1. Elamipretide / MTP-131
- 14.11.3.2. Ninlaro (R)
- 14.11.3.3. Vosoritide / BMN 111
- 14.11.3.4. Zilucoplan / RA101495
- 14.12. Hematological Diseases
- 14.12.1. Value Creation Analysis
- 14.12.2. Sales Forecast for Clinical Peptide Therapeutics
- 14.12.2.1. Pegcetacoplan / APL-2
- 14.13. Infectious Diseases
- 14.13.1. Value Creation Analysis
- 14.13.2. Sales Forecast for Approved Peptide Therapeutics
- 14.13.2.1. Solnatide
- 14.13.3. Sales Forecast for Clinical Peptide Therapeutics
- 14.13.3.1. Aikening / Albuvirtide
- 14.13.3.2. Reltecimod
- 14.14. Inflammatory Diseases
- 14.14.1. Value Creation Analysis
- 14.14.2. Sales Forecast for Clinical Peptide Therapeutics
- 14.14.2.1. Lupuzor
- 14.15. Metabolic Diseases
- 14.15.1. Value Creation Analysis
- 14.15.2. Sales Forecast for Approved Peptide Therapeutics
- 14.15.2.1. Adlyxin (R)
- 14.15.2.6. Imcivree (TM)
- 14.15.2.3. Mycapssa (R)
- 14.15.2.5. Ozempic (R)
- 14.15.2.4. Rybelsus (R)
- 14.15.2.7. Tanzeum (R)
- 14.15.2.8. Tresiba (R)
- 14.15.2.2. Trulicity (R)
- 14.15.2.10. Zegalogue (R)
- 14.15.3. Sales Forecast for Clinical Peptide Therapeutics
- 14.15.3.1. Imcivree (TM)
- 14.15.3.2. Ozempic
- 14.15.3.3. Tirzepatide / LY3298176
- 14.16. Oncological Diseases
- 14.16.1. Value Creation Analysis
- 14.16.2. Sales Forecast for Approved Peptide Therapeutics
- 14.16.2.1. Aplidin (R)
- 14.16.2.2. Lupron (R)
- 14.16.2.3. Lutathera (R)
- 14.16.2.4. Ninlaro (R)
- 14.16.3. Sales Forecast for Clinical Peptide Therapeutics
- 14.16.3.1. Balixafortide / POL6326
- 14.16.3.2. Dusquetide / SGX942
- 14.16.3.3. Motixafortide / BL-8040
- 14.17. Ophthalmic Diseases
- 14.17.1. Value Creation Analysis
- 14.17.2. Sales Forecast for Clinical Peptide Therapeutics
- 14.17.2.1. RGN-259 / GBT-201
- 14.17.2.2. Pegcetacoplan / APL-2
- 14.17.2.3. XG-102
- 14.19. Other Diseases
- 14.19.1. Value Creation Analysis
- 14.19.2. Sales Forecast for Approved Peptide Therapeutics
- 14.19.2.1. Lupron (R)
- 14.19.2.2. Vyleesi (TM)
- 14.19.2.3. Xylentra (TM)
- 14.19.3. Sales Forecast for Clinical Peptide Therapeutics
- 14.19.3.1. BP-101
- 14.19.3.2. Granexin
- 14.19.3.3. Ensereptide / PXL01
15. CONCLUDING REMARKS
- 15.1. Chapter Overview
16. APPENDIX I: LIST OF APPROVED PEPTIDE THERAPEUTICS
17. APPENDIX II: TABULATED DATA
18. APPENDIX III: LIST OF COMPANIES AND ORGANIZATIONS
List of Tables
- Table 4.1 Peptide Therapeutics: Development Pipeline
- Table 5.1 Peptide Therapeutics: List of Drug Developers
- Table 6.1 Apellis Pharmaceuticals: Key Highlights
- Table 6.2 Apellis Pharmaceuticals: Peptide-based Drugs Portfolio
- Table 6.3 Apellis Pharmaceuticals: Recent Developments and Future Outlook
- Table 6.4 BioLineRx: Key Highlights
- Table 6.5 BioLineRx: Peptide-based Drugs Portfolio
- Table 6.6 Eli Lilly: Key Highlights
- Table 6.7 Eli Lilly: Peptide-based Drugs Portfolio
- Table 6.8 FirstString Research: Key Highlights
- Table 6.9 FirstString Research: Peptide-based Drugs Portfolio
- Table 6.10 Novo Nordisk: Key Highlights
- Table 6.11 Novo Nordisk: Peptide-based Drugs Portfolio
- Table 6.12 Novo Nordisk: Recent Developments and Future Outlook
- Table 6.13 Palatin Technologies: Key Highlights
- Table 6.14 Palatin Technologies: Peptide-based Drugs Portfolio
- Table 6.15 RegeneRx Biopharmaceuticals: Key Highlights
- Table 6.16 RegeneRx Biopharmaceuticals: Peptide-based Drugs Portfolio
- Table 6.17 RegeneRx Biopharmaceuticals: Recent Developments and Future Outlook
- Table 6.18 Stealth BioTherapeutics: Key Highlights
- Table 6.19 Stealth BioTherapeutics: Peptide-based Drugs Portfolio
- Table 6.20 Stealth BioTherapeutics: Recent Developments and Future Outlook
- Table 6.21 Takeda: Key Highlights
- Table 6.22 Takeda: Peptide-based Drugs Portfolio
- Table 6.23 Zealand Pharma: Key Highlights
- Table 6.24 Zealand Pharma: Peptide-based Drugs Portfolio
- Table 6.25 Zealand Pharma: Recent Developments and Future Outlook
- Table 7.1 Partnerships and Collaborations: List of Peptide Therapeutics Initiatives Undertaken by Big Pharma Players
- Table 8.1 Peptide Therapeutics: List of Partnerships and Collaborations, since 2015
- Table 9.1 Peptide Therapeutics: List of Funding and Investments, since 2015
- Table 9.2 Funding and Investment Analysis: Summary of Investments
- Table 9.3 Funding and Investment Analysis: Summary of Venture Capital Funding
- Table 12.1 Peptides and Macrocycle Drug Discovery: List of Service Providers
- Table 12.2 Peptides and Macrocycle Drug Discovery Platform Providers: Information on Types of Peptide Discovered
- Table 12.3 Peptide Therapeutics: List of Contract Peptide API Manufacturers
- Table 12.4 Peptide Therapeutics: List of Custom Peptide Manufacturers
- Table 13.1 Peptide Therapeutics: List of Novel Peptide Therapeutics
- Table 14.1 Value Creation Analysis: Information on Approved and Clinical Stage Peptide Therapeutics for Autoimmune Diseases
- Table 14.2 Value Creation Analysis: Information on Approved and Clinical Stage Peptide Therapeutics for Cardiovascular Diseases
- Table 14.3 Value Creation Analysis: Information on Clinical Stage Peptide Therapeutics for CNS Diseases
- Table 14.4 Value Creation Analysis: Information on Approved Peptide Therapeutics for Dermatological Diseases
- Table 14.5 Value Creation Analysis: Information on Approved and Clinical Stage Peptide Therapeutics for Endocrine Diseases
- Table 14.6 Value Creation Analysis: Information on Approved and Clinical Stage Peptide Therapeutics for Gastrointestinal Diseases
- Table 14.7 Value Creation Analysis: Information on Approved and Clinical Stage Peptide Therapeutics for Genetic Diseases
- Table 14.8 Value Creation Analysis: Information on Clinical Stage Peptide Therapeutics for Hematological Diseases
- Table 14.9 Value Creation Analysis: Information on Clinical Stage Peptide Therapeutics for Infectious Diseases
- Table 14.10 Value Creation Analysis: Information on Clinical Stage Peptide Therapeutics for Inflammatory Diseases
- Table 14.11 Value Creation Analysis: Information on Approved and Clinical Stage Peptide Therapeutics for Metabolic Diseases
- Table 14.12 Value Creation Analysis: Information on Approved and Clinical Stage Peptide Therapeutics for Oncological Diseases
- Table 14.13 Value Creation Analysis: Information on Clinical Stage Peptide Therapeutics for Ophthalmic Diseases
- Table 14.14 Value Creation Analysis: Information on Approved and Clinical Stage Peptide for Other Diseases
- Table 17.1 Peptide Therapeutics: Distribution by Phase of Development
- Table 17.2 Peptide Therapeutics: Distribution by Type of Peptide
- Table 17.3 Peptide Therapeutics: Distribution by Route of Administration
- Table 17.4 Peptide Therapeutics: Distribution by Phase of Development and Route of Administration
- Table 17.5 Peptide Therapeutics: Distribution by Therapeutic Area
- Table 17.6 Peptide Therapeutics: Distribution by Phase of Development and Therapeutic Area
- Table 17.7 Peptide Therapeutics: Distribution by Route of Administration and Key Therapeutic Area
- Table 17.8 Peptide Therapeutics Developers: Distribution by Year of Establishment
- Table 17.9 Peptide Therapeutics Developers: Distribution by Company Size
- Table 17.10 Peptide Therapeutics Developers: Distribution by Geography
- Table 17.11 Peptide Therapeutics Developers: Key Players
- Table 17.12 Peptide Therapeutics Developers: Distribution by Key Players and Phase of
- Table 17.13 Eli Lilly: Annual Revenues, FY 2015 Onwards (USD Million)
- Table 17.14 Novo Nordisk: Annual Revenues, FY 2015 Onwards (DKK Million)
- Table 17.15 Palatin Technologies: Annual Revenues, FY 2015 Onwards (USD Million)
- Table 17.16 Takeda: Annual Revenues, FY 2015 Onwards (JPY Million)
- Table 17.17 Zealand Pharma: Annual Revenues, FY 2015 Onwards (DKK Million)
- Table 17.18 Partnerships and Collaborations: Distribution by Year and Type of Partnership
- Table 17.19 Partnerships and Collaborations: Distribution by Year of Partnership
- Table 17.20 Partnerships and Collaborations: Distribution by Type of Partnership
- Table 17.21 Partnerships and Collaborations: Distribution by Year and Type of Partnership
- Table 17.22 Partnerships and Collaborations: Distribution by Focus Area
- Table 17.23 Partnerships and Collaborations: Distribution by Type of Partnership and Focus Area
- Table 17.24 Partnerships and Collaborations: Distribution by Type of Peptide
- Table 17.25 Partnerships and Collaborations: Distribution by Route of Administration
- Table 17.26 Partnerships and Collaborations: Distribution by Route of Administration and Geography
- Table 17.27 Partnerships and Collaborations: Distribution by Type of Partnership and Phase of Development
- Table 17.28 Partnerships and Collaborations: Distribution by Therapeutic Area
- Table 17.29 Partnerships and Collaborations: Distribution by Type of Partnership and Therapeutic Area
- Table 17.30 Most Active Players: Distribution by Number of Partnerships
- Table 17.31 Partnerships and Collaborations: Intracontinental and Intercontinental Agreements
- Table 17.32 Partnerships and Collaborations: Local and International Agreements
- Table 17.33 Funding and Investment Analysis: Cumulative Year-wise Distribution by Number of Instances
- Table 17.34 Funding and Investment Analysis: Cumulative Year-wise Distribution of Amount Invested, since 2015 (USD Million)
- Table 17.35 Funding and Investment Analysis: Distribution of Instances by Type of Funding, since 2015
- Table 17.36 Funding and Investment Analysis: Distribution of Total Amount Invested by Type of Funding, since 2015 (USD Million)
- Table 17.37 Funding and Investment Analysis: Distribution by Year and Type of Funding, since 2015
- Table 17.38 Funding and Investment Analysis: Summary of Investments, since 2015 (USD Million)
- Table 17.39 Funding and Investment Analysis: Distribution by Geography
- Table 17.40 Funding and Investment Analysis: Regional Distribution of Funding Instances
- Table 17.41 Most Active Players: Distribution by Number of Funding Instances
- Table 17.42 Most Active Players: Distribution by Amount Invested (USD Million)
- Table 17.43 Funding and Investment Analysis: Distribution by Type of Investors
- Table 17.44 Funding and Investment Analysis: Distribution by Leading Investors
- Table 17.45 Funding and Investment Analysis: Distribution of Instances by Phase of Development
- Table 17.46 Funding and Investment Analysis: Distribution by Therapeutic Area
- Table 17.47 Clinical Trial Analysis: Cumulative Distribution by Trial Registration Year
- Table 17.48 Clinical Trial Analysis: Distribution by Trial Status
- Table 17.49 Clinical Trial Analysis: Distribution by Trial Phase
- Table 17.50 Clinical Trial Analysis: Distribution by Trial Registration Year and Trial Recruitment Status
- Table 17.51 Clinical Trial Analysis: Distribution of Enrolled Patient Population by Trial Registration Year,
- Table 17.52 Clinical Trial Analysis: Distribution by Study Design
- Table 17.53 Clinical Trial Analysis: Distribution by Type of Sponsor / Collaborator
- Table 17.54 Most Active Players: Distribution by Number of Registered Trials
- Table 17.55 Clinical Trial Analysis: Distribution by Therapeutic Area
- Table 17.56 Clinical Trial Analysis: Geographical Distribution by Number of Registered Trials
- Table 17.57 Clinical Trial Analysis: Geographical Distribution by Enrolled Patient Population
- Table 17.58 Global Peptide Therapeutics Market, till 2030 (USD Billion)
- Table 17.59 Peptide Therapeutics Market: Distribution by Type of Peptide, till 2030
- Table 17.60 Peptide Therapeutics Market: Distribution by Route of Administration, till 2030
- Table 17.61 Peptide Therapeutics Market: Distribution by Geography, till 2030
- Table 17.62 Peptide Therapeutics Market: Distribution by Therapeutic Area, till 2030
- Table 17.63 Peptide Therapeutics Market for Autoimmune Diseases, till 2030 (USD Billion)
- Table 17.64 Peptide Therapeutics Market for Cardiovascular Diseases, till 2030 (USD Billion)
- Table 17.65 Peptide Therapeutics Market for CNS Diseases, till 2030 (USD Billion)
- Table 17.66 Peptide Therapeutics Market for Dermatological Diseases, till 2030 (USD Billion)
- Table 17.67 Peptide Therapeutics Market for Endocrine Diseases, till 2030 (USD Billion)
- Table 17.68 Peptide Therapeutics Market for Gastrointestinal Diseases, till 2030 (USD Billion)
- Table 17.69 Peptide Therapeutics Market for Genetic Diseases, till 2030 (USD Billion)
- Table 17.70 Peptide Therapeutics Market for Hematological Diseases, till 2030 (USD Billion)
- Table 17.71 Peptide Therapeutics Market for Infectious Diseases, till 2030 (USD Billion)
- Table 17.72 Peptide Therapeutics Market for Inflammatory Diseases, till 2030 (USD Billion)
- Table 17.73 Peptide Therapeutics Market for Metabolic Diseases, till 2030 (USD Billion)
- Table 17.74 Peptide Therapeutics Market for Oncological Diseases, till 2030 (USD Billion)
- Table 17.75 Peptide Therapeutics Market for Ophthalmic Diseases, till 2030 (USD Billion)
- Table 17.76 Peptide Therapeutics Market for Other Diseases, till 2030 (USD Billion)
List of Figures
- Figure 3.1 Peptide Modification Techniques
- Figure 3.2 Historical Timeline of Peptide Therapeutics
- Figure 4.1 Peptide Therapeutics: Distribution by Phase of Development
- Figure 4.2 Peptide Therapeutics: Distribution by Type of Peptide
- Figure 4.3 Peptide Therapeutics: Distribution by Route of Administration
- Figure 4.4 Peptide Therapeutics: Distribution by Phase of Development and Route of Administration
- Figure 4.5 Peptide Therapeutics: Distribution by Therapeutic Area
- Figure 4.6 Peptide Therapeutics: Distribution by Phase of Development and Therapeutic Area
- Figure 4.7 Peptide Therapeutics: Distribution by Route of Administration and Key Therapeutic Area
- Figure 4.8 Grid Representation: Distribution by Phase of Development, Route of Administration and Key Therapeutic Area
- Figure 5.1 Peptide Therapeutics Developers: Distribution by Year of Establishment
- Figure 5.2 Peptide Therapeutics Developers: Distribution by Company Size
- Figure 5.3 Peptide Therapeutics Developers: Distribution by Geography
- Figure 5.4 Regional Landscape: Distribution of Peptide Therapeutics Developers by Phase of Development and Geography
- Figure 5.5 Peptide Therapeutics Developers: Key Players
- Figure 5.6 Peptide Therapeutics Developers: Distribution by Key Players and Phase of Development
- Figure 5.7 Heat Map Representation: Distribution by Company Size, Key Therapeutic Area and Geography
- Figure 6.1 Eli Lilly: Annual Revenues, FY 2015 Onwards (USD Million)
- Figure 6.2 Novo Nordisk: Annual Revenues, FY 2015 Onwards (DKK Million)
- Figure 6.3 Palatin Technologies: Annual Revenues, FY 2015 Onwards (USD Million)
- Figure 6.4 Takeda: Annual Revenues, FY 2015 Onwards (JPY Million)
- Figure 6.5 Zealand Pharma: Annual Revenues, FY 2015 Onwards (DKK Million)
- Figure 7.1 Harvey Ball Analysis: Big Pharma Investment Summary
- Figure 7.2 Big Pharma Players: Distribution by Number of Amino Acids
- Figure 7.3 Big Pharma Players: Distribution by Route of Administration
- Figure 7.4 Big Pharma Players: Distribution by Therapeutic Area
- Figure 7.5 Spider Web Analysis: Pipeline Strength
- Figure 7.6 Spider Web Analysis: Partnerships and Collaborations
- Figure 7.7 Partnerships and Collaborations: Distribution by Year and Type of Partnership Undertaken by Big Pharma Players
- Figure 7.8 Spider Web Analysis: Funding and Investments
- Figure 7.9 Spider Web Analysis: Clinical Trials
- Figure 7.10 Spider Web Analysis: Novo Nordisk
- Figure 7.11 Spider Web Analysis: Amgen
- Figure 7.12 Spider Web Analysis: Takeda
- Figure 7.13 Spider Web Analysis: Eli Lilly
- Figure 7.14 Spider Web Analysis: Johnson and Johnson
- Figure 8.1 Partnerships and Collaborations: Distribution by Year of Partnership
- Figure 8.2 Partnerships and Collaborations: Distribution by Type of Partnership
- Figure 8.3 Partnerships and Collaborations: Distribution by Year and Type of Partnership
- Figure 8.4 Partnerships and Collaborations: Distribution by Focus Area
- Figure 8.5 Partnerships and Collaborations: Distribution by Type of Partnership and Focus Area
- Figure 8.6 Partnerships and Collaborations: Distribution by Type of Peptide
- Figure 8.7 Partnerships and Collaborations: Distribution by Route of Administration
- Figure 8.8 Partnerships and Collaborations: Distribution by Route of Administration and Geography
- Figure 8.9 Partnerships and Collaborations: Distribution by Type of Partnership and Phase of Development
- Figure 8.10 Partnerships and Collaborations: Distribution by Therapeutic Area
- Figure 8.11 Partnerships and Collaborations: Distribution by Type of Partnership and Therapeutic Area
- Figure 8.12 Most Active Players: Distribution by Number of Partnerships
- Figure 8.13 Partnerships and Collaborations: Intracontinental and Intercontinental Agreements
- Figure 8.14 Partnerships and Collaborations: Local and International Agreements
- Figure 9.1 Funding and Investment Analysis: Cumulative Year-wise Distribution by Number of Instances, since 2015
- Figure 9.2 Funding and Investment Analysis: Cumulative Year-wise Distribution of Amount Invested, since 2015 (USD Million)
- Figure 9.3 Funding and Investment Analysis: Distribution of Instances by Type of Funding, since 2015
- Figure 9.4 Funding and Investment Analysis: Distribution of Total Amount Invested by Type of Funding, since 2015 (USD Million)
- Figure 9.5 Funding and Investment Analysis: Distribution by Year and Type of Funding, since 2015
- Figure 9.6 Funding and Investment Analysis: Distribution by Year, Type of Funding and Amount Invested, since 2015 (USD Million)
- Figure 9.7 Funding and Investment Analysis: Summary of Investments, since 2015 (USD Million)
- Figure 9.8 Funding and Investment Analysis: Distribution by Geography
- Figure 9.9 Funding and Investment Analysis: Regional Distribution of Funding Instances
- Figure 9.10 Most Active Players: Distribution by Number of Funding Instances
- Figure 9.11 Most Active Players: Distribution by Amount Invested (USD Million)
- Figure 9.12 Funding and Investment Analysis:* Distribution by Type of Investors
- Figure 9.13 Funding and Investment Analysis: Distribution by Leading Investors
- Figure 9.13 Funding and Investment Analysis: Distribution of Instances by Phase of Development
- Figure 9.14 Funding and Investment Analysis: Distribution by Therapeutic Area
- Figure 10.1 Clinical Trial Analysis: Scope and Methodology
- Figure 10.2 Clinical Trial Analysis: Cumulative Distribution by Trial Registration Year
- Figure 10.3 Clinical Trial Analysis: Distribution by Trial Status
- Figure 10.4 Clinical Trial Analysis: Distribution by Trial Phase
- Figure 10.5 Clinical Trial Analysis: Distribution by Trial Registration Year and Trial Recruitment Status
- Figure 10.6 Clinical Trial Analysis: Distribution of Enrolled Patient Population by Trial Registration Year
- Figure 10.7 Clinical Trial Analysis: Distribution by Study Design
- Figure 10.8 Clinical Trial Analysis: Distribution by Type of Sponsor / Collaborator
- Figure 10.9 Most Active Players: Distribution by Number of Registered Trials
- Figure 10.10 Clinical Trial Analysis: Emerging Focus Area
- Figure 10.11 Clinical Trial Analysis: Distribution by Therapeutic Area
- Figure 10.12 Clinical Trial Analysis: Geographical Distribution by Number of Registered Trials
- Figure 10.13 Clinical Trial Analysis: Geographical Distribution by Enrolled Patient Population
- Figure 11.1 Clinical and Commercial Attractiveness Analysis of Phase III Molecules: Autoimmune Diseases
- Figure 11.2 Clinical and Commercial Attractiveness Analysis of Phase III Molecules: CNS Diseases
- Figure 11.3 Clinical and Commercial Attractiveness Analysis of Phase III Molecules: Endocrine Diseases
- Figure 11.4 Clinical and Commercial Attractiveness Analysis of Phase III Molecules: Gastrointestinal Diseases
- Figure 11.5 Clinical and Commercial Attractiveness Analysis of Phase III Molecules: Genetic Diseases
- Figure 11.6 Clinical and Commercial Attractiveness Analysis of Phase III Molecules: Hematological Diseases
- Figure 11.7 Clinical and Commercial Attractiveness Analysis of Phase III Molecules: Infectious Diseases
- Figure 11.8 Clinical and Commercial Attractiveness Analysis of Phase III Molecules: Inflammatory Diseases
- Figure 11.9 Clinical and Commercial Attractiveness Analysis of Phase III Molecules: Metabolic Diseases
- Figure 11.10 Clinical and Commercial Attractiveness Analysis of Phase III Molecules: Oncological Diseases
- Figure 11.11 Clinical and Commercial Attractiveness Analysis of Phase III Molecules: Ophthalmic Diseases
- Figure 11.12 Clinical and Commercial Attractiveness Analysis: Phase III Molecules: Other Diseases
- Figure 14.1 Global Peptide Therapeutics Market, till 2030 (USD Billion)
- Figure 14.2 Peptide Therapeutics Market: Distribution by Type of Peptide, till 2030
- Figure 14.3 Peptide Therapeutics Market: Distribution by Route of Administration, till 2030
- Figure 14.4 Peptide Therapeutics Market: Distribution by Geography, till 2030
- Figure 14.5 Peptide Therapeutics Market: Distribution by Key Therapeutic Area, till 2030
- Figure 14.6 Peptide Therapeutics Market for Autoimmune Diseases, till 2030 (USD Billion)
- Figure 14.7 Peptide Therapeutics Market for Cardiovascular Diseases, till 2030 (USD Billion)
- Figure 14.8 Peptide Therapeutics Market for CNS Diseases, till 2030 (USD Billion)
- Figure 14.9 Peptide Therapeutics Market for Dermatological Diseases, till 2030 (USD Billion)
- Figure 14.10 Peptide Therapeutics Market for Endocrine Diseases, till 2030 (USD Billion)
- Figure 14.11 Peptide Therapeutics Market for Gastrointestinal Diseases, till 2030 (USD Billion)
- Figure 14.12 Peptide Therapeutics Market for Genetic Diseases, till 2030 (USD Billion)
- Figure 14.13 Peptide Therapeutics Market for Hematological Diseases, till 2030 (USD Billion)
- Figure 14.14 Peptide Therapeutics Market for Infectious Diseases, till 2030 (USD Billion)
- Figure 14.15 Peptide Therapeutics Market for Inflammatory Diseases, till 2030 (USD Billion)
- Figure 14.16 Peptide Therapeutics Market for Metabolic Diseases, till 2030 (USD Billion)
- Figure 14.17 Peptide Therapeutics Market for Oncological Diseases, till 2030 (USD Billion)
- Figure 14.18 Peptide Therapeutics Market for Ophthalmic Diseases, till 2030 (USD Billion)
- Figure 14.19 Peptide Therapeutics Market for Other Diseases, till 2030 (USD Billion)

