
PUBLISHER: Roots Analysis | PRODUCT CODE: 1891245

PUBLISHER: Roots Analysis | PRODUCT CODE: 1891245
Smart Labels Market: Industry Trends and Global Forecasts, till 2035 - Distribution by Type of Technology, Type of Packaging, Type of Primary Packaging, Type of Secondary Packaging and Geographical Regions
Global Smart Labels Market: Overview
As per Roots Analysis, the global smart labels market is estimated to grow from USD 5.4 million in the current year to USD 24.0 million by 2035, at a CAGR of 16% during the forecast period, till 2035.
The market sizing and opportunity analysis has been segmented across the following parameters:
Type of Technology
- RFID
- NFC
- Other Technologies
Type of Packaging
- Primary Packaging
- Secondary Packaging
Type of Primary Packaging
- Vials
- Syringes
- Cartridges
- Ampoules
- Bottles
- Blister Packs
Type of Secondary Packaging
- Boxes
- Cartons
- Pouches
Geographical Regions
- North America
- Europe
- Asia-Pacific
- Middle East and North Africa
- Latin America
Global Smart Labels Market: Growth and Trends
Historically, important information was communicated through text and images printed on pharmaceutical products. In recent times, the adoption of smart labels has enabled developers to communicate more information about the product to consumers, eliminating the necessity for extra packaging space. It is important to mention that smart labels have a transponder code that can be detected by advanced devices, such as radio frequency identification device (RFID Smart Labels) tags and near-field communication (NFC Tags) chips. Although the majority of smartphones can read NFC and RFID tags, smart labels require specialized receivers for reading. Additionally, intelligent labels are essential in the production of medications. Smart labels can assist the pharmaceutical production process by improving productivity and precision, overseeing inventory, and ensuring product quality.
To minimize the effects of counterfeit medications and decrease medication errors arising from inadequate labeling and ambiguous packaging, pharmaceutical and biotech drug manufacturers have progressively started using smart labels for their packaging needs. Indeed, the healthcare industry has seen a significant rise in the market for smart tags and systems over the last ten years. This is mainly attributed to the implementation of product-level medicine tagging and real time locating systems (RTLS) for staff, patients, and assets, aimed at enhancing productivity, safety, and availability, while reducing the losses experienced by the sector.
Rising worries regarding fraud in sectors like pharmaceuticals and luxury goods are driving the adoption of NFC and RFID for authentication and compliance with regulations, including the EU's Falsified Medicines Directive. Further, in terms of technological innovation, smooth connectivity with AI, blockchain, and sensors enables predictive analytics, condition monitoring and improved consumer interaction through AR-enabled labels. Moreover, the need for sustainable, recyclable labels corresponds with eco-friendly packaging trends, minimizing waste in the food and retail industries. Fueled by the increasing need for pharmaceutical drugs and enhanced tracking systems, future prospects and expansion within this market are expected to experience significant growth in the coming years.
Global Smart Labels Market: Key Insights
The report delves into the current state of global smart labels market and identifies potential growth opportunities within industry. Some key findings from the report include:
- The current market landscape features the presence of over 90 players engaged in the smart pharmaceutical and healthcare labels domain, worldwide.
- Over 80 players employ radio frequency identification device-based technology in order to develop cutting-edge labels for a wide range of applications; IoT labels are also gaining traction.
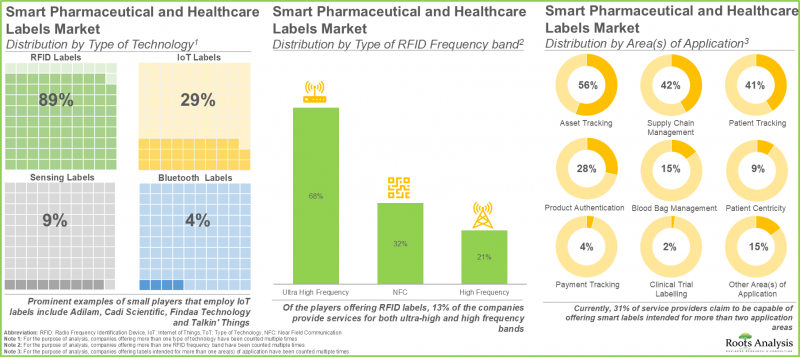
- Currently, 31% of service providers claim to be capable of offering smart labels intended for more than two application areas.
- More than 400 patents have been granted / filed for smart pharmaceutical and healthcare labels, primarily led by industry players based in North America.
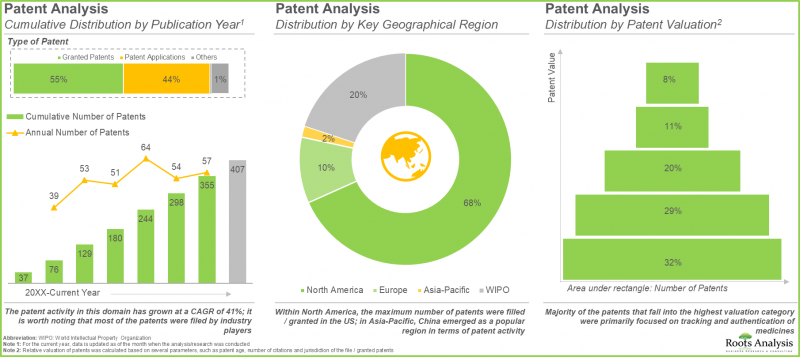
- The patent activity in this domain has grown at a CAGR of 41%; it is worth noting that most of the patents were filed by industry players.
- A rise in partnerships, in the recent past, involving both international and indigenous stakeholders, validate the growing interest in this domain.
- Both well-established and new entrants have forged strategic partnerships in this domain; over 40% of the deals were inked in the last two years.
- Acquisitions emerged as the most prominent partnership model adopted by players; in fact, 40% of the acquisition instances were reported in the past 12 months.
- Based on the pioneer-migrator-settler map, we have classified the smart label providers into different categories; a selection of pioneers is expected to provide valuable offerings to lead the market in the longer term.
- The market is expected to witness a growth of over 16% in the coming decade; the opportunity is likely to be well distributed across various types of technology and different geographical regions.
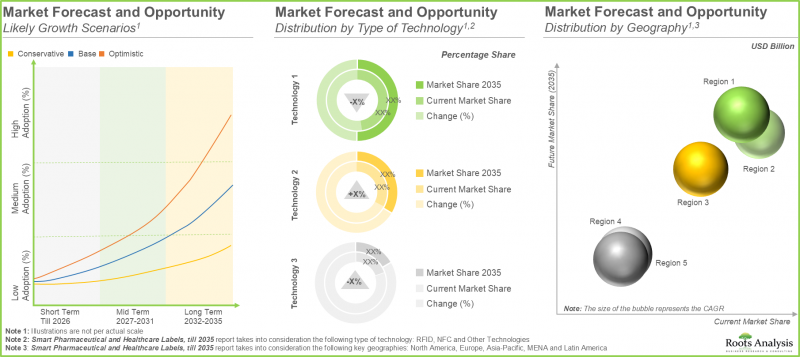
- In long term, the majority share of revenues is likely to be driven by players offering smart labels for primary packaging to prevent counterfeiting of drugs.
Global Smart Labels Market: Key Segments
RFID Segment Occupies the Largest Share of the Smart Labels Market
In terms of the type of technology, the market is segmented into RFID, NFC and other technologies. At present, RFID segment holds the maximum (~75%) share of the global smart labels market owing to their ability to allow quick and efficient data capture.
By Type of Packaging, Primary Packaging Segment is the Fastest Growing Segment of the Global Smart Labels Market
In terms of type of packaging, the market is segmented into primary packaging and secondary packaging. Currently, primary packaging segment captures the highest proportion (95%) of the smart labels market. This can be attributed to the fact that primary packaging plays a more critical role than pharmaceutical secondary packaging, since it directly engages with the product and is crucial for maintaining its quality, safety, and appearance. Additionally, this segment is expected to expand at a comparatively higher CAGR.
Syringes Segment Occupies the Largest Share of the Smart Labels Market
In terms of the type of primary packaging, the market is segmented into vials, syringes, cartridges, ampoules, bottles and blister packs. At present, the syringes segment holds the maximum share (40%) of the smart labels market. In addition, this segment is likely to grow at a relatively higher CAGR during the forecast period.
By Secondary Packaging, the Cartons Segment is the Fastest Growing Segment of the Smart Labels Market During the Forecast Period
In terms of secondary packaging, the market is segmented into boxes, cartons and pouches. Currently, the cartons segment captures the highest proportion (50%) of the smart labels market. Further, it is worth highlighting that the smart labels market for cartons segment is likely to grow at a relatively higher CAGR.
Europe Accounts for the Largest Share of the Market
In terms of key geographical regions, the market is segmented into North America, Europe, Asia-Pacific, Latin America, and Middle East and North Africa. Currently, Europe (35%) dominates the smart labels market and accounts for the largest revenue share. Further, the market in Latin America is expected to grow at a higher CAGR.
Example Players in the Global Smart Labels Market
- CCL Industries
- Schreiner MediPharm
- Datalogic
- Tadbik
- SATO Asia Pacific
- Invengo (acquired by ASSA ABLOY)
- Intellhydro Technology
- RFiD Discovery (acquired by Paragon ID)
- ID Tech Solutions (acquired by Eruditus Group)
Global Smart Labels Market: Research Coverage
- Market Sizing and Opportunity Analysis: The report features an in-depth analysis of the global smart labels market, focusing on key market segments, including [A] type of technology, [B] type of packaging, [C] type of primary packaging, [D] type of secondary packaging and [E] geographical regions.
- Market Landscape: A comprehensive evaluation of players engaged in the smart pharmaceutical and healthcare label providers domain, considering various parameters, such as [A] type of technology, [B] RFID frequency band and [C] area(s) of application.
- Company Competitiveness Analysis: An insightful competitive analysis of companies engaged in the development of smart pharmaceutical and healthcare labels, examining factors, such as [A] supplier strength, [B] service strength and [C] portfolio strength.
- Company Profiles: In-depth profiles of companies that claim to specialize in offering smart pharmaceutical and healthcare labels, focusing on [A] company overview, [B] product portfolio and [C] recent developments and an informed future outlook.
- Patent Analysis: A detailed analysis of patents related to smart pharmaceutical and healthcare labels that have been filed / granted till date, based on several relevant parameters, such as [A] type of patent, [B] publication year, [C] geographical location / patent jurisdiction, [D] legal status, [E] CPC symbols, [F] type of industry, [G] type of applicant, [H] leading players and [I] patent valuation analysis.
- Partnerships and Collaborations: An insightful analysis of the deals inked by stakeholders in this domain, based on several parameters, such as [A] year of partnership, [B] type of partnership, [C] most active player and [D] geographical distribution of partnership activity.
- SWOT Analysis: A detailed discussion on affiliated trends, key drivers and challenges, under a SWOT framework, which are likely to impact the industry's evolution, along with a Harvey ball analysis, highlighting the relative effect of each SWOT parameter on the overall smart pharmaceutical and healthcare labels market.
Key Questions Answered in this Report
- How many companies are currently engaged in this market?
- Which are the leading companies in this market?
- What factors are likely to influence the evolution of this market?
- What is the current and future market size?
- What is the CAGR of this market?
- How is the current and future market opportunity likely to be distributed across key market segments?
Reasons to Buy this Report
- The report provides a comprehensive market analysis, offering detailed revenue projections of the overall market and its specific sub-segments. This information is valuable to both established market leaders and emerging entrants.
- Stakeholders can leverage the report to gain a deeper understanding of the competitive dynamics within the market. By analyzing the competitive landscape, businesses can make informed decisions to optimize their market positioning and develop effective go-to-market strategies.
- The report offers stakeholders a comprehensive overview of the market, including key drivers, barriers, opportunities, and challenges. This information empowers stakeholders to stay abreast of market trends and make data-driven decisions to capitalize on growth prospects.
Additional Benefits
- Complimentary PPT Insights Packs
- Complimentary Excel Data Packs for all Analytical Modules in the Report
- 15% Free Content Customization
- Detailed Report Walkthrough Session with Research Team
- Free Updated report if the report is 6-12 months old or older
TABLE OF CONTENTS
1. PREFACE
- 1.1. Scope of the Report
- 1.2. Research Methodology
- 1.2.1. Research Assumptions
- 1.2.2. Project Methodology
- 1.2.3. Forecast Methodology
- 1.2.4. Robust Quality Control
- 1.2.5. Key Considerations
- 1.2.5.1. Demographics
- 1.2.5.2. Economic Factors
- 1.2.5.3. Government Regulations
- 1.2.5.4. Supply Chain
- 1.2.5.5. COVID Impact / Related Factors
- 1.2.5.6. Market Access
- 1.2.5.7. Healthcare Policies
- 1.2.5.8. Industry Consolidation
- 1.3 Key Questions Answered
- 1.4. Chapter Outlines
2. EXECUTIVE SUMMARY
3. INTRODUCTION
- 3.1. Chapter Overview
- 3.2. Role of Smart Labels in the Healthcare Sector
- 3.2.1. Types of Smart Labels
- 3.2.1.1. Radio Frequency Identification Device (RFID)
- 3.2.1.2. Near-Field Communication (NFC)
- 3.2.1.3. Internet of Things (IoT)
- 3.2.2. Need for Smart Labels in the Healthcare Sector
- 3.2.3. Advantages of Using Smart Labels in Healthcare Sector
- 3.2.1. Types of Smart Labels
- 3.3. Roadblocks and Challenges Associated with the Adoption of Smart Labels
- 3.4. Adoption of Smart Labels in the Healthcare Sector
- 3.4.1. Key Drivers for Adoption of Smart Labels
- 3.5. Future Outlook
4. MARKET LANDSCAPE
- 4.1. Chapter Overview
- 4.2. Smart Pharmaceutical and Healthcare Label Providers: Overall Market Landscape
- 4.2.1. Analysis by Year of Establishment
- 4.2.2. Analysis by Company Size
- 4.2.3. Analysis by Location of Headquarters
- 4.2.4. Analysis by Company Size and Location of Headquarters
- 4.2.5. Analysis by Type of Technology
- 4.2.6. Analysis by Company Size and Type of Technology
- 4.2.7. Analysis by Type of RFID Frequency Band
- 4.2.8. Analysis by Area(s) of Application
- 4.2.9. Analysis by Company Size and Area(s) of Application
- 4.2.10. Analysis by Type of Technology and Area(s) of Application
5. COMPANY COMPETITIVENESS ANALYSIS
- 5.1. Chapter Overview
- 5.2. Assumptions / Key parameter
- 5.3. Methodology
- 5.3.1. Smart Pharmaceutical and Healthcare Label Providers based in North America
- 5.3.2. Smart Pharmaceutical and Healthcare Label Providers based in Europe
- 5.3.3. Smart Pharmaceutical and Healthcare Label Providers based in Asia-Pacific
- 5.4. Company Competitiveness Analysis: Benchmarking the Capabilities of Leading Players
6. COMPANY PROFILES
- 6.1. Chapter Overview
- 6.2. CCL Industries
- 6.2.1. Company Overview
- 6.2.2. Financial Information
- 6.2.3. Area(s) of Application
- 6.2.4. Recent Developments and Future Outlook
- 6.3. Schreiner
- 6.3.1. Company Overview
- 6.3.2. Area(s) of Application
- 6.3.3. Recent Developments and Future Outlook
- 6.4. Datalogic
- 6.4.1. Company Overview
- 6.4.2. Financial Information
- 6.4.3. Area(s) of Application
- 6.4.4. Recent Developments and Future Outlook
- 6.5. Tadbik
- 6.5.1. Company Overview
- 6.5.2. Area(s) of Application
- 6.5.3. Recent Developments and Future Outlook
- 6.6. SATO Asia Pacific
- 6.6.1. Company Overview
- 6.6.2. Financial Information
- 6.6.3. Area(s) of Application
- 6.6.4. Recent Developments and Future Outlook
- 6.7. Invengo
- 6.7.1. Company Overview
- 6.7.2. Area(s) of Application
- 6.7.3. Recent Developments and Future Outlook
- 6.8. Intellhydro Technology
- 6.8.1. Company Overview
- 6.8.2. Area(s) of Application
- 6.8.3. Recent Developments and Future Outlook
- 6.9. RFiD Discovery
- 6.9.1. Company Overview
- 6.9.2. Area(s) of Application
- 6.9.3. Recent Developments and Future Outlook
- 6.10. ID Tech Solutions
- 6.10.1. Company Overview
- 6.10.2. Area(s) of Application
- 6.10.3. Recent Developments and Future Outlook
7. PATENT ANALYSIS
- 7.1. Chapter Overview
- 7.2. Scope and Methodology
- 7.3. Smart Pharmaceutical and Healthcare Labels: Patent Analysis
- 7.3.1. Analysis by Publication Year
- 7.3.2. Analysis by Publication Year and Type of Patent
- 7.3.3. Analysis by CPC Code
- 7.3.4. Analysis by Type of Applicant
- 7.3.5. Analysis by Geography
- 7.3.6. Analysis by Emerging Focus Areas
- 7.3.7. Leading Industry Players: Analysis by Number of Patents
- 7.4. Smart Pharmaceutical and Healthcare Labels: Patent Benchmarking Analysis
- 7.4.1. Analysis by Patent Characteristics
- 7.5. Smart Pharmaceutical and Healthcare Labels: Patent Valuation Analysis
8. PARTNERSHIPS AND COLLABORATIONS
- 8.1. Chapter Overview
- 8.2. Partnership Models
- 8.3. Smart Pharmaceutical and Healthcare Labels: Recent Partnerships and Collaborations
- 8.3.1. Analysis by Year of Partnership
- 8.3.2. Analysis by Type of Partnership
- 8.3.3. Most Active Players: Analysis by Number of Partnerships
- 8.3.4. Regional Analysis
- 8.3.4.1. Local and International Agreements
- 8.3.4.2. Intercontinental and Intracontinental Agreements
9. BLUE OCEAN STRATEGY
- 9.1. Chapter Overview
- 9.2. Overview of Blue Ocean Strategy
- 9.2.1. Red Ocean
- 9.2.2. Blue Ocean
- 9.2.3. Comparison of Red Ocean Strategy and Blue Ocean Strategy
- 9.2.4. Smart Pharmaceuticals and Healthcare Labels: Blue Ocean Strategy and Shift Tools
- 9.2.4.1. Value Innovation
- 9.2.4.2. Strategy Canvas
- 9.2.4.3. Four Action Framework
- 9.2.4.4. Eliminate-Raise-Reduce-Create (ERRC) Grid
- 9.2.4.5. Six Path Framework
- 9.2.4.6. Pioneer-Migrator-Settler (PMS) Map
- 9.2.4.7. Three Tiers of Noncustomers
- 9.2.4.8. Sequence of Blue Ocean Strategy
- 9.2.4.9. Buyer Utility Map
- 9.2.4.10. The Price Corridor of the Mass
- 9.2.4.11. Four Hurdles to Strategy Execution
- 9.2.4.12. Tipping Point Leadership
- 9.2.4.13. Fair Process
- 9.3. Concluding Remarks
10. MARKET SIZING AND OPPORTUNITY ANALYSIS
- 10.1. Chapter Overview
- 10.2. Key Assumptions and Methodology
- 10.3. Global Smart Pharmaceutical and Healthcare Labels Market, Till 2035
- 10.4. Smart Pharmaceutical and Healthcare Labels Market: Analysis by Type of Technology, Till 2035
- 10.4.1. Smart Pharmaceutical and Healthcare Labels Market for RFID, Till 2035
- 10.4.2. Smart Pharmaceutical and Healthcare Labels Market for NFC, Till 2035
- 10.4.3. Smart Pharmaceutical and Healthcare Labels Market for Other Technologies, Till 2035
- 10.5. Smart Pharmaceutical and Healthcare Labels Market: Analysis by Type of Packaging, Till 2035
- 10.5.1. Smart Pharmaceutical and Healthcare Labels Market: Analysis by Type of Primary Packaging, Till 2035
- 10.5.1.1. Smart Pharmaceutical and Healthcare Labels Market for Vials, Till 2035
- 10.5.1.2. Smart Pharmaceutical and Healthcare Labels Market for Syringes, Till 2035
- 10.5.1.3. Smart Pharmaceutical and Healthcare Labels Market for Cartridges, Till 2035
- 10.5.1.4. Smart Pharmaceutical and Healthcare Labels Market for Ampoules, Till 2035
- 10.5.1.5. Smart Pharmaceutical and Healthcare Labels Market for Bottles, Till 2035
- 10.5.1.6. Smart Pharmaceutical and Healthcare Labels Market for Blister Packs, Till 2035
- 10.5.2. Smart Pharmaceutical and Healthcare Labels Market: Analysis by Type of Secondary Packaging, Till 2035
- 10.5.2.1. Smart Pharmaceutical and Healthcare Labels Market for Boxes, Till 2035
- 10.5.2.2. Smart Pharmaceutical and Healthcare Labels Market for Cartons, Till 2035
- 10.5.2.3. Smart Pharmaceutical and Healthcare Labels Market for Pouches, Till 2035
- 10.5.1. Smart Pharmaceutical and Healthcare Labels Market: Analysis by Type of Primary Packaging, Till 2035
- 10.6. Smart Pharmaceutical and Healthcare Labels Market: Analysis by Geography, Till 2035
- 10.6.1. Smart Pharmaceutical and Healthcare Labels Market in North America, Till 2035
- 10.6.2. Smart Pharmaceutical and Healthcare Labels Market in Europe, Till 2035
- 10.6.3. Smart Pharmaceutical and Healthcare Labels Market in Asia-Pacific, Till 2035
- 10.6.4. Smart Pharmaceutical and Healthcare Labels Market in MENA, Till 2035
- 10.6.5. Smart Pharmaceutical and Healthcare Labels Market in Latin America, Till 2035
11. SWOT ANALYSIS
- 11.1. Chapter Overview
- 11.2. Strengths
- 11.3. Weaknesses
- 11.4. Opportunities
- 11.5. Threats
- 11.6. Comparison of SWOT Factors
12. CONCLUDING REMARKS
13. APPENDIX I: TABULATED DATA
14. APPENDIX II: LIST OF COMPANIES AND ORGANIZATIONS
List of Tables
- Table 4.1 Smart Pharmaceutical and Healthcare Label Providers: List of Companies
- Table 4.2 Smart Pharmaceutical and Healthcare Label Providers: Information on Type of RFID Frequency Band
- Table 4.3 Smart Pharmaceutical and Healthcare Label Providers: Information on Area(s) of Application
- Table 5.1 Company Competitiveness: Benchmarking the Capabilities of Leading Players
- Table 6.1 CCL Industries: Company Overview
- Table 6.2 CCL Industries: Recent Developments and Future Outlook
- Table 6.3 Schreiner: Company Overview
- Table 6.4 Schreiner: Recent Developments and Future Outlook
- Table 6.5 Datalogic: Company Overview
- Table 6.6 Datalogic: Recent Developments and Future Outlook
- Table 6.7 Tadbik: Company Overview
- Table 6.8 SATO: Company Overview
- Table 6.9 SATO: Recent Developments and Future Outlook
- Table 6.10 Invengo: Company Overview
- Table 6.11 Invengo: Recent Developments and Future Outlook
- Table 6.12 Intellhydro Technology: Company Overview
- Table 6.12 RFiD Discovery: Company Overview
- Table 6.13 RFiD Discovery: Recent Developments and Future Outlook
- Table 6.14 ID Tech Solutions: Company Overview
- Table 7.1 Patent Analysis: Top CPC Sections
- Table 7.2 Patent Analysis: Top CPC Symbols
- Table 7.3 Patent Analysis: Top CPC Codes
- Table 7.4 Patent Analysis: Summary of Benchmarking
- Table 7.5 Patent Analysis: List of Leading Patents (by Highest Relative Valuation)
- Table 8.1 Smart Pharmaceutical and Healthcare Labels: List of Partnerships and Collaborations
- Table 10.1 Average Prices of Primary Packaging Containers and Secondary Packaging Containers
- Table 13.1 Smart Pharmaceutical and Healthcare Label Providers: Distribution by Year of Establishment
- Table 13.2 Smart Pharmaceutical and Healthcare Label Providers: Distribution by Company Size
- Table 13.3 Smart Pharmaceutical and Healthcare Label Providers: Distribution by Location of Headquarters
- Table 13.4 Smart Pharmaceutical and Healthcare Label Providers: Distribution by Company Size and Location of Headquarters
- Table 13.5 Smart Pharmaceutical and Healthcare Label Providers: Distribution by Type of Technology
- Table 13.6 Smart Pharmaceutical and Healthcare Label Providers: Distribution by Company Size and Type of Technology
- Table 13.7 Smart Pharmaceutical and Healthcare Label Providers: Distribution by Type of RFID Frequency Band
- Table 13.8 Smart Pharmaceutical and Healthcare Label Providers: Distribution by Area(s) of Application
- Table 13.9 Smart Pharmaceutical and Healthcare Label Providers: Distribution Company Size and Area(s) of Application
- Table 13.10 Smart Pharmaceutical and Healthcare Label Providers: Distribution by Type of Technology and Area(s) of Application
- Table 13.11 CCL Industries: Annual Revenues, Since 2018 (CAD Billion)
- Table 13.12 Datalogic: Annual Revenues, Since 2018 (EUR Billion)
- Table 13.13 SATO: Annual Revenues, Since 2018 (JPY Billion)
- Table 13.14 Patent Analysis: Distribution by Type of Patent
- Table 13.15 Patent Analysis: Cumulative Distribution by Publication Year, Since 2015
- Table 13.16 Patent Analysis: Distribution by Type of Patent and Publication Year
- Table 13.17 Patent Analysis: Distribution by Type of Applicant
- Table 13.18 Patent Analysis: Distribution by Geography
- Table 13.19 Leading Industry Players: Distribution by Number of Patents
- Table 13.20 Patent Analysis: Distribution by Patent Age, Since 2015
- Table 13.21 Partnerships and Collaborations: Distribution by Cumulative Year-wise Trend of Partnerships, Since 2018
- Table 13.22 Partnerships and Collaborations: Distribution by Type of Partnership
- Table 13.23 Partnerships and Collaborations: Distribution by Year and Type of Partnership
- Table 13.24 Most Active Players: Distribution by Number of Partnership Instances
- Table 13.25 Partnerships and Collaborations: Distribution by Local and International Agreements
- Table 13.26 Partnerships and Collaborations: Distribution by Intercontinental and Intracontinental Agreements
- Table 13.27 Global Smart Pharmaceutical and Healthcare Labels Market, Conservative, Base and Optimistic Scenarios, Till 2035 (USD Billion)
- Table 13.28 Smart Pharmaceutical and Healthcare Labels Market: Distribution by Type of Technology (USD Million)
- Table 13.29 Smart Pharmaceutical and Healthcare Labels Market for RFID Labels, Conservative, Base and Optimistic Scenarios, Till 2035 (USD Million)
- Table 13.30 Smart Pharmaceutical and Healthcare Labels Market for NFC Labels, Conservative, Base and Optimistic Scenarios, Till 2035 (USD Million)
- Table 13.31 Smart Pharmaceutical and Healthcare Labels Market for Other Labels, Conservative, Base and Optimistic Scenarios, Till 2035 (USD Million)
- Table 13.32 Smart Pharmaceutical and Healthcare Labels Market: Distribution by Type of Packaging, Conservative, Base and Optimistic Scenarios, Till 2035 (USD Million)
- Table 13.33 Smart Pharmaceutical and Healthcare Labels Market: Distribution by Type of Primary Packaging (USD Million)
- Table 13.34 Smart Pharmaceutical and Healthcare Labels Market for Vials, Conservative, Base and Optimistic Scenarios, Till 2035 (USD Million)
- Table 13.35 Smart Pharmaceutical and Healthcare Labels Market for Syringes, Conservative, Base and Optimistic Scenarios, Till 2035 (USD Million)
- Table 13.36 Smart Pharmaceutical and Healthcare Labels Market for Cartridges, Conservative, Base and Optimistic Scenarios, Till 2035 (USD Million)
- Table 13.37 Smart Pharmaceutical and Healthcare Labels Market for Ampoules, Conservative, Base and Optimistic Scenarios, Till 2035 (USD Million)
- Table 13.38 Smart Pharmaceutical and Healthcare Labels Market for Bottles, Conservative, Base and Optimistic Scenarios, Till 2035 (USD Million)
- Table 13.39 Smart Pharmaceutical and Healthcare Labels Market for Blister Packs, Conservative, Base and Optimistic Scenarios, Till 2035 (USD Million)
- Table 13.40 Smart Pharmaceutical and Healthcare Labels Market: Distribution by Type of Secondary Packaging (USD Million)
- Table 13.41 Smart Pharmaceutical and Healthcare Labels Market for Boxes, Conservative, Base and Optimistic Scenarios, Till 2035 (USD Million)
- Table 13.42 Smart Pharmaceutical and Healthcare Labels Market for Cartons, Conservative, Base and Optimistic Scenarios, Till 2035 (USD Million)
- Table 13.43 Smart Pharmaceutical and Healthcare Labels Market for Pouches, Conservative, Base and Optimistic Scenarios, Till 2035 (USD Million)
- Table 13.44 Smart Pharmaceutical and Healthcare Labels Market in North America, Conservative, Base and Optimistic Scenarios, Till 2035 (USD Million)
- Table 13.45 Smart Pharmaceutical and Healthcare Labels Market in Europe, Conservative, Base and Optimistic Scenarios, Till 2035 (USD Million)
- Table 13.46 Smart Pharmaceutical and Healthcare Labels Market in Asia-Pacific, Conservative, Base and Optimistic Scenarios, Till 2035 (USD Million)
- Table 13.47 Smart Pharmaceutical and Healthcare Labels Market in MENA, Conservative, Base and Optimistic Scenarios, Till 2035 (USD Million)
- Table 13.48 Smart Pharmaceutical and Healthcare Labels Market in Latin America, Conservative, Base and Optimistic Scenarios, Till 2035 (USD Million)
List of Figures
- Figure 2.1 Executive Summary: Market Landscape
- Figure 2.2 Executive Summary: Partnerships and Collaborations
- Figure 2.3 Executive Summary: Patent Analysis
- Figure 2.4 Executive Summary: Market Sizing and Opportunity Analysis
- Figure 3.1 Comparison of Radio Frequency Identification Device (RFID) and Near-Field Communication (NFC)
- Figure 3.2 Advantages Offered by Smart Labels to Healthcare Industry
- Figure 4.1 Smart Pharmaceutical and Healthcare Label Providers: Distribution by Year of Establishment
- Figure 4.2 Smart Pharmaceutical and Healthcare Label Providers: Distribution by Company Size
- Figure 4.3 Smart Pharmaceutical and Healthcare Label Providers: Distribution by Location of Headquarters
- Figure 4.4 Smart Pharmaceutical and Healthcare Label Providers: Distribution by Company Size and Location of Headquarters
- Figure 4.5 Smart Pharmaceutical and Healthcare Label Providers: Distribution by Type of Technology
- Figure 4.6 Smart Pharmaceutical and Healthcare Label Providers: Distribution by Company Size and Type of Technology
- Figure 4.7 Smart Pharmaceutical and Healthcare Label Providers: Distribution by Type of RFID Frequency Band
- Figure 4.8 Smart Pharmaceutical and Healthcare Label Providers: Distribution by Area(s) of Application
- Figure 4.9 Smart Pharmaceutical and Healthcare Label Providers: Distribution by Company Size and Area(s) of Application
- Figure 4.10 Smart Pharmaceutical and Healthcare Label Providers: Distribution by Type of Technology and Area(s) of Application
- Figure 5.1 Company Competitiveness Analysis: Smart Pharmaceutical and Healthcare Label Providers based in North America
- Figure 5.2 Company Competitiveness Analysis: Smart Pharmaceutical and Healthcare Label Providers based in Europe
- Figure 5.3 Company Competitiveness Analysis: Smart Pharmaceutical and Healthcare Label Providers based in Asia-Pacific & RoW
- Figure 6.1 CCL Industries: Annual Revenues, Since 2018 (CAD Billion)
- Figure 6.2 CCL Industries: Area(s) of Application
- Figure 6.3 Schreiner: Area(s) of Application
- Figure 6.4 Datalogic: Annual Revenues, Since 2018 (EUR Billion)
- Figure 6.5 Datalogic: Area(s) of Application
- Figure 6.6 Tadbik: Area(s) of Application
- Figure 6.7 SATO: Annual Revenues, Since 2018 (JPY Billion)
- Figure 6.8 SATO: Area(s) of Application
- Figure 6.9 Invengo: Area(s) of Application
- Figure 6.10 Intellhydro Technology: Area(s) of Application
- Figure 6.11 RFiD Discovery: Area(s) of Application
- Figure 6.12 ID Tech Solutions: Area(s) of Application
- Figure 7.1 Patent Analysis: Distribution by Type of Patent
- Figure 7.2 Patent Analysis: Cumulative Distribution by Publication Year, Since 2015
- Figure 7.3 Patent Analysis: Distribution by Type of Patent and Publication Year
- Figure 7.4 Patent Analysis: Distribution by CPC Symbols
- Figure 7.5 Patent Analysis: Distribution by Type of Applicant
- Figure 7.6 Patent Analysis: Distribution by Geography
- Figure 7.7 Patent Analysis: Distribution by Emerging Focus Areas
- Figure 7.8 Leading Industry Players: Distribution by Number of Patents
- Figure 7.9 Patent Benchmarking: Distribution of Leading Industry Players by Patent Characteristics (CPC Symbols)
- Figure 7.10 Patent Analysis: Distribution by Patent Age, Since 2015
- Figure 7.11 Patent Analysis: Categorizations based on Weighted Valuation Scores
- Figure 7.12 Patent Analysis: Distribution by Patent Valuation
- Figure 8.1 Partnerships and Collaborations: Cumulative Year-wise Trend of Partnerships, Since 2018
- Figure 8.2 Partnerships and Collaborations: Distribution by Type of Partnership
- Figure 8.3 Partnerships and Collaborations: Distribution by Year and Type of Partnership
- Figure 8.4 Most Active Players: Distribution by Number of Partnership Instances
- Figure 8.5 Partnerships and Collaborations: Distribution by Local and International Agreements
- Figure 8.6 Partnerships and Collaborations: Distribution by Intercontinental and Intracontinental Agreements
- Figure 9.1 Red Ocean Strategy versus Blue Ocean Strategy
- Figure 9.2 Blue Ocean Strategy: Strategy Canvas
- Figure 9.3 Blue Ocean Strategy: Eliminate-Raise-Reduce-Create (ERRC) Grid
- Figure 9.4 Blue Ocean Strategy: Pioneer-Migrator-Settler (PMS) Map
- Figure 9.5 Blue Ocean Strategy: Three Tiers of Noncustomers
- Figure 9.6 Blue Ocean Strategy: Sequence of Blue Ocean Strategy
- Figure 9.7 Blue Ocean Strategy: Buyer Utility Map
- Figure 9.8 Blue Ocean Strategy: The Price Corridor of the Mass
- Figure 10.1 Global Smart Pharmaceutical and Healthcare Labels Market, Till 2035 (USD Billion)
- Figure 10.2 Smart Pharmaceutical and Healthcare Labels Market: Distribution by Type of Technology, Till 2035 (USD Million)
- Figure 10.3 Smart Pharmaceutical and Healthcare Labels Market for RFID Labels, Till 2035 (USD Million)
- Figure 10.4 Smart Pharmaceutical and Healthcare Labels Market for NFC Labels, Till 2035 (USD Million)
- Figure 10.5 Smart Pharmaceutical and Healthcare Labels Market for Other Technologies, Till 2035 (USD Million)
- Figure 10.6 Smart Pharmaceutical and Healthcare Labels Market: Distribution by Type of Packaging, Till 2035 (USD Million)
- Figure 10.7 Smart Pharmaceutical and Healthcare Labels Market: Distribution by Type of Primary Packaging, Till 2035 (USD Million)
- Figure 10.8 Smart Pharmaceutical and Healthcare Labels Market for Vials, Till 2035 (USD Million)
- Figure 10.9 Smart Pharmaceutical and Healthcare Labels Market for Syringes, Till 2035 (USD Million)
- Figure 10.10 Smart Pharmaceutical and Healthcare Labels Market for Cartridges, Till 2035 (USD Million)
- Figure 10.11 Smart Pharmaceutical and Healthcare Labels Market for Ampoules, Till 2035 (USD Million)
- Figure 10.12 Smart Pharmaceutical and Healthcare Labels Market for Bottles, Till 2035 (USD Million)
- Figure 10.13 Smart Pharmaceutical and Healthcare Labels Market for Blister Packs, Till 2035 (USD Million)
- Figure 10.14 Smart Pharmaceutical and Healthcare Labels Market: Distribution by Type of Secondary Packaging, Till 2035 (USD Million)
- Figure 10.15 Smart Pharmaceutical and Healthcare Labels Market for Boxes, Till 2035 (USD Million)
- Figure 10.16 Smart Pharmaceutical and Healthcare Labels Market for Cartons, Till 2035 (USD Million)
- Figure 10.17 Smart Pharmaceutical and Healthcare Labels Market for Pouches, Till 2035 (USD Million)
- Figure 10.18 Smart Pharmaceutical and Healthcare Labels Market: Distribution by Geography, Till 2035 (USD Million)
- Figure 10.19 Smart Pharmaceutical and Healthcare Labels Market in North America, Till 2035 (USD Million)
- Figure 10.20 Smart Pharmaceutical and Healthcare Labels Market in Europe, Till 2035 (USD Million)
- Figure 10.21 Smart Pharmaceutical and Healthcare Labels Market in Asia-Pacific, Till 2035 (USD Million)
- Figure 10.22 Smart Pharmaceutical and Healthcare Labels Market in MENA, Till 2035 (USD Million)
- Figure 10.23 Smart Pharmaceutical and Healthcare Labels Market in Latin America, Till 2035 (USD Million)
- Figure 11.1 SWOT Analysis: Harvey Ball Analysis
- Figure 11.2 Comparison of SWOT Factors: Harvey Ball Analysis
- Figure 12.1 Concluding Remarks: Market Landscape
- Figure 12.2 Concluding Remarks: Patent Analysis
- Figure 12.3 Concluding Remarks: Partnerships and Collaborations
- Figure 12.4 Concluding Remarks: Market Sizing and Opportunity Analysis (1/2)
- Figure 12.5 Concluding Remarks: Market Sizing and Opportunity Analysis (2/2)

