
PUBLISHER: Roots Analysis | PRODUCT CODE: 1891248

PUBLISHER: Roots Analysis | PRODUCT CODE: 1891248
Biologics Contract Research Organization Market: Industry Trends and Global Forecasts, Till 2035 - Distribution by Type of Biologic, Scale of Operation, Therapeutic Area, and Geography
Biologics Contract Research Organization Market: Overview
As per Roots Analysis, the global biologics contract research organization market valued at USD 36 billion in the current year and is anticipated to reach USD 126 billion by 2035, growing at a lucrative CAGR of 13% during the forecast period.
The market sizing and opportunity analysis has been segmented across the following parameters:
Type of Biologic
- Vaccines
- Cell Therapy
- Gene Therapy
- Antibodies
- Recombinant Proteins / Peptides
- Others
Scale of Operation
- Clinical Operations
- Preclinical Operations
Therapeutic Area
- Oncological Disorders
- Cardiovascular Disorders
- Inflammatory Disorders
- Neurological Disorders
- Other Therapeutic Areas
Geography
- North America
- Europe
- Asia-Pacific
- Latin America
- Middle East and North Africa
- Rest of the World
Biologics Contract Research Organization Market: Growth and Trends
Biologics are among the fastest expanding sectors within the pharmaceutical industry. This
can be linked to the swift advancement in this area, fueled by the demand for efficient and tailored pharmacological solutions. The increased need for biologics including monoclonal antibodies, gene therapies, and cell therapies is driven by their success in addressing chronic and complex ailments such as cancer, autoimmune diseases, and neurological disorders. This need is intensified by an expanding biologics pipeline and elevated approval rates. Nonetheless, the development and clinical evaluation of biologics is a very intricate and expensive procedure that requires specialized knowledge and cutting-edge bioprocessing technologies. Consequently, numerous biopharmaceutical firms are opting to delegate their drug discovery and clinical research activities.
At present, biopharmaceutical firms are adopting a business model wherein development processes are contracted to external service providers, while the firm itself oversees the R&D of these biologics. The biologics contract research organization sector is experiencing growth fueled by the rising research on innovative medications and illnesses. R&D of biologics is labor-intensive and pharmaceutical companies need significant technological knowledge and specialized expertise, which increases the overall expense of drugs. Moreover, strict regulatory standards and the approval process can delay the approval of drugs, resulting in a drug supply shortfall in the market.
To simplify these intricate processes and address related challenges, leading pharmaceutical companies are progressively delegating their biologics research and development efforts to specialized contract research organizations (CROs). This strategic outsourcing enables them to utilize external knowledge, speed up drug discovery and clinical trials, and ultimately launch innovative biologics to market more effectively. In addition, the integration of AI can speed up drug discovery, enhance clinical trials (such as patient recruitment), and boost manufacturing yields. The domain presents numerous opportunities in implementing automation for bioprocessing and decentralized / virtual clinical trials, which lower expenses and improve data quality. As a result, the biologics contract research organization market is expected to grow steadily to meet the increasing R&D needs of biopharmaceutical sponsors.
Biologics Contract Research Organization Market: Key Insights
The report delves into the current state of the biologics contract research organization market and identifies potential growth opportunities within industry. Some key findings from the report include:
- Presently, 160 players claim to have the necessary capabilities to offer contract research services and clinical trial support for different types of biopharmaceutical products.
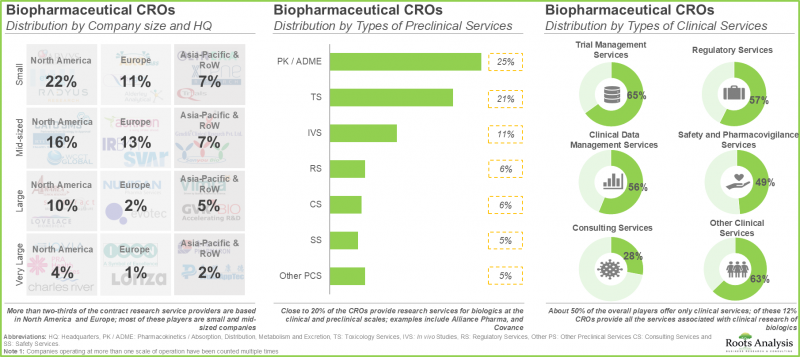
- About 50% of all the players offer only clinical services; of these, 12% CROs provide all the services associated with clinical research of biologics.
- The current market landscape is fragmented, featuring a mix of well-established players and specialty service providers, having extensive portfolios to support preclinical and clinical research.
- It is estimated that big pharma players presently outsource close to 45% of their internal R&D operations to CROs.
- More than two-thirds of the contract research service providers are based in North America and Europe; most of these players are small and mid-sized companies.
- In order to gain a competitive edge, companies are actively expanding their existing capabilities in order to further augment their respective offerings and also comply with evolving industry benchmarks.
- Over 8,000 product candidates are currently being evaluated / under development biologic drug developers, presenting opportunities in the biologics contract research organization market.
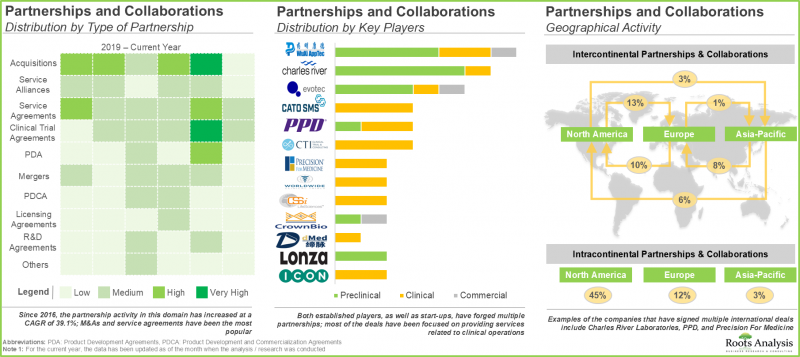
- The growing interest of stakeholders in this field is also reflected in the increase in partnership activity in the recent past; since 2016, industry players have signed multiple deals with sponsor and / or other CROs.
- Close to 20% of the CROs provide research services for biologics at the clinical and preclinical scales.
- With the rising demand for one-stop shops, industry stakeholders are actively consolidating their capabilities related to biopharmaceutical research, mostly through mergers and acquisitions, and internal expansions.
- The market is expected to grow at a CAGR of ~13% in the coming decade; the opportunity is likely to be well distributed across therapeutic areas, scales of operation, types of biologics, end users and geographical regions.
Biologics Contract Research Organization Market: Key Segments
Clinical Segment is Likely to Hold the Highest Share in the Biologics Contract Research Organization Market
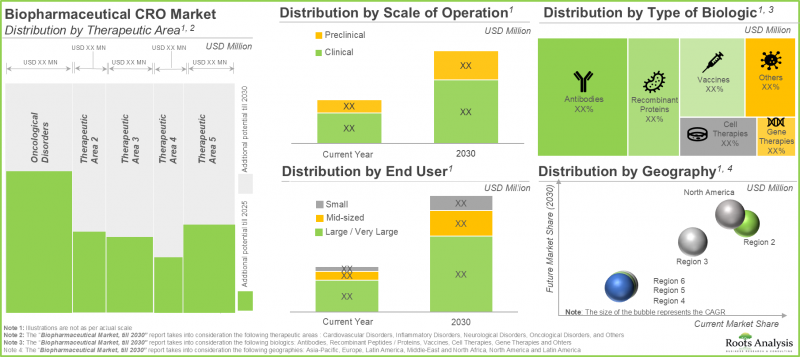
In terms of the scale of operation, the global market for biologics contract research organization market is segmented into discovery, preclinical and clinical. Currently, majority share of the share is captured by clinical scale of operation, followed by preclinical and discovery segments.
North America is Anticipated to Capture the Maximum Biologics Contract Research Organization Market Share
In terms of geographical regions, the global market is segmented into North America, Europe and Asia-Pacific. Amongst these, North America is likely to capture majority (50%) of the market share, followed by Europe (32%) and Asia-Pacific (16%).
Example Players in the Biologics Contract Research Organization Market
- Biocon
- Covance
- ICON
- Medpace
- Pharmaron
- PPD
- PRA Health Sciences
- Syneos Health
- Vimta Labs
- WuXi AppTec
Biologics Contract Research Organization Market: Research Coverage
- Market Sizing and Opportunity Analysis: The report features an in-depth analysis of the global biologics contract research organization market, focusing on key market segments, including [A] type of biologic, [B] scale of operation, [C] therapeutic area and [D] geography.
- Market Landscape: A comprehensive evaluation of the biopharmaceutical services market, based on several relevant parameters, such as [A] year of establishment, [B] company size, [C] location of headquarters, [D] types of biologics manufactured, [E] scale of operation and [F] types of services offered (including clinical services and preclinical services).
- Company Profiles: In-depth profiles of CROs engaged in offering biopharmaceutical related services, focusing on [A] overview of the company, [B] financial information (if available), [C] service portfolio and [D] recent developments and an informed future outlook.
- Benchmarking Analysis: A comprehensive benchmark analysis of players engaged in biologics contract research organization market based on the [A] capabilities of companies within a peer group with an aim to gain a competitive edge.
- Partnerships and Collaborations: An insightful analysis of the deals inked by stakeholders in the biologics contract research organization market, based on several parameters, such as [A] year of partnership, [B] type of partnership, [C] most active players (in terms of number of partnerships signed), [D] scale of operation and [E] geography.
- Mergers and Acquisitions: An in-depth analysis of the mergers and acquisitions undertaken in this domain, based on relevant parameters, such as [A] year of acquisition, [B] type of collaboration, [C] geography, [D] most active acquirers, [E] ownership change matrix, [F] key value drivers and [G] acquisition deal multiples.
- Attractiveness Competitiveness Matrix: A comprehensive acquisition target analysis, considering the historical trend of the activity of companies that have acquired other firms since 2016, and providing a means for other industry players to identify potential acquisition targets.
- SWOT Analysis: An analysis of industry affiliated trends, opportunities and challenges, which are likely to impact the evolution of biologics contract research organization market; it includes a Harvey ball analysis, assessing the relative impact of each SWOT parameter on industry dynamics.
Key Questions Answered in this Report
- How many companies are currently engaged in this market?
- Which are the leading companies in this market?
- What factors are likely to influence the evolution of this market?
- What is the current and future market size?
- What is the CAGR of this market?
- How is the current and future market opportunity likely to be distributed across key market segments?
Reasons to Buy this Report
- The report provides a comprehensive market analysis, offering detailed revenue projections of the overall market and its specific sub-segments. This information is valuable to both established market leaders and emerging entrants.
- Stakeholders can leverage the report to gain a deeper understanding of the competitive dynamics within the market. By analyzing the competitive landscape, businesses can make informed decisions to optimize their market positioning and develop effective go-to-market strategies.
- The report offers stakeholders a comprehensive overview of the market, including key drivers, barriers, opportunities, and challenges. This information empowers stakeholders to stay abreast of market trends and make data-driven decisions to capitalize on growth prospects.
Additional Benefits
- Complimentary PPT Insights Packs
- Complimentary Excel Data Packs for all Analytical Modules in the Report
- 15% Free Content Customization
- Detailed Report Walkthrough Session with Research Team
- Free Updated report if the report is 6-12 months old or older
TABLE OF CONTENTS
1. PREFACE
- 1.1. Scope of the Report
- 1.2. Research Methodology
- 1.2.1. Research Assumptions
- 1.2.2. Project Methodology
- 1.2.3. Forecast Methodology
- 1.2.4. Robust Quality Control
- 1.2.5. Key Considerations
- 1.2.5.1. Demographics
- 1.2.5.2. Economic Factors
- 1.2.5.3. Government Regulations
- 1.2.5.4. Supply Chain
- 1.2.5.5. COVID Impact / Related Factors
- 1.2.5.6. Market Access
- 1.2.5.7. Healthcare Policies
- 1.2.5.8. Industry Consolidation
- 1.3 Key Questions Answered
- 1.4. Chapter Outlines
2. EXECUTIVE SUMMARY
3. INTRODUCTION
3 Introduction
- 3.1. Chapter Overview
- 3.2. Overview of Biologics
- 3.2.1. Types of Biologics
- 3.3. Overview of Contract Research Organizations (CROs)
- 3.4. Evolution of CROs
- 3.5. Classification of CROs
- 3.6. Services Offered by CROs
- 3.7. Advantages of Outsourcing Operations to CROs
- 3.8. Risks Associated with Outsourcing Operations to CROs
4. GUIDE TO OUTSOURCING
- 4.1. Chapter Overview
- 4.2. Outsourcing Biologics Research
- 4.3. Models of Outsourcing
- 4.3.1. Transactional Outsourcing Model
- 4.3.2. Performance / Outcome-based Business Model
- 4.3.3. Staff Augmentation Model
- 4.3.4. Phase-Dependent Outsourcing Model
- 4.4. Selecting an Appropriate Outsourcing Model
- 4.4.1. Hybrid Approach
- 4.5. Selecting a CRO Partner
- 4.5.1. Key Considerations for Outsourcing Biologics-related Operations
- 4.6. Role of CROs in the Drug Development Process
- 4.6.1. Discovery and Preclinical Research
- 4.6.2. Early Clinical Research
- 4.6.3. Clinical Research and Laboratory Services
- 4.7. Conclusion
5. MARKET LANDSCAPE
- 5.1. Chapter Overview
- 5.2. Biopharmaceutical CROs: Overall Market Landscape
- 5.2.1. Analysis by Year of Establishment, Company Size and Location of Headquarters
- 5.2.2. Analysis by Scale of Operation
- 5.3. Preclinical Biopharmaceutical CROs
- 5.3.1. Analysis by Year of Establishment
- 5.3.2. Analysis by Company Size
- 5.3.3. Analysis by Location of Headquarters
- 5.3.4. Analysis by Type of Biologic
- 5.3.5. Analysis by Type of Services Offered
- 5.4. Clinical Biopharmaceutical CROs
- 5.4.1. Analysis by Year of Establishment
- 5.4.2. Analysis by Company Size
- 5.4.3. Analysis by Location of Headquarters
- 5.4.4. Analysis by Type of Biologics
- 5.4.5. Analysis by Type of Services Offered
6. COMPANY PROFILES
- 6.1. Chapter Overview
- 6.2. Biocon
- 6.2.1. Company Overview
- 6.2.2. Financial Information
- 6.2.3. Services Portfolio
- 6.2.4. Future Outlook
- 6.3. Covance
- 6.3.1. Company Overview
- 6.3.2. Service Portfolio
- 6.3.3. Financial Information
- 6.3.4. Future Outlook
- 6.4. ICON
- 6.4.1. Company Overview
- 6.4.2. Financial Information
- 6.4.3. Service Portfolio
- 6.4.4. Future Outlook
- 6.5. Medpace
- 6.5.1. Company Overview
- 6.5.2. Financial Information
- 6.5.3. Service Portfolio
- 6.5.4. Future Outlook
- 6.6. Pharmaron
- 6.6.1. Company Overview
- 6.6.2. Services Portfolio
- 6.6.3. Future Outlook
- 6.7. PPD
- 6.7.1. Company Overview
- 6.7.2. Service Portfolio
- 6.7.3. Financial Information
- 6.7.4. Future Outlook
- 6.8. PRA Health Sciences
- 6.8.1. Company Overview
- 6.8.2. Financial Information
- 6.8.3. Service Portfolio
- 6.8.4. Future Outlook
- 6.9. Syneos Health
- 6.9.1. Company Overview
- 6.9.2. Financial Information
- 6.9.3. Services Portfolio
- 6.9.4. Future Outlook
- 6.10. Vimta Labs
- 6.10.1. Company Overview
- 6.10.2. Services Portfolio
- 6.10.3. Financial Information
- 6.10.4. Future Outlook
- 6.11. WuXi AppTec
- 6.11.1. Company Overview
- 6.11.2. Financial Information
- 6.11.3. Service Portfolio
- 6.11.4. Future Outlook
7. BENCHMARK ANALYSIS
- 7.1. Chapter Overview
- 7.2. Methodology
- 7.3. Benchmark Analysis: Peer Groups
- 7.3.1. Peer Group I
- 7.3.2. Peer Group II
- 7.3.3. Peer Group III
- 7.3.4. Peer Group IV
- 7.3.5. Peer Group V
- 7.3.6. Peer Group VI
- 7.3.7. Peer Group VII
- 7.3.8. Peer Group VIII
8. PARTNERSHIPS AND COLLABORATIONS
- 8.1. Chapter Overview
- 8.2. Partnership Models
- 8.3. Biopharmaceutical CROs: Recent Partnerships and Collaborations
- 8.3.1. Analysis by Year of Partnership
- 8.3.2. Analysis by Type of Partnership Model
- 8.3.2.1. Analysis by Year of Partnership and Type of Partnership Model
- 8.3.3. Most Active Players: Analysis by Number of Partnerships
- 8.3.4. Analysis by Scale of Operation
- 8.3.5. Analysis by Geography
- 8.3.5.1. Country-wise Analysis
- 8.3.5.2. Intercontinental and Intracontinental Agreements
9. MERGERS AND ACQUISITIONS
- 9.1. Chapter Overview
- 9.2. Merger and Acquisition Models
- 9.3. Biopharmaceutical CROs: Mergers and Acquisitions
- 9.3.1. Analysis by Year of Acquisition
- 9.3.2. Analysis by Type of Collaboration
- 9.3.3. Analysis by Geography
- 9.3.3.1. Continent-wise Distribution
- 9.3.3.2. Country-wise Distribution
- 9.3.4. Ownership Change Matrix
- 9.3.5. Most Active Acquirers: Analysis by Number of Acquisitions
- 9.4. Distribution by Key Value Drivers
- 9.4.1. Analysis by Key Value Drivers
- 9.4.2. Analysis by Key Value Drivers and Year of Acquisitions
- 9.5. Valuation Analysis: Acquisition Deal Multiples
10. ATTRACTIVENESS COMPETATIVENESS MATRIX
- 10.1. Chapter Overview
- 10.2. AC Matrix: Overview
- 10.2.1. Strong Business Segment
- 10.2.2. Average Business Segment
- 10.2.3. Weak Business Segment
- 10.3. Analytical Methodology
- 10.4. AC Matrix: Contract Manufacturing Scenario in North America
- 10.5. AC Matrix: Contract Manufacturing Scenario in Europe
- 10.6. AC Matrix: Contract Manufacturing Scenario in Asia Pacific and Middle East
11. MARKET FORECAST
- 11.1. Chapter Overview
- 11.2. Forecast Methodology and Key Assumptions
- 11.3. Global Biopharmaceutical CROs Market
- 11.3.1. Global Biopharmaceutical CROs Market: Distribution by Types of Biologics
- 11.3.2. Global Biopharmaceutical CROs Market: Distribution by Therapeutic Area
- 11.3.3. Global Biopharmaceutical CROs Market: Distribution by Scale of Operation
- 11.3.4. Global Biopharmaceutical CROs Market: Distribution by Geography
- 11.4. Biopharmaceutical CROs Market in North America
- 11.4.1. Biopharmaceutical CROs Market in North America: Distribution by Therapeutic Area
- 11.4.1.1. Biopharmaceutical CROs Market for Oncological Disorders in North America, Till 2035
- 11.4.1.2. Biopharmaceutical CROs Market for Cardiovascular Disorders in North America, Till 2035
- 11.4.1.3. Biopharmaceutical CROs Market for Inflammatory Disorders in North America, Till 2035
- 11.4.1.4. Biopharmaceutical CROs Market for Neurological Disorders in North America, Till 2035
- 11.4.1.5. Biopharmaceutical CROs Market for Other Therapeutic Areas in North America, Till 2035
- 11.4.2. Biopharmaceutical CROs Market in North America: Distribution by Scale of Operation
- 11.4.2.1. Biopharmaceutical CROs Market for Preclinical Operations in North America, Till 2035
- 11.4.2.2. Biopharmaceutical CROs Market for Clinical Operations in North America, Till 2035
- 11.4.1. Biopharmaceutical CROs Market in North America: Distribution by Therapeutic Area
- 11.5. Biopharmaceutical CRO Services Market in Europe
- 11.5.1. Biopharmaceutical CRO Services Market: Distribution by Therapeutic Area in Europe
- 11.5.1.1. Biopharmaceutical CRO Services Market for Oncological Disorders in Europe, Till 2035
- 11.5.1.2. Biopharmaceutical CRO Services Market for Cardiovascular Disorders in Europe, Till 2035
- 11.5.1.3. Biopharmaceutical CRO Services Market for Inflammatory Disorders in Europe, Till 2035
- 11.5.1.4. Biopharmaceutical CRO Services Market for Neurological Disorders in Europe, Till 2035
- 11.5.1.5. Biopharmaceutical CRO Services Market for Other Therapeutic Areas in Europe, Till 2035
- 11.5.2. Biopharmaceutical CRO Services Market: Distribution by Scale of Operation in Europe
- 11.5.2.1. Biopharmaceutical CRO Services Market for Preclinical Operations in Europe, Till 2035
- 11.5.2.2. Biopharmaceutical CRO Services Market for Clinical Operations in Europe, Till 2035
- 11.5.1. Biopharmaceutical CRO Services Market: Distribution by Therapeutic Area in Europe
- 11.6. Biopharmaceutical CRO Services Market in Asia-Pacific
- 11.6.1. Biopharmaceutical CRO Services Market: Distribution by Therapeutic Area in Asia-Pacific
- 11.6.1.1. Biopharmaceutical CRO Services Market for Oncological Disorders in Asia-Pacific, Till 2035
- 11.6.1.2. Biopharmaceutical CRO Services Market for Cardiovascular Disorders in Asia-Pacific, Till 2035
- 11.6.1.3. Biopharmaceutical CRO Services Market for Inflammatory Disorders in Asia-Pacific, Till 2035
- 11.6.1.4. Biopharmaceutical CRO Services Market for Neurological Disorders in Asia-Pacific, Till 2035
- 11.6.1.5. Biopharmaceutical CRO Services Market for Other Therapeutic Areas in Asia-Pacific, Till 2035
- 11.6.2. Biopharmaceutical CRO Services Market: Distribution by Scale of Operation in Asia-Pacific
- 11.6.2.1. Biopharmaceutical CRO Services Market for Preclinical Operations in Asia-Pacific, Till 2035
- 11.6.2.2. Biopharmaceutical CRO Services Market for Clinical Operations in Asia-Pacific, Till 2035
- 11.6.1. Biopharmaceutical CRO Services Market: Distribution by Therapeutic Area in Asia-Pacific
- 11.7. Biopharmaceutical CRO Services Market in Latin America
- 11.8. Biopharmaceutical CRO Services Market in Middle East North America
12. SWOT ANALYSIS
- 12.1. Chapter Overview
- 12.2. Strengths
- 12.3. Weaknesses
- 12.4. Opportunities
- 12.5. Threats
- 12.6. Comparison of SWOT Factors
13. CONCLUDING REMARKS
- 13.1. Chapter Overview
14. SURVEY TRANSCRIPTS
15. APPENDIX I: TABULATED DATA
16. APPENDIX II: LIST OF COMPANIES AND ORGANIZATIONS
List of Tables
- Table 4.1 Attributes of Transactional Outsourcing Based Business Model
- Table 4.2 Comparison of Key Factors Considered by Biologic Developers for Selecting a CRO Partner: Harvey Ball Analysis
- Table 5.1 Biopharmaceutical CROs: Information on Year of Establishment, Location of Headquarters, Company Size and Types of Biologics
- Table 5.2 Biopharmaceutical Preclinical CROs: Information on Types of Services Offered
- Table 5.3 Biopharmaceutical Clinical CROs: Information on Types of Services Offered
- Table 6.1 Biocon: Company Overview
- Table 6.2 Biocon: Future Outlook
- Table 6.3 Covance: Company Overview
- Table 6.4 Covance: Future Outlook
- Table 6.5 ICON: Company Overview
- Table 6.6 ICON: Future Outlook
- Table 6.7 Medpace: Company Overview
- Table 6.8 Medpace: Future Outlook
- Table 6.9 Pharmaron: Company Overview
- Table 6.10 Pharmaron: Future Outlook
- Table 6.11 PPD: Company Overview
- Table 6.12 PPD: Future Outlook
- Table 6.13 PRA Health Sciences: Company Overview
- Table 6.14 PRA Health Sciences: Future Outlook
- Table 6.15 Syneos Health: Company Overview
- Table 6.16 Syneos Health: Future Outlook
- Table 6.17 VIMTA Labs: Company Overview
- Table 6.18 WuXi App-Tec: Company Overview
- Table 6.19 WuXi App Tec: Future Outlook
- Table 7.1 Benchmark Analysis: Peer Groups
- Table 8.1 Partnerships and Collaborations: List of Agreements, Since 2016
- Table 9.1 Mergers and Acquisitions: List of Mergers / Acquisitions, Since 2016
- Table 9.2 Mergers and Acquisitions: Information on Key Value Drivers, Since 2016
- Table 9.3 Mergers and Acquisitions: Deal Multiples, Since 2016
- Table 15.1 Biopharmaceutical CROs: Distribution by Year of Establishment, Company Size and Location of Headquarters
- Table 15.2 Biopharmaceutical CROs: Distribution by Scale of Operation
- Table 15.3 Biopharmaceutical Preclinical CROs: Distribution by Year of Establishment
- Table 15.4 Biopharmaceutical Preclinical CROs: Distribution by Company Size
- Table 15.5 Biopharmaceutical Preclinical CROs Distribution by Location of Headquarters
- Table 15.6 Biopharmaceutical Preclinical CROs: Distribution by Types of Biologics
- Table 15.8 Biopharmaceutical Preclinical CROs: Distribution by Types of Services Offered
- Table 15.9 Biopharmaceutical Preclinical CROs: Distribution by Number of Services Offered
- Table 15.10 Biopharmaceutical Preclinical CROs: Distribution by Types of Biologics and Types Services Offered
- Table 15.11 Biopharmaceutical Clinical CROs: Distribution by Year of Establishment
- Table 15.12 Biopharmaceutical Clinical CROs: Distribution by Company Size
- Table 15.13 Biopharmaceutical Clinical CROs: Distribution by Location of Headquarters
- Table 15.14 Biopharmaceutical Clinical CROs: Distribution by Types of Biologics
- Table 15.15 Biopharmaceutical Clinical CROs: Distribution by Types of Services Offered
- Table 15.16 Biopharmaceutical Clinical CROs: Distribution by Number of Services Offered
- Table 15.17 Biopharmaceutical Clinical CROs: Distribution by Types of Biologics and Types of Services Offered
- Table 15.18 Biocon: Annual Service Revenues, Since 2016 (INR Billion)
- Table 15.19 Covance: Annual Service Revenues, Since 2016 (USD Billion)
- Table 15.20 ICON: Annual Revenues, Since 2016 (USD Billion)
- Table 15.21 Medpace: Annual Service Revenues, Since 2016 (USD Billion)
- Table 15.22 PPD: Annual Service Revenues, Since 2016 (USD Billion)
- Table 15.23 PRA Health Sciences: Annual Revenues, Since 2016 (USD Billion)
- Table 15.24 Syneos: Annual Service Revenues, Since 2016 (USD Billion)
- Table 15.25 Vimta Labs: Annual Service Revenues, Since 2016 (INR Billion)
- Table 15.26 WuXi AppTec: Annual Service Revenues, Since 2016 (USD Billion)
- Table 15.27 Partnerships and Collaborations: Distribution by Year of Partnership
- Table 15.28 Partnerships and Collaborations: Distribution by Type of Partnership Model
- Table 15.29 Partnerships and Collaborations: Distribution by Year of Partnership and Type of Partnership Model
- Table 15.30 Most Active Players: Distribution by Number of Partnerships
- Table 15.31 Partnerships and Collaborations: Distribution by Scale of Operation
- Table 15.32 Partnerships and Collaborations: Distribution by Geography
- Table 15.33 Partnerships and Collaborations: Country-Wise Distribution
- Table 15.34 Partnerships and Collaborations: Intercontinental and Intracontinental Agreements
- Table 15.35 Mergers and Acquisitions: Distribution by Year of Merger / Acquisition (Since 2016)
- Table 15.36 Mergers and Acquisitions: Distribution by Type of Merger / Acquisition
- Table 15.37 Mergers and Acquisitions: Distribution by Year and Type of Agreement
- Table 15.38 Mergers and Acquisitions: Continent-wise Distribution
- Table 15.39 Mergers and Acquisitions: Continent-wise Distribution
- Table 15.40 Mergers and Acquisitions: Country-wise Distribution
- Table 15.41 Mergers and Acquisitions: Ownership Change Matrix
- Table 15.42 Mergers and Acquisitions: Key Value Drivers
- Table 15.43 Mergers and Acquisitions: Distribution by Year of Acquisition and Key Value Drivers
- Table 15.44 Mergers and Acquisitions: Deal Multiples Based on Revenue
- Table 15.45 Mergers and Acquisitions: Deal Multiples Based on Year of Experience
- Table 15.46 Global Biopharmaceutical CROs Market: Distribution by Types of Biologics
- Table 15.47 Global Biopharmaceutical CROs Market: Distribution by Therapeutic Area
- Table 15.48 Global Biopharmaceutical CROs Market: Distribution by Scale of Operation
- Table 15.49 Global Biopharmaceutical CROs Market: Distribution by Geography
- Table 15.50 Biopharmaceutical CROs Market in North America, Conservative, Base and Optimistic Scenarios, Till 2035 (USD Million)
- Table 15.51 Biopharmaceutical CROs Market for Oncological Disorders in North America, Conservative, Base and Optimistic Scenarios, Till 2035 (USD Million)
- Table 15.52 Biopharmaceutical CROs Market for Cardiovascular Disorders in North America, Conservative, Base and Optimistic Scenarios, Till 2035 (USD Million)
- Table 15.53 Biopharmaceutical CROs Market for Inflammatory Disorders in North America, Conservative, Base and Optimistic Scenarios, Till 2035 (USD Million)
- Table 15.54 Biopharmaceutical CROs Market for Neurological Disorders in North America, Conservative, Base and Optimistic Scenarios, Till 2035 (USD Million)
- Table 15.55 Biopharmaceutical CROs Market for Other Therapeutic Areas in North America, Conservative, Base and Optimistic Scenarios, Till 2035 (USD Million)
- Table 15.56 Biopharmaceutical CROs Market for Preclinical Operations in North America, Conservative, Base and Optimistic Scenarios, Till 2035 (USD Million)
- Table 15.57 Biopharmaceutical CROs Market for Clinical Operations in North America, Conservative, Base and Optimistic Scenarios, Till 2035 (USD Million)
- Table 15.58 Biopharmaceutical CROs Market in Europe, Till 2035 (USD Million)
- Table 15.59 Biopharmaceutical CROs Market for Oncological Disorders in Europe, Conservative, Base and Optimistic Scenarios, Till 2035 (USD Million)
- Table 15.60 Biopharmaceutical CROs Market for Cardiovascular Disorders in Europe, Till 2035 (USD Million)
- Table 15.61 Biopharmaceutical CROs Market for Inflammatory Disorders in Europe, Conservative, Base and Optimistic Scenarios, Till 2035 (USD Million)
- Table 15.62 Biopharmaceutical CROs Market for Neurological Disorders in Europe, Conservative, Base and Optimistic Scenarios, Till 2035 (USD Million)
- Table 15.63 Biopharmaceutical CROs Market for Other Therapeutic Areas in Europe, Conservative, Base and Optimistic Scenarios, Till 2035 (USD Million)
- Table 15.64 Biopharmaceutical CROs Market for Preclinical Operations in Europe, Conservative, Base and Optimistic Scenarios, Till 2035 (USD Million)
- Table 15.65 Biopharmaceutical CROs Market for Clinical Operations in Europe, Conservative, Base and Optimistic Scenarios, Till 2035 (USD Million)
- Table 15.66 Biopharmaceutical CROs Market in Asia-Pacific, Conservative, Base and Optimistic Scenarios, Till 2035 (USD Million)
- Table 15.67 Biopharmaceutical CROs Market for Oncological Disorders in Asia-Pacific, Conservative, Base and Optimistic Scenarios, Till 2035 (USD Million)
- Table 15.68 Biopharmaceutical CROs Market for Cardiovascular Disorders in Asia-Pacific, Conservative, Base and Optimistic Scenarios, Till 2035 (USD Million)
- Table 15.69 Biopharmaceutical CROs Market for Inflammatory Disorders in Asia-Pacific, Conservative, Base and Optimistic Scenarios, Till 2035 (USD Million)
- Table 15.70 Biopharmaceutical CROs Market for Neurological Disorders in Asia-Pacific, Conservative, Base and Optimistic Scenarios, Till 2035 (USD Million)
- Table 15.71 Biopharmaceutical CROs Market for Other Therapeutic Areas in Asia-Pacific, Conservative, Base and Optimistic Scenarios, Till 2035 (USD Million)
- Table 15.72 Biopharmaceutical CROs Market for Preclinical Operations in Asia-Pacific, Conservative, Base and Optimistic Scenarios, Till 2035 (USD Million)
- Table 15.73 Biopharmaceutical CROs Market for Clinical Operations in Asia-Pacific, Conservative, Base and Optimistic Scenarios, Till 2035 (USD Million)
- Table 15.74 Biopharmaceutical CROs Market for Preclinical Operations in Latin America, Conservative, Base and Optimistic Scenarios, Till 2035 (USD Million)
- Table 15.75 Biopharmaceutical CROs Market for Preclinical Operations in Middle East North Africa, Conservative, Base and Optimistic Scenarios, Till 2035 (USD Million)
- Table 15.76 Biopharmaceutical CROs Market: Conservative, Base and Optimistic Scenarios (USD Million)
List of Figures
- Figure 3.1 Types of Biologics
- Figure 3.2 Stages of the Drug Development Process
- Figure 3.3 Commonly Offered Services by CROs
- Figure 3.4 Advantages of Outsourcing Operations to CROs
- Figure 3.5 Risks Associated with Outsourcing Operations to CROs
- Figure 4.1 Guiding Models for Outsourcing
- Figure 4.2 Key Characteristics of Transactional Outsourcing Model
- Figure 4.3 Key Characteristics of Performance / Outcome based Business Model
- Figure 4.4 Steps to Consider before Outsourcing
- Figure 4.5 Key Considerations while Selecting a CRO Partner
- Figure 4.6 Role of CROs in the Drug Development Process
- Figure 5.1 Biopharmaceutical CROs: Distribution by Year of Establishment, Company Size and Location of Headquarters
- Figure 5.2 Biopharmaceutical CROs: Distribution by Scale of Operation
- Figure 5.3 Biopharmaceutical Preclinical CROs: Distribution by Year of Establishment
- Figure 5.4 Biopharmaceutical Preclinical CROs: Distribution by Company Size
- Figure 5.5 Biopharmaceutical Preclinical CROs Distribution by Location of Headquarters
- Figure 5.6 Biopharmaceutical Preclinical CROs: Distribution by Types of Biologics
- Figure 5.7 Biopharmaceutical Preclinical CROs: Distribution by Types of Services Offered
- Figure 5.8 Biopharmaceutical Preclinical CROs: Distribution by Number of Services Offered
- Figure 5.9 Biopharmaceutical Preclinical CROs: Distribution by Types of Biologics and Types of Services Offered
- Figure 5.10 Biopharmaceutical Clinical CROs: Distribution by Year of Establishment
- Figure 5.11 Biopharmaceutical Clinical CROs: Distribution by Company Size
- Figure 5.12 Biopharmaceutical Clinical CROs: Distribution by Location of Headquarters
- Figure 5.13 Biopharmaceutical Clinical CROs: Distribution by Types of Biologics
- Figure 5.14 Biopharmaceutical Clinical CROs: Distribution by Types of Services Offered
- Figure 5.15 Biopharmaceutical Clinical CROs: Distribution by Number of Services Offered
- Figure 5.16 Biopharmaceutical Clinical CROs: Distribution by Types of Biologics and Types of Services Offered
- Figure 6.1 Biocon: Annual Services Revenues, Since 2016 (INR Billion)
- Figure 6.2 Biocon: Service Portfolio
- Figure 6.3 Covance: Annual Services Revenues, Since 2016 (USD Billion)
- Figure 6.4 Covance: Service Portfolio
- Figure 6.5 ICON: Annual Revenues, Since 2016 (USD Billion)
- Figure 6.6 ICON: Service Portfolio
- Figure 6.7 Medpace: Annual Services Revenues, Since 2016 (USD Billion)
- Figure 6.8 Medpace: Service Portfolio
- Figure 6.9 Medpace: Regulatory Affair Capabilities
- Figure 6.10 Pharmaron: Service Portfolio
- Figure 6.11 PPD: Annual Services Revenues, Since 2016 (USD Billion)
- Figure 6.12 PPD: Service Portfolio
- Figure 6.13 PRA Health Sciences: Annual Revenues, Since 2016 (USD Billion)
- Figure 6.14 PRA Health Sciences: Service Portfolio
- Figure 6.15 Syneos Health: Annual Services Revenues, Since 2016 (USD Billion)
- Figure 6.16 Syneos Health: Service Portfolio
- Figure 6.17 Vimta Labs: Annual Service Revenues, Since 2016 (INR Billion)
- Figure 6.18 Vimta Labs: Service Portfolio
- Figure 6.19 WuXi App Tec: Annual Services Revenues, Since 2016 (USD Billion)
- Figure 6.20 WuXi App Tec: Service Portfolio
- Figure 7.1 Benchmark Analysis: Distribution by Company Size and Location of Headquarters
- Figure 7.2 Benchmark Analysis: Peer Group I
- Figure 7.3 Benchmark Analysis: Peer Group II
- Figure 7.4 Benchmark Analysis: Peer Group III
- Figure 7.5 Benchmark Analysis: Peer Group IV
- Figure 7.6 Benchmark Analysis: Peer Group V
- Figure 7.7 Benchmark Analysis: Peer Group VI
- Figure 7.8 Benchmark Analysis: Peer Group VII
- Figure 7.9 Benchmark Analysis: Peer Group VIII
- Figure 8.1 Partnerships and Collaborations: Distribution by Year of Partnership
- Figure 8.2 Partnerships and Collaborations: Distribution by Type of Partnership Model
- Figure 8.3 Partnerships and Collaborations: Distribution by Year of Partnership and Type of Partnership Model
- Figure 8.4 Most Active Players: Distribution by Number of Partnerships
- Figure 8.5 Partnerships and Collaborations: Distribution by Scale of Operation
- Figure 8.6 Partnerships and Collaborations: Distribution by Geography
- Figure 8.7 Partnerships and Collaborations: Country-Wise Distribution
- Figure 8.8 Partnerships and Collaborations: Intercontinental and Intracontinental Agreements
- Figure 9.1 Mergers and Acquisitions: Distribution by Year of Merger / Acquisition (Since 2016)
- Figure 9.2 Mergers and Acquisitions: Distribution by Type of Merger / Acquisition
- Figure 9.3 Mergers and Acquisitions: Distribution by Year and Type of Merger / Acquisition
- Figure 9.4 Mergers and Acquisitions: Continent-wise Distribution
- Figure 9.5 Mergers and Acquisitions: Region-wise Distribution
- Figure 9.6 Mergers and Acquisitions: Country-wise Distribution
- Figure 9.7 Mergers and Acquisitions: Ownership Change Matrix
- Figure 9.8 Mergers and Acquisitions: Key Value Drivers
- Figure 9.9 Mergers and Acquisitions: Distribution by Year of Acquisition and Key Value Drivers
- Figure 9.10 Mergers and Acquisitions: Deal Multiples Based on Revenue
- Figure 9.11 Mergers and Acquisitions: Deal Multiples Based on Year of Experience
- Figure 10.1. AC Matrix: Pictorial Representation
- Figure 10.2. AC Matrix: Positioning of Different Biologics in North America
- Figure 10.3. AC Matrix: Positioning of Different Biologics in Europe
- Figure 10.4. AC Matrix: Positioning of Different Biologics in Asia Pacific
- Figure 11.1 Biopharmaceutical CROs: Market Forecast Methodology
- Figure 11.2 Global Biopharmaceutical CROs Market, Till 2035
- Figure 11.3 Global Biopharmaceutical CROs Market: Distribution by Types of Biologics
- Figure 11.4 Global Biopharmaceutical CROs Market: Distribution by Therapeutic Area
- Figure 11.5 Global Biopharmaceutical CROs Market: Distribution by Scale of Operation
- Figure 11.6 Global Biopharmaceutical CROs Market: Distribution by Geography
- Figure 11.7 Biopharmaceutical CROs Market in North America, Till 2035 (USD Million)
- Figure 11.8 Biopharmaceutical CROs Market for Oncological Disorders in North America, Till 2035 (USD Million)
- Figure 11.9 Biopharmaceutical CROs Market for Cardiovascular Disorders in North America, Till 2035 (USD Million)
- Figure 11.10 Biopharmaceutical CROs Market for Inflammatory Disorders in North America, Till 2035 (USD Million)
- Figure 11.11 Biopharmaceutical CROs Market for Neurological Disorders in North America, Till 2035 (USD Million)
- Figure 11.12 Biopharmaceutical CROs Market for Other Therapeutic Areas in North America, Till 2035 (USD Million)
- Figure 11.13 Biopharmaceutical CROs Market for Preclinical Operations in North America, Till 2035 (USD Million)
- Figure 11.14 Biopharmaceutical CROs Market for Clinical Operations in North America, Till 2035 (USD Million
- Figure 11.15 Biopharmaceutical CROs Market in Europe, Till 2035 (USD Million)
- Figure 11.16 Biopharmaceutical CROs Market for Oncological Disorders in Europe, Till 2035 (USD Million)
- Figure 11.17 Biopharmaceutical CROs Market for Cardiovascular Disorders in Europe, Till 2035 (USD Million)
- Figure 11.18 Biopharmaceutical CROs Market for Inflammatory Disorders in Europe, Till 2035 (USD Million)
- Figure 11.19 Biopharmaceutical CROs Market for Neurological Disorders in Europe, Till 2035 (USD Million)
- Figure 11.20 Biopharmaceutical CROs Market for Other Therapeutic Areas in Europe, Till 2035 (USD Million)
- Figure 11.21 Biopharmaceutical CROs Market for Preclinical Operations in Europe, Till 2035 (USD Million)
- Figure 11.22 Biopharmaceutical CROs Market for Clinical Operations in Europe, Till 2035 (USD Million)
- Figure 11.23 Biopharmaceutical CROs Market in Asia-Pacific, Till 2035 (USD Million)
- Figure 11.24 Biopharmaceutical CROs Market for Oncological Disorders in Asia-Pacific, Till 2035 (USD Million)
- Figure 11.25 Biopharmaceutical CROs Market for Cardiovascular Disorders in Asia-Pacific, Till 2035 (USD Million)
- Figure 11.26 Biopharmaceutical CROs Market for Inflammatory Disorders in Asia-Pacific, Till 2035 (USD Million)
- Figure 11.27 Biopharmaceutical CROs Market for Neurological Disorders in Asia-Pacific, Till 2035 (USD Million)
- Figure 11.28 Biopharmaceutical CROs Market for Other Therapeutic Areas in Asia-Pacific, Till 2035 (USD Million)
- Figure 11.29 Biopharmaceutical CROs Market for Preclinical Operations in Asia-Pacific, Till 2035 (USD Million)
- Figure 11.30 Biopharmaceutical CROs Market for Clinical Operations in Asia-Pacific, Till 2035 (USD Million)
- Figure 11.31 Biopharmaceutical CROs Market in Latin America, Till 2035 (USD Million)
- Figure 11.32 Biopharmaceutical CROs Market in Middle East North Africa, Till 2035 (USD Million)
- Figure 11.33 Biopharmaceutical CROs Market: Conservative, Base and Optimistic Scenarios (USD Million)
- Figure 12.1 Biopharmaceutical CROs SWOT Analysis: Overview
- Figure 12.2 Comparison of SWOT Factors: Harvey Ball Analysis
- Figure 13.1 Concluding Remarks: Current Market Landscape for Preclinical Biopharmaceutical CROs
- Figure 13.2 Concluding Remarks: Current Market Landscape for Clinical Biopharmaceutical CROs
- Figure 13.3 Concluding Remarks: Recent Partnerships
- Figure 13.4 Concluding Remarks: Mergers and Acquisitions
- Figure 13.5 Concluding Remarks: Clinical Trial Analysis
- Figure 13.6 Concluding Remarks: Market Sizing and Opportunity Analysis

