
PUBLISHER: Roots Analysis | PRODUCT CODE: 1891249

PUBLISHER: Roots Analysis | PRODUCT CODE: 1891249
Exoskeleton Market: Industry Trends and Global Forecasts, Till 2035 Distribution by Body Part Covered, Mode of Operation, Form of Exoskeleton, Mobility and Key Geographical Regions
Exoskeleton Market: Overview
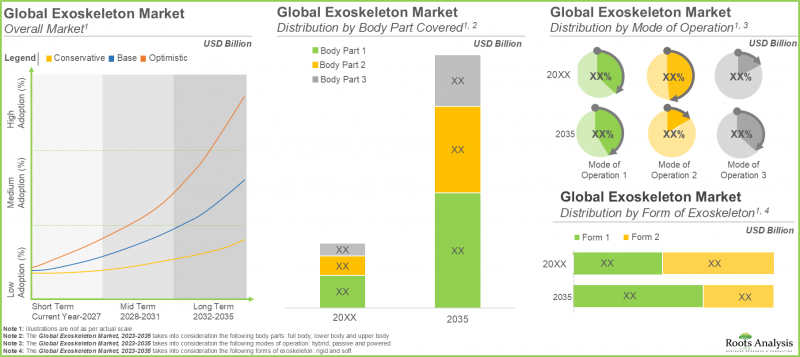
As per Roots Analysis, the global exoskeleton market is estimated to grow from USD 2.9 billion in the current year to USD 20.3 billion by 2035, at a CAGR of 22.4% during the forecast period, till 2035.
The market sizing and opportunity analysis has been segmented across the following parameters:
Body Part Covered:
- Upper Extremity
- Lower Extremity
- Full Body
Mode of Operation:
- Powered
- Passive
- Hybrid
Form:
- Powered
- Passive
- Hybrid
Mobility
- Fixed / Supported
- Mobile
End Users
- Patients
- Healthcare Providers
Key Geographical Regions
- North America
- Europe
- Asia-Pacific
- Rest of the World
Medical Exoskeleton Market: Growth and Trends
Over the years, significant advancements have occurred in robotic technologies, leading to enhanced usability of exoskeletons across different sectors for aiding and supporting humans. Especially in healthcare, these devices have demonstrated significant potential in aiding both patients and medical professionals. It is important to mention that even after decades of study and numerous possible applications, exoskeletons have not become the favored choice for stakeholders because of competition from other mobility systems and prosthetic devices often used in clinical and domestic environments.
Exoskeletons in healthcare mainly support rehabilitation, gait training, and mobility for those with spinal cord injuries (SCI), strokes, neurological conditions, or age-related disabilities. Further, demographic changes, especially in areas such as Asia-Pacific, heighten the demand for mobility improvements and elder care, with exoskeletons boosting rehabilitation results by 23% in motor function recovery at certain US clinics.
To ensure widespread approval, developers are concentrating on meeting real needs with their exoskeleton designs. They are actively seeking innovations to address issues related to cost-efficiency and user discomfort, striving to turn exoskeletons into more organic and integrated second skin solutions instead of cumbersome robotic suits. Additionally, developers are incorporating artificial intelligence and machine learning to allow devices to recognize the user's intentions and enhance human-robot interactions via suitable control algorithms. Moreover, innovations such as virtual reality (VR), augmented reality (AR), tailored games, or a mix of these methods are being implemented to improve robotic therapy by boosting patient involvement and ensuring they stay dedicated to completing their assigned exercises. Due to technological progress and continual developments in this area, exoskeleton devices are expected to have significant potential in the years to come.
Exoskeleton Market: Key Insights
The report delves into the current state of the exoskeleton market and identifies potential growth opportunities within the industry. Some key findings from the report include:
- Presently, over 200 exoskeletons are available / under development to provide support to patients with mobility impairments or reduce the risk of musculoskeletal injuries among caregivers dealing with disabled patients.
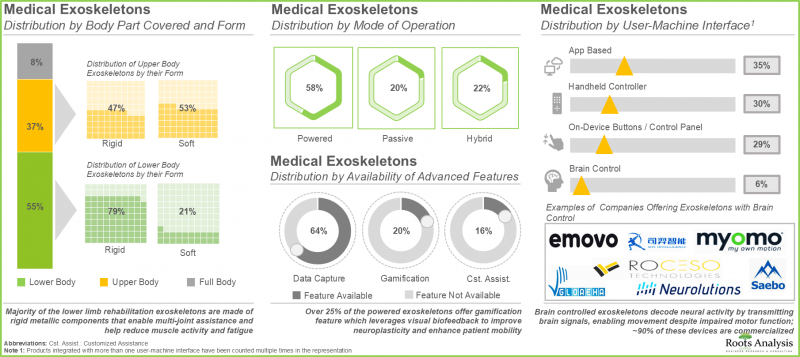
- Over 100 medical exoskeletons, both rigid and soft, cover different parts of the body and are typically operated using batteries that power the sensors and actuators; over 60% of them capture the motion metrics of patients.
- Developers of medical exoskeletons have established a global presence; more than 40% of these players are based in Europe, primarily in countries, such as Germany and Switzerland.
- With the growing demand for medical exoskeletons amongst patients, several types of strategic deals have been inked in this domain; majority (26%) of partnerships signed were distribution agreements.
- In order to increase adoption rates and maximize return on investment (ROI) for the users, developers of medical exoskeletons are striving to reduce costs while incorporating advanced features into their portfolio of devices.
- Nearly 3,800 patents related to exoskeletons have been filed / granted since 2016, indicating the substantial efforts made by researchers engaged in this domain.
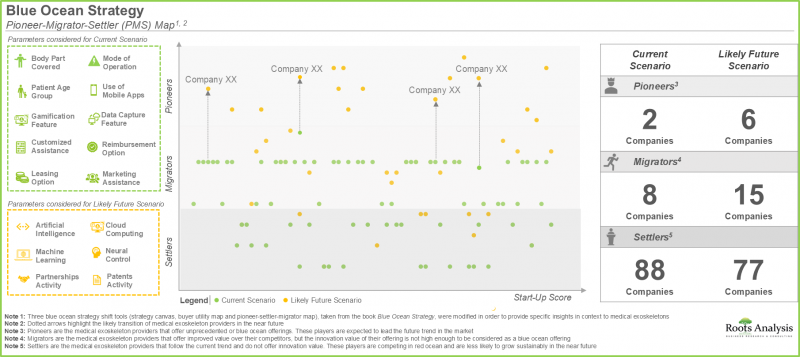
- The pioneer-migrator-settler map in blue ocean strategy analysis suggests that several medical exoskeleton developers focused on enhancing their product features are likely to emerge as pioneers in the coming years.
- In 2035, nearly 80% of the exoskeleton market is likely to be driven by the sales of rigid exoskeletons primarily supporting the lower body, in patients with muscle weaknesses or complete / partial paraplegia.
Medical Exoskeleton Market: Key Segments
Currently, Lower Body Exoskeleton Segment Occupies the Largest Share of the Medical Exoskeleton Market
In terms of the body part covered, the market is segmented into upper body exoskeletons, lower body exoskeletons and full body exoskeletons. At present, the lower body exoskeleton segment holds the maximum share of the medical exoskeleton market. This is due to the steep price of lower body exoskeletons and an increase in the number of companies providing lower body medical exoskeletons. It is worth highlighting that the exoskeleton market for full body medical exoskeletons is anticipated to grow at a higher CAGR.
Passive Exoskeletons Segment is the Fastest Growing Segment of the Exoskeleton Market During the Forecast Period
In terms of the mode of operation, the market is segmented into powered exoskeletons, passive exoskeletons and hybrid exoskeletons. The passive exoskeletons segment is expected to expand at a comparatively faster growth rate throughout the forecast period. This is due to the devices offering necessary ergonomic assistance without requiring actuators or batteries, resulting in decreased initial costs and lower maintenance expenses for the users. However, currently, the powered medical exoskeleton segment holds the maximum share of the medical exoskeleton market. This trend is unlikely to change in the near future.
Currently, Rigid Exoskeletons Segment Occupies the Largest Share of the Medical Exoskeleton Market
In terms of their form, the market is segmented into rigid exoskeletons and soft exoskeletons. Due to their extensive use, rigid exoskeletons dominate the medical exoskeleton market. It is worth noting that soft exoskeletons segment is likely to grow at a relatively higher CAGR.
Currently, Mobile Medical Exoskeletons Occupy the Largest Share of the Medical Exoskeleton Market
In terms of mobility, the market is segmented into stationary exoskeletons and mobile exoskeletons. It is worth highlighting that, at present, mobile / overground walking medical exoskeleton holds a larger share of the medical exoskeleton market. This is owing to the fact that exoskeletons enable patients to engage in activities such as standing, climbing stairs, or walking, which are vital for restoring functional independence. Moreover, mobile exoskeletons can be utilized in different settings, such as outpatient clinics, residential areas, and communal spaces, allowing patients to pursue their rehabilitation beyond conventional healthcare environments.
Currently, Patient-Focused Exoskeletons are Expected to Capture the Largest Share of the Medical Exoskeleton Market
In terms of the end-user, the market is segmented into patients and healthcare professionals. It is important to note that a significant share of the existing medical exoskeleton market is dominated by patient-oriented exoskeletons.
North America Accounts for the Largest Share of the Market
Based on key geographical regions, the market is segmented into North America, Europe, Asia-Pacific and Rest of the world. It is worth highlighting that, over the years, the market in the rest of the world is expected to grow at a higher CAGR.
Example Players in the Exoskeleton Market
- Bionic Yantra
- CYBERDYNE
- Ekso Bionics
- ExoAtlet
- Fourier Intelligence
- Gloreha
- Guangzhou Yikang Medical Equipment
- Hexar Humancare
- Hocoma
- MediTouch
- Milebot Robotics
- Myomo
- Neofect
- NextStep Robotics
- Panasonic
- ReWalk Robotics
- Rex Bionics
- Roam Robotics
- Trexo Robotics
- Tyromotion
- U&O Technologies
Primary Research Overview
The opinions and insights presented in this study were influenced by discussions conducted with multiple stakeholders. The research report features detailed transcripts of interviews held with the following industry stakeholders:
- Co-Founder and Chief Executive Officer, Company A
- Director of Business Planning and Development, Company B
- Vice President of Sales and Marketing, Company C
- Marketing and Design Manager, Company D
- Founder and Director, Company E
Medical Exoskeleton Market: Research Coverage
- Market Sizing and Opportunity Analysis: The report features an in-depth analysis of the exoskeleton market, focusing on key market segments, including [A] body part covered, [B] mode of operation, [C] mobility, [D] end users and [F] key geographical regions.
- Market Landscape: A comprehensive evaluation of medical exoskeletons, considering various parameters, such as [A] status of development, [B] body part covered, [C] mode of operation, [D] form of exoskeleton, [E] device mobility, [F] user-machine interface, [G] advanced features of exoskeleton, [H] end users, [I] patient age group, [J] exoskeleton setting for patients and [K] grant of breakthrough device designation. Additionally, it includes information on [L] exoskeleton technology / software, [M] maximum weight of exoskeleton, [N] maximum weight carrying capacity and [O] exoskeleton dimensions. Further, the chapter presents a list of players engaged in the development / commercialization of medical exoskeletons, along with information on their [P] year of establishment, [Q] company size, [R] location of headquarters, [S] company ownership, [T] additional services offered and [U] most active companies (in terms of number of medical exoskeleton offered).
- Product Competitiveness: A comprehensive competitive analysis of medical exoskeletons, examining factors, such as [A] supplier strength, [B] product competitiveness and [C] end users.
- Company Profiles (Detailed Profiles): In-depth profiles of key players offering medical exoskeletons, focusing on [A] company overviews, [B] financial information (if available), [C] product portfolio, [D] recent developments and [E] an informed future outlook.
- Company Profiles (Tabulated Profiles): Short profiles of key players offering medical exoskeletons, focusing on [A] company overviews and [B] product portfolio.
- Partnerships and Collaborations: An analysis of partnerships established in this sector, since 2017, based on several parameters, such as [A] year of partnership, [B] type of partnership (mergers and acquisitions, product development and commercialization agreements, licensing agreements, service agreements, product development and manufacturing agreements, joint ventures, manufacturing and supply agreements, and product distribution agreements), [C] type of partner (industry and non-industry), [D] business globalization and [E] most active players. This section also highlights the regional distribution of partnership activity in this market.
- Patent Analysis: Detailed analysis of various patents filed / granted based on [A] type of patent, [B] patent application year, [C] patent publication year, [D] geographical location, [E] type of applicant, [F] publication time, [G] top CPC symbols, [H] leading players (in terms of number of patents filed / granted), along with [I] a detailed patent benchmarking analysis.
- Blue Ocean Strategy: A comprehensive analysis of current and future market based on blue ocean strategy, covering a strategic plan / guide for emerging medical exoskeleton companies to help unlock an uncontested market, highlighting thirteen strategic tools that can help to shift towards blue ocean to gain a competitive edge in the market.
- Market Impact Analysis: The report analyzes various factors such as drivers, restraints, opportunities, and challenges affecting market growth.
Key Questions Answered in this Report
- How many companies are currently engaged in this market?
- What factors are likely to influence the evolution of this market?
- What is the current and future market size?
- What is the CAGR of this market?
- How is the current and future market opportunity likely to be distributed across key market segments?
Reasons to Buy this Report
- The report provides a comprehensive market analysis, offering detailed revenue projections of the overall market and its specific sub-segments. This information is valuable to both established market leaders and emerging entrants.
- Stakeholders can leverage the report to gain a deeper understanding of the competitive dynamics within the market. By analyzing the competitive landscape, businesses can make informed decisions to optimize their market positioning and develop effective go-to-market strategies.
- The report offers stakeholders a comprehensive overview of the market, including key drivers, barriers, opportunities, and challenges. This information empowers stakeholders to stay abreast of market trends and make data-driven decisions to capitalize on growth prospects.
Additional Benefits
- Complimentary PPT Insights Packs
- Complimentary Excel Data Packs for all Analytical Modules in the Report
- 15% Free Content Customization
- Detailed Report Walkthrough Session with Research Team
- Free Updated report if the report is 6-12 months old or older
TABLE OF CONTENTS
1. PREFACE
- 1.1. Introduction
- 1.2. Key Market Insights
- 1.3. Scope of the Report
- 1.4. Research Methodology
- 1.5. Key Questions Answered
- 1.6. Chapter Outlines
2. RESEARCH METHODOLOGY
- 2.1. Chapter Overview
- 2.2. Research Assumptions
- 2.3. Project Methodology
- 2.4. Forecast Methodology
- 2.5. Robust Quality Control
- 2.6. Key Market Segmentations
- 2.7. Key Considerations
- 2.7.1. Demographics
- 2.7.2. Economic Factors
- 2.7.3. Government Regulations
- 2.7.4. Supply Chain
- 2.7.5. COVID Impact / Related Factors
- 2.7.6. Market Access
- 2.7.7. Healthcare Policies
- 2.7.8. Industry Consolidation
3. ECONOMIC AND OTHER PROJECT SPECIFIC CONSIDERATIONS
- 3.1. Chapter Overview
- 3.2. Market Dynamics
- 3.2.1. Time Period
- 3.2.1.1. Historical Trends
- 3.2.1.2. Current and Forecasted Estimates
- 3.2.2. Currency Coverage
- 3.2.2.1. Overview of Major Currencies Affecting the Market
- 3.2.2.2. Impact of Currency Fluctuations on the Industry
- 3.2.3. Foreign Exchange Impact
- 3.2.3.1. Evaluation of Foreign Exchange Rates and Their Impact on Market
- 3.2.3.2. Strategies for Mitigating Foreign Exchange Risk
- 3.2.4. Recession
- 3.2.4.1. Historical Analysis of Past Recessions and Lessons Learnt
- 3.2.4.2. Assessment of Current Economic Conditions and Potential Impact on the Market
- 3.2.5. Inflation
- 3.2.5.1. Measurement and Analysis of Inflationary Pressures in the Economy
- 3.2.5.2. Potential Impact of Inflation on the Market Evolution
- 3.2.1. Time Period
4. EXECUTIVE SUMMARY
5. INTRODUCTION
- 5.1. Chapter Overview
- 5.2. Overview of Exoskeletons
- 5.3. History of Exoskeletons
- 5.4. Classification of Exoskeletons
- 5.4.1. Based on Body Part Supported
- 5.4.2. Based on Form of Exoskeleton
- 5.4.3. Based on Mode of Operation
- 5.4.4 Based on Mobility
- 5.5. Features of Exoskeletons
- 5.6. Limitations of Exoskeletons
- 5.7. Applications of Exoskeletons
- 5.8. Future Aspects of Exoskeletons
6. MEDICAL EXOSKELETONS: MARKET LANDSCAPE
- 6.1. Chapter Overview
- 6.2. Medical Exoskeletons: Overall Market Landscape
- 6.2.1. Analysis by Status of Development
- 6.2.2. Analysis by Type of Body Part Covered
- 6.2.3. Analysis by Mode of Operation
- 6.2.4. Analysis by Type of Body Part Covered and Mode of Operation
- 6.2.5. Analysis by Form of Exoskeleton
- 6.2.6. Analysis by Mode of Operation and Form of Exoskeleton
- 6.2.7. Analysis by Type of Body Part Covered and Form of Exoskeleton
- 6.2.8. Analysis by Device Mobility
- 6.2.9. Analysis by Mode of Operation and Device Mobility
- 6.2.10. Analysis by Form of Exoskeleton and Device Mobility
- 6.2.11. Analysis by Type of Body Part Covered and Device Mobility
- 6.2.12. Analysis by User-Machine Interface
- 6.2.13. Analysis by Type of Body Part Covered and User-Machine Interface
- 6.2.14. Analysis by Mode of Operation and User-Machine Interface
- 6.2.15. Analysis by Availability of Advanced Features
- 6.2.16. Analysis by End User
- 6.2.17. Analysis by Patient Age Group
- 6.2.18. Analysis by Exoskeleton Setting for Patients
- 6.2.19. Analysis by Breakthrough Designation
- 6.3. Medical Exoskeletons: Developer: Landscape
- 6.3.1. Analysis by Year of Establishment
- 6.3.2. Analysis by Company Size
- 6.3.3. Analysis by Location of Headquarters
- 6.3.4. Analysis by Company Size and Location of Headquarters (Region)
- 6.3.5. Analysis by Company Ownership
- 6.3.6. Analysis by Location of Headquarters (Region) and Company Ownership
- 6.3.7. Analysis by Additional Services Offered
- 6.3.8. Most Active Players: Analysis by Number of Medical Exoskeletons
7. NON-MEDICAL EXOSKELETONS: MARKET LANDSCAPE
- 7.1. Chapter Overview
- 7.2. Non-Medical Exoskeletons: Overall Market Landscape
- 7.2.1. Analysis by Status of Development
- 7.2.2. Analysis by Type of Body Part Covered
- 7.2.3. Analysis by Body Part Supported
- 7.2.4. Analysis by Mode of Operation
- 7.2.5. Analysis by Form of Exoskeleton
- 7.2.6. Analysis by Type of Body Part Covered and Mode of Operation
- 7.2.7. Analysis by Type of Body Part Covered and Form of Exoskeleton
- 7.2.8. Analysis by Mode of Operation and Form of Exoskeleton
- 7.2.9. Analysis by Application Area
- 7.2.10. Analysis by Mode of Operation and Application Area
- 7.3. Non-Medical Exoskeletons: Developer Landscape
- 7.3.1. Analysis by Year of Establishment
- 7.3.2. Analysis by Company Size
- 7.3.3. Analysis by Company Size and Employee Count
- 7.3.4. Analysis by Location of Headquarters
- 7.3.5. Analysis by Company Size and Location of Headquarters (Region)
- 7.3.6. Analysis by Company Ownership
- 7.3.7. Analysis by Location of Headquarters (Region) and Company Ownership
- 7.3.8. Most Active Players: Analysis by Number of Non-Medical Exoskeletons
- 7.3.9. Most Active Players: Analysis by Number of Exoskeletons
8. MEDICAL EXOSKELETONS: PRODUCT COMPETITIVENESS ANALYSIS
- 8.1. Chapter Overview
- 8.2. Assumptions and Key Parameters
- 8.3. Methodology
- 8.4. Medical Exoskeletons: Product Competitiveness Analysis
- 8.4.1. Product Competitiveness Analysis: Upper Body Medical Exoskeletons
- 8.4.1.1. Product Competitiveness Analysis: Powered Upper Body Exoskeletons
- 8.4.1.2. Product Competitiveness Analysis: Passive Upper Body Exoskeletons
- 8.4.1.3. Product Competitiveness Analysis: Hybrid Upper Body Exoskeletons
- 8.4.2. Product Competitiveness Analysis: Lower Body Exoskeletons
- 8.4.2.1. Product Competitiveness Analysis: Powered Lower Body Exoskeletons
- 8.4.2.2. Product Competitiveness Analysis: Passive Lower Body Exoskeletons
- 8.4.2.3. Product Competitiveness Analysis: Hybrid Lower Body Exoskeletons
- 8.4.3. Product Competitiveness Analysis: Full Body Medical Exoskeletons
- 8.4.1. Product Competitiveness Analysis: Upper Body Medical Exoskeletons
9. EXOSKELETON DEVELOPERS: DETAILED COMPANY PROFILES
- 9.1. Chapter Overview
- 9.2. CYBERDYNE
- 9.2.1. Company Overview
- 9.2.2. Financial Information
- 9.2.3. Product Portfolio
- 9.2.4 Recent Developments and Future Outlook
- 9.3. Ekso Bionics
- 9.3.1. Company Overview
- 9.3.2. Financial Information
- 9.3.3. Product Portfolio
- 9.3.4 Recent Developments and Future Outlook
- 9.4. ExoAtlet
- 9.4.1. Company Overview
- 9.4.2. Product Portfolio
- 9.4.3. Recent Developments and Future Outlook
- 9.5. Fourier Intelligence
- 9.5.1. Company Overview
- 9.5.2. Product Portfolio
- 9.5.3. Recent Developments and Future Outlook
- 9.6. Gloreha
- 9.6.1. Company Overview
- 9.6.2. Product Portfolio
- 9.6.3. Recent Developments and Future Outlook
- 9.7. Guangzhou Yikang
- 9.7.1. Company Overview
- 9.7.2. Product Portfolio
- 9.7.3. Recent Developments and Future Outlook
- 9.8. Hexar Humancare
- 9.8.1. Company Overview
- 9.8.2. Product Portfolio
- 9.8.3. Recent Developments and Future Outlook
- 9.9. Hocoma
- 9.9.1. Company Overview
- 9.9.2. Product Portfolio
- 9.9.3. Recent Developments and Future Outlook
- 9.10. Panasonic
- 9.10.1. Company Overview
- 9.10.2. Financial Information
- 9.10.3. Product Portfolio
- 9.10.4. Recent Developments and Future Outlook
- 9.11. Tyromotion
- 9.11.1. Company Overview
- 9.11.2. Product Portfolio
- 9.11.3. Recent Developments and Future Outlook
10. EXOSKELETON DEVELOPERS: TABULATED COMPANY PROFILES
- 10.1. Chapter Overview
- 10.2. Bionic Yantra
- 10.2.1. Company Overview
- 10.2.2. Product Portfolio
- 10.3. MediTouch
- 10.3.1. Company Overview
- 10.3.2. Product Portfolio
- 10.4. Milebot Robotics
- 10.4.1. Company Overview
- 10.4.2. Product Portfolio
- 10.5. Myomo
- 10.5.1. Company Overview
- 10.5.2. Product Portfolio
- 10.6. Neofect
- 10.6.1. Company Overview
- 10.6.2. Product Portfolio
- 10.7. NextStep Robotics
- 10.7.1. Company Overview
- 10.7.2. Product Portfolio
- 10.8. ReWalk Robotics
- 10.8.1. Company Overview
- 10.8.2. Product Portfolio
- 10.9. Rex Bionics
- 10.9.1. Company Overview
- 10.9.2. Product Portfolio
- 10.10. Roam Robotics
- 10.10.1. Company Overview
- 10.10.2. Product Portfolio
- 10.11. Trexo Robotics
- 10.11.1. Company Overview
- 10.11.2. Product Portfolio
- 10.12. U&O Technologies
- 10.12.1. Company Overview
- 10.12.2. Product Portfolio
11. MEDICAL EXOSKELETONS: PARTNERSHIPS AND COLLABORATIONS
- 11.1. Chapter Overview
- 11.2. Partnership Models
- 11.3. Medical Exoskeletons: List of Partnerships and Collaborations
- 11.3.1. Analysis by Year of Partnership
- 11.3.2. Analysis by Type of Partnership
- 11.3.3. Analysis by Year and Type of Partnership
- 11.3.4. Analysis by Purpose of Partnership
- 11.3.5. Analysis by Type and Purpose of Partnership
- 11.3.6. Analysis by Type of Partner
- 11.3.7. Analysis by Year of Partnership and Type of Partner
- 11.3.8. Analysis by Type of Non-Industry Players
- 11.3.9. Most Active Players: Distribution by Number of Partnerships
- 11.3.10. Analysis by Geography
- 11.3.10.1. Local and International Agreements
- 11.3.10.2. Intracontinental and Intercontinental Agreements
12. PATENT ANALYSIS
- 12.1. Chapter Overview
- 12.2. Scope and Methodology
- 12.3. Exoskeletons: Patent Analysis
- 12.3.1. Analysis by Patent Application Year
- 12.3.2. Analysis by Patent Publication Year
- 12.3.3. Analysis by Type of Patent and Patent Publication Year
- 12.3.4. Analysis by Publication Time
- 12.3.5. Analysis by Patent Jurisdiction
- 12.3.6. Analysis by CPC symbols
- 12.3.7. Analysis by Type of Applicant
- 12.3.8. Leading Industry Players: Analysis by Number of Patents
- 12.3.9. Leading Non-Industry Players: Analysis by Number of Patents
- 12.3.10. Leading Patent Assignees: Analysis by Number of Patents
- 12.4. Exoskeletons: Patent Benchmarking
- 12.4.1. Analysis by Patent Characteristics
- 12.4.2. Exoskeleton: Patent Valuation
- 12.5. Leading Players by Number of Citations
13. BLUE OCEAN STRATEGY
- 13.1. Overview of Blue Ocean Strategy
- 13.1.1. Red Oceans
- 13.1.2. Blue Oceans
- 13.1.3. Comparison of Red Ocean Strategy and Blue Ocean Strategy
- 13.1.4. Medical Exoskeletons: Blue Ocean Strategy and Shift Tools
- 13.1.4.1. Strategy Canvas
- 13.1.4.2. Pioneer-Migrator-Settler (PMS) Map
- 13.1.4.3. Buyer Utility Map
14. MARKET IMPACT ANALYSIS: DRIVERS, RESTRAINTS, OPPORTUNITIES AND CHALLENGES
- 14.1. Chapter Overview
- 14.2. Market Drivers
- 14.3. Market Restraints
- 14.4. Market Opportunities
- 14.5. Market Challenges
- 14.6. Conclusion
15. GLOBAL EXOSKELETONS MARKET
- 15.1. Chapter Overview
- 15.2. Forecast Methodology and Key Assumptions
- 15.3. Global Exoskeletons Market, Historical Trends (since 2018) and Forecasted Estimates (till 2035)
- 15.3.1. Scenario Analysis
- 15.3.1.1. Conservative Scenario
- 15.3.1.2. Optimistic Scenario
- 15.3.1. Scenario Analysis
- 15.4. Key Market Segmentations
16. EXOSKELETONS MARKET, BY BODY PART COVERED
- 16.1. Chapter Overview
- 16.2. Forecast Methodology and Key Assumptions
- 16.3. Overall Exoskeletons Market: Distribution by Body Part Covered
- 16.3.1. Overall Upper Body Exoskeletons: Historical Trends (since 2018) and Forecasted Estimates (till 2035)
- 16.3.2. Overall Lower Body Exoskeletons: Historical Trends (since 2018) and Forecasted Estimates (till 2035)
- 16.3.3. Overall Full Body Exoskeletons: Historical Trends (since 2018) and Forecasted Estimates (till 2035)
- 16.4. Medical Exoskeletons Market: Distribution by Body Part Covered
- 16.4.1 Medical Upper Body Exoskeletons: Historical Trends (since 2018) and Forecasted Estimates (till 2035)
- 16.4.2. Medical Lower Body Exoskeletons: Historical Trends (since 2018) and Forecasted Estimates (till 2035)
- 16.4.3. Medical Full Body Exoskeletons: Historical Trends (since 2018) and Forecasted Estimates (till 2035)
- 16.5. Non-Medical Exoskeletons Market: Distribution by Body Part Covered
- 16.5.1. Non-Medical Upper Body Exoskeletons: Historical Trends (since 2018) and Forecasted Estimates (till 2035)
- 16.5.2. Non-Medical Lower Body Exoskeletons: Historical Trends (since 2018) and Forecasted Estimates (till 2035)
- 16.5.3. Non-Medical Full Body Exoskeletons: Historical Trends (since 2018) and Forecasted Estimates (till 2035)
- 16.6. Data Triangulation and Validation
17. EXOSKELETONS MARKET, BY MODE OF OPERATION
- 17.1. Chapter Overview
- 17.2. Forecast Methodology and Key Assumptions
- 17.3. Overall Exoskeletons Market: Distribution by Mode of Operation
- 17.3.1. Overall Powered Exoskeletons Market: Historical Trends (since 2018) and Forecasted Estimates (till 2035)
- 17.3.2. Overall Passive Exoskeletons Market: Historical Trends (since 2018) and Forecasted Estimates (till 2035)
- 17.3.3. Overall Hybrid Exoskeletons Market: Historical Trends (since 2018) and Forecasted Estimates (till 2035)
- 17.4. Medical Exoskeletons Market: Distribution by Mode of Operation
- 17.4.1. Medical Powered Exoskeletons Market: Historical Trends (since 2018) and Forecasted Estimates (till 2035)
- 17.4.2. Medical Passive Exoskeletons Market: Historical Trends (since 2018) and Forecasted Estimates (till 2035)
- 17.4.3. Medical Hybrid Exoskeletons Market: Historical Trends (since 2018) and Forecasted Estimates (till 2035)
- 17.5. Non-Medical Exoskeletons Market: Distribution by Mode of Operation
- 17.5.1. Non-Medical Powered Exoskeletons Market: Historical Trends (since 2018) and Forecasted Estimates (till 2035)
- 17.5.2. Non-Medical Passive Exoskeletons Market: Historical Trends (since 2018) and Forecasted Estimates (till 2035)
- 17.5.3. Non-Medical Hybrid Exoskeletons Market: Historical Trends (since 2018) and Forecasted Estimates (till 2035)
- 17.6. Data Triangulation and Validation
18. EXOSKELETON MARKETS, BY THEIR FORM
- 18.1. Chapter Overview
- 18.2. Forecast Methodology and Key Assumptions
- 18.3. Overall Exoskeletons Market: Distribution by Form
- 18.3.1. Overall Rigid Exoskeletons: Historical Trends (since 2018) and Forecasted Estimates (till 2035)
- 18.3.2. Overall Soft Exoskeletons: Historical Trends (since 2018) and Forecasted Estimates (till 2035)
- 18.4. Medical Exoskeletons Market: Distribution by Form
- 18.4.1. Medical Rigid Exoskeletons: Historical Trends (since 2018) and Forecasted Estimates (till 2035)
- 18.4.2. Medical Soft Exoskeletons: Historical Trends (since 2018) and Forecasted Estimates (till 2035)
- 18.5. Non-Medical Exoskeletons Market: Distribution by Form
- 18.5.1. Non-Medical Rigid Exoskeletons: Historical Trends (since 2018) and Forecasted Estimates (till 2035)
- 18.5.2. Non-Medical Soft Exoskeletons: Historical Trends (since 2018) and Forecasted Estimates (till 2035)
- 18.6. Data Triangulation and Validation
19. EXOSKELETON MARKETS, BY THEIR MOBILITY
- 19.1. Chapter Overview
- 19.2. Forecast Methodology and Key Assumptions
- 19.3. Medical Exoskeletons Market: Distribution by Mobility
- 19.3.1. Medical Fixed/ Supported Exoskeleton: Historical Trends (since 2018) and Forecasted Estimates (till 2035)
- 19.3.2. Medical Mobile / Overground Walking Exoskeleton: Historical Trends (since 2018) and Forecasted Estimates (till 2035)
- 19.4. Data Triangulation and Validation
20. EXOSKELETONS MARKET, BY END USERS
- 20.1. Chapter Overview
- 20.2. Forecast Methodology and Key Assumptions
- 20.3. Overall Exoskeletons Market: Distribution by End Users
- 20.4. Exoskeletons Market for Patients: Historical Trends (since 2018) and Forecasted Estimates (till 2035)
- 20.5. Exoskeletons Market for Healthcare Providers: Historical Trends (since 2018) and Forecasted Estimates (till 2035)
- 20.6. Exoskeletons Market for Industry Workers: Historical Trends (since 2018) and Forecasted Estimates (till 2035)
- 20.7. Exoskeletons Market for Military Personnel: Historical Trends (since 2018) and Forecasted Estimates (till 2035)
- 20.8. Exoskeletons Market for Other End Users: Historical Trends (since 2018) and Forecasted Estimates (till 2035)
- 20.9. Data Triangulation and Validation
21. EXOSKELETONS MARKET, BY GEOGRAPHY
- 21.1. Chapter Overview
- 21.2. Forecast Methodology and Key Assumptions
- 21.3. Overall Exoskeletons Market: Distribution by Geography
- 21.3.1. North America, Historical Trends (since 2018) and Forecasted Estimates (till 2035)
- 21.3.2 Europe, Historical Trends (since 2018) and Forecasted Estimates (till 2035)
- 21.3.3. Asia-Pacific, Historical Trends (since 2018) and Forecasted Estimates (till 2035)
- 21.3.4. Rest of the World, Historical Trends (since 2018) and Forecasted Estimates (till 2035)
- 21.4. Data Triangulation and Validation
22. CONCLUSION
23. EXECUTIVE INSIGHTS
- 23.1. Chapter Overview
- 23.2. Company A
- 23.2.1. Company Snapshot
- 23.2.2. Interview Transcript: Co-Founder and Chief Executive Officer
- 23.3. Company B
- 23.3.1. Company Snapshot
- 23.3.2. Interview Transcript: Director of Business Planning and Development
- 23.4. Company C
- 23.4.1. Company Snapshot
- 23.4.2. Interview Transcript: Vice President of Sales and Marketing
- 23.5. Company D
- 23.5.1. Company Snapshot
- 23.5.2. Interview Transcript: Founder and Director
- 23.6. Company E
- 23.6.1. Company Snapshot
- 23.6.2. Interview Transcript: Marketing and Design Manager
24. APPENDIX I: BLUE OCEAN STRATEGY AND SHIFT TOOLS
- 24.1. Chapter Overview
- 24.2. Blue Ocean Strategy and Shift Tools
- 24.2.1. Value Innovation
- 24.2.2. Four Action Framework
- 24.2.3. Eliminate-Raise-Reduce-Create (ERRC) Grid
- 24.2.4. Six Path Framework
- 24.2.5. Three Tiers of Non-customers
- 24.3 Sequence of Blue Ocean Strategy
- 24.3.1. The Price Corridor of the Mass
- 24.3.2. Four Hurdles to Strategy Execution
- 24.3.3. Tipping Point Leadership
- 24.3.4. Fair Process
25. APPENDIX II: TABULATED DATA
26. APPENDIX III: LIST OF COMPANIES AND ORGANIZATION
List of Tables
- Table 5.1 Degrees of Freedom in Each Joint of Lower Exoskeletons
- Table 5.2 Contrasting Characteristics: Medical and Non-Medical Exoskeletons
- Table 5.3 Distinguishing Characteristics: Medical and Non-medical Exoskeletons
- Table 6.1 Medical Exoskeletons: Information on Status of Development, Type of Body Part Covered and Mode of Operation
- Table 6.2 Medical Exoskeletons: Information on Form, Device Mobility and User-Machine Interface
- Table 6.3 Medical Exoskeletons: Information on Advanced Features and End Users
- Table 6.4 Medical Exoskeletons: Information on Patient Age Group, Exoskeleton Setting for Patients and Breakthrough Designation
- Table 6.5 Medical Exoskeletons: Information on Technology / Software, Maximum Weight of Exoskeleton, Maximum Weight Carrying Capacity and Dimensions
- Table 6.6 Medical Exoskeletons: List of Developers
- Table 6.7 Medical Exoskeletons: Information on Additional Services Offered
- Table 7.1 Non-Medical Exoskeletons: Information on Status of Development, Type of Body Part Covered and Body Part Supported
- Table 7.2 Non-Medical Exoskeletons: Information on Mode of Operation and Form of Exoskeleton
- Table 7.3 Non-Medical Exoskeletons: Information on Application Area
- Table 7.4 Non-Medical Exoskeletons: Information on Technology / Software, Maximum Weight of Exoskeleton, Maximum Weight Carrying Capacity and Dimensions
- Table 7.5 Non-Medical Exoskeletons: List of Developers
- Table 9.1 List of Exoskeleton Companies Profiled
- Table 9.2 CYBERDYNE: Company Snapshot
- Table 9.3 CYBERDYNE: Medical Exoskeleton Portfolio
- Table 9.4 CYBERDYNE: Non-Medical Exoskeleton Portfolio
- Table 9.5 CYBERDYNE: Recent Developments and Future Outlook
- Table 9.6 Ekso Bionics: Company Snapshot
- Table 9.7 Ekso Bionics: Medical Exoskeleton Portfolio
- Table 9.8 Ekso Bionics: Non-Medical Exoskeleton Portfolio
- Table 9.9 Ekso Bionics: Recent Developments and Future Outlook
- Table 9.10 ExoAtlet: Company Snapshot
- Table 9.11 ExoAtlet: Medical Exoskeleton Portfolio
- Table 9.12 ExoAtlet: Non-Medical Exoskeleton Portfolio
- Table 9.13 ExoAtlet: Recent Developments and Future Outlook
- Table 9.14 Fourier Intelligence: Company Snapshot
- Table 9.15 Fourier Intelligence: Medical Exoskeleton Portfolio
- Table 9.16 Fourier Intelligence: Recent Developments and Future Outlook
- Table 9.17 Gloreha: Company Snapshot
- Table 9.18 Gloreha: Medical Exoskeleton Portfolio
- Table 9.19 Gloreha: Recent Developments and Future Outlook
- Table 9.20 Guangzhou YiKang: Company Snapshot
- Table 9.21 Guangzhou YiKang: Medical Exoskeleton Portfolio
- Table 9.22 Guangzhou YiKang: Recent Developments and Future Outlook
- Table 9.23 Hexar Humancare: Company Snapshot
- Table 9.24 Hexar Humancare: Medical Exoskeleton Portfolio
- Table 9.25 Hexar Humancare: Non-Medical Exoskeleton Portfolio
- Table 9.26 Hexar Humancare: Recent Developments and Future Outlook
- Table 9.27 Hocoma: Company Snapshot
- Table 9.28 Hocoma: Medical Exoskeleton Portfolio
- Table 9.29 Hocoma: Recent Developments and Future Outlook
- Table 9.30 Panasonic: Company Snapshot
- Table 9.31 Panasonic: Medical Exoskeleton Portfolio
- Table 9.32 Panasonic: Non-Medical Exoskeleton Portfolio
- Table 9.33 Panasonic: Recent Developments and Future Outlook
- Table 9.34 Tyromotion: Company Snapshot
- Table 9.35 Tyromotion: Medical Exoskeleton Portfolio
- Table 9.36 Tyromotion: Recent Developments and Future Outlook
- Table 10.1 Exoskeleton Developers: List of Companies Profiled
- Table 10.2 Bionic Yantra: Company Snapshot
- Table 10.3 Bionic Yantra: Medical Exoskeleton Portfolio
- Table 10.4 MediTouch: Company Snapshot
- Table 10.5 MediTouch: Medical Exoskeleton Portfolio
- Table 10.6 Milebot Robotics: Company Snapshot
- Table 10.7 Milebot Robotics: Medical Exoskeleton Portfolio
- Table 10.8 Milebot Robotics: Non- Medical Exoskeleton Portfolio
- Table 10.9 Myomo: Company Snapshot
- Table 10.10 Myomo: Medical Exoskeleton Portfolio
- Table 10.11 Neofect: Company Snapshot
- Table 10.12 Neofect: Medical Exoskeleton Portfolio
- Table 10.13 NextStep Robotics: Company Snapshot
- Table 10.14 NextStep Robotics: Medical Exoskeleton Portfolio
- Table 10.15 ReWalk Robotics: Company Snapshot
- Table 10.16 ReWalk Robotics: Medical Exoskeleton Portfolio
- Table 10.17 REX Bionics: Company Snapshot
- Table 10.18 REX Bionics: Medical Exoskeleton Portfolio
- Table 10.19 Roam Robotics: Company Snapshot
- Table 10.20 Roam Robotics: Medical Exoskeleton Portfolio
- Table 10.21 Roam Robotics: Non-Medical Exoskeleton Portfolio
- Table 10.22 Trexo Robotics: Company Snapshot
- Table 10.23 Trexo Robotics: Medical Exoskeleton Portfolio
- Table 10.24 U&O Technologies: Company Snapshot
- Table 10.25 U&O Technologies: Medical Exoskeleton Portfolio
- Table 11.1 Medical Exoskeletons: List of Partnerships and Collaborations, Since 2017
- Table 12.1 Patent Analysis: Top CPC Sections
- Table 12.2 Patent Analysis: Top CPC Symbols
- Table 12.3 Patent Analysis: Top CPC Codes
- Table 12.4 Patent Analysis: Summary of Benchmarking Analysis
- Table 12.5 Patent Analysis: Categorization based on Weighted Valuation Scores
- Table 12.6 Patent Portfolio: List of Leading Patents (by Highest Relative Valuation)
- Table 12.7 Patent Portfolio: List of Leading Patents (by Number of Citations)
- Table 15.1 Average Price of Powered Exoskeletons Used across Different Application Areas
- Table 16.1 Estimated Revenues of Medical Exoskeletons, based on Body Part Covered
- Table 16.2 Estimated Revenues of Non-Medical Exoskeletons, based on Body Part Covered
- Table 17.1 Estimated Revenues of Powered, Passive and Hybrid Exoskeletons from Various Application Areas
- Table 18.1 Estimated Revenues of Medical Exoskeletons, based on Form
- Table 18.2 Estimated Revenues of Non-Medical Exoskeletons, based on Form
- Table 19.1 Estimated Revenues of Medical Exoskeletons, based on Mobility
- Table 20.1 Estimated Revenues for Medical Exoskeletons from Various End Users
- Table 20.2 Estimated Revenues for Non-Medical Exoskeletons from Various End Users
- Table 23.1 ABLE Human Motion: Key Highlights
- Table 23.2 Archelis: Key Highlights
- Table 23.3 Biomotum: Key Highlights
- Table 23.4 Bionic Yantra: Key Highlights
- Table 23.5 Bionic Power: Key Highlights
- Table 25.1 Medical Exoskeletons: Distribution by Status of Development
- Table 25.2 Medical Exoskeletons: Distribution by Type of Body Part Covered
- Table 25.3 Medical Exoskeletons: Distribution by Mode of Operation
- Table 25.4 Medical Exoskeletons: Distribution by Type of Body Part Covered and Mode of Operation
- Table 25.5 Medical Exoskeletons: Distribution by Form of Exoskeleton
- Table 25.6 Medical Exoskeletons: Distribution by Mode of Operation and Form of Exoskeleton
- Table 25.7 Medical Exoskeletons: Distribution by Type of Body Part Covered and Form of Exoskeleton
- Table 25.8 Medical Exoskeletons: Distribution by Device Mobility
- Table 25.9 Medical Exoskeletons: Distribution by Mode of Operation and Device Mobility
- Table 25.10 Medical Exoskeletons: Distribution by Form of Exoskeleton and Device Mobility
- Table 25.11 Medical Exoskeletons: Distribution by Type of Body Part Covered and Device Mobility
- Table 25.12 Medical Exoskeletons: Distribution by User-Machine Interface
- Table 25.13 Medical Exoskeletons: Distribution by Type of Body Part Covered and User-Machine Interface
- Table 25.14 Medical Exoskeletons: Distribution by Mode of Operation and User-Machine Interface
- Table 25.15 Medical Exoskeletons: Distribution by Availability of Advanced Features
- Table 25.16 Medical Exoskeletons: Distribution by End User
- Table 25.17 Medical Exoskeletons: Distribution by Patient Age Group
- Table 25.18 Medical Exoskeletons: Distribution by Exoskeleton Setting for Patients
- Table 25.19 Medical Exoskeletons: Distribution by Breakthrough Designation
- Table 25.20 Medical Exoskeleton Developers: Distribution by Year of Establishment
- Table 25.21 Medical Exoskeleton Developers: Distribution by Company Size
- Table 25.22 Medical Exoskeleton Developers: Distribution by Company Size and Employee Count
- Table 25.23 Medical Exoskeleton Developers: Distribution by Location of Headquarters (Region)
- Table 25.24 Medical Exoskeleton Developers: Distribution by Location of Headquarters (Country)
- Table 25.25 Medical Exoskeleton Developers: Distribution by Company Size and Location of Headquarters
- Table 25.26 Medical Exoskeleton Developers: Distribution by Company Ownership
- Table 25.27 Medical Exoskeleton Developers: Distribution by Location of Headquarters and Company Ownership
- Table 25.28 Medical Exoskeleton Developers: Distribution by Additional Services Offered
- Table 25.29 Most Active Players: Distribution by Number of Medical Exoskeletons
- Table 25.30 Non-Medical Exoskeletons: Distribution by Status of Development
- Table 25.31 Non-Medical Exoskeletons: Distribution by Type of Body Part Covered
- Table 25.32 Non-Medical Exoskeletons: Distribution by Body Part Supported
- Table 25.33 Non-Medical Exoskeletons: Distribution by Mode of Operation
- Table 25.34 Non-Medical Exoskeletons: Distribution by Form of Exoskeleton
- Table 25.35 Non-Medical Exoskeletons: Distribution by Mode of Operation and Form of Exoskeleton
- Table 25.36 Non-Medical Exoskeletons: Distribution by Type of Body Part Covered and Mode of Operation
- Table 25.37 Non-Medical Exoskeletons: Distribution by Mode of Operation and Form of Exoskeleton
- Table 25.38 Non-Medical Exoskeletons: Distribution by Type of Body Part Covered and Form of Exoskeleton
- Table 25.39 Non-Medical Exoskeletons: Distribution by Application Area
- Table 25.40 Non-Medical Exoskeletons: Distribution by Mode of Operation and Application Area
- Table 25.41 Non-Medical Exoskeletons Developers: Distribution by Year of Establishment
- Table 25.42 Non-Medical Exoskeleton Developers: Distribution by Company Size
- Table 25.43 Non-Medical Exoskeleton Developers: Distribution by Company Size and Employee Count
- Table 25.44 Non-Medical Exoskeleton Developers: Distribution by Location of Headquarters (Region)
- Table 25.45 Non-Medical Exoskeleton Developers: Distribution by Location of Headquarters (Country)
- Table 25.46 Non-Medical Exoskeleton Developers: Distribution by Company Size and Location of Headquarters
- Table 25.47 Non-Medical Exoskeleton Developers: Distribution by Company Ownership
- Table 25.48 Non-Medical Exoskeleton Developers: Distribution by Location of Headquarters and Company Ownership
- Table 25.49 Most Active Players: Distribution by Number of Non-Medical Exoskeletons
- Table 25.50 Most Active Players: Distribution by Number of Medical and Non-Medical Exoskeletons
- Table 25.51 CYBERDYNE: Annual Revenues, Since FY2019 (JPY Billion)
- Table 25.52 CYBERDYNE: Distribution of Annual Revenues by Business Segment, Since FY 2021 (JPY Billion)
- Table 25.53 Ekso Bionics: Annual Revenues, Since 2018 (USD Billion)
- Table 25.54 Ekso Bionics: Distribution of Annual Revenues by Business Segment, FY 2023
- Table 25.55 Panasonic: Annual Revenues, FY 2018- FY 2023 (JPY Billion)
- Table 25.56 Partnerships and Collaborations: Cumulative Year-wise Trend, Since 2017
- Table 25.57 Partnerships and Collaborations: Distribution by Type of Partnership
- Table 25.58 Partnerships and Collaborations: Distribution by Year and Type of Partnership
- Table 25.59 Partnerships and Collaborations: Distribution by Purpose of Partnership
- Table 25.60 Partnerships and Collaborations: Distribution by Type and Purpose of Partnership
- Table 25.61 Partnerships and Collaborations: Distribution by Type of Partner
- Table 25.62 Partnerships and Collaborations: Distribution by Type of Partnership and Type of Partner
- Table 25.63 Partnerships and Collaborations: Type of Non-Industry Partner
- Table 25.64 Most Active Players: Distribution by Number of Partnerships
- Table 25.65 Partnerships and Collaborations: Local and International Agreements
- Table 25.66 Partnerships and Collaborations: Intracontinental and Intercontinental Agreements
- Table 25.67 Patent Analysis: Distribution by Type of Patent
- Table 25.68 Patent Analysis: Cumulative Year-wise Trend by Patent Application Year, Since 2016
- Table 25.69 Patent Analysis: Cumulative Year-wise Trend by Patent Publication Year, Since 2016
- Table 25.70 Patent Analysis: Distribution by Type of Patent and Patent Publication Year, Since 2016
- Table 25.71 Patent Analysis: Distribution by Publication Time
- Table 25.72 Patent Analysis: Distribution by Patent Jurisdiction (Region)
- Table 25.73 Patent Analysis: Distribution by Patent Jurisdiction (Country)
- Table 25.74 Patent Analysis: Distribution by Type of Applicant
- Table 25.75 Leading Industry Players: Distribution by Number of Patents
- Table 25.76 Leading Non-Industry Players: Distribution by Number of Patents
- Table 25.77 Leading Individual Assignees: Distribution by Number of Patents
- Table 25.78 Leading Industry Players: Benchmarking by Patent Characteristics (CPC Codes)
- Table 25.79 Leading Non-Industry Players: Benchmarking by Patent Characteristics (CPC Codes)
- Table 25.80 Patent Analysis: Distribution by Patent Age
- Table 25.81 Patent Analysis: Patent Valuation
- Table 25.82 Global Exoskeletons Market, Historical Trends (Since 2018) and Forecasted Estimates (Till 2035) (USD Billion)
- Table 25.83 Global Exoskeletons Market, Forecasted Estimates (Till 2035) Conservative Scenario (USD Billion)
- Table 25.84 Global Exoskeletons Market, Forecasted Estimates (Till 2035), Optimistic Scenario (USD Billion)
- Table 25.85 Medical Exoskeletons Market: Distribution by Body Part Covered (USD Billion)
- Table 25.86 Medical Upper Body Exoskeleton Market: Historical Trends (Since 2018) and Forecasted Estimates (Till 2035) (USD Billion)
- Table 25.87 Medical Lower Body Exoskeleton Market: Historical Trends (Since 2018) and Forecasted Estimates (Till 2035) (USD Billion)
- Table 25.88 Medical Full Body Exoskeleton Market: Historical Trends (Since 2018) and Forecasted Estimates (Till 2035) (USD Billion)
- Table 25.89 Non-Medical Upper Body Exoskeletons Market: Historical Trends (Since 2018) and Forecasted Estimates (Till 2035) (USD Billion)
- Table 25.90 Non-Medical Lower Body Exoskeleton Market: Historical Trends (Since 2018) and Forecasted Estimates (Till 2035) (USD Billion)
- Table 25.91 Non-Medical Full Body Exoskeleton Market Historical Trends (Since 2018) and Forecasted Estimates (Till 2035)
- Table 25.92 Overall Exoskeletons Market: Distribution by Body Part Covered (USD Billion)
- Table 25.93 Overall Upper Body Exoskeletons Market: Historical Trends (Since 2018) and Forecasted Estimates (Till 2035) (USD Billion)
- Table 25.94 Overall Lower Body Exoskeletons Market: Historical Trends (Since 2018) and Forecasted Estimates (Till 2035) (USD Billion)
- Table 25.95 Overall Full Body Exoskeletons Market: Historical Trends (Since 2018) and Forecasted Estimates (Till 2035) (USD Billion)
- Table 25.96 Medical Exoskeletons Market: Distribution by Mode of Operation (USD Billion)
- Table 25.97 Medical Powered Exoskeletons Market: Historical Trends (Since 2018) and Forecasted Estimates (Till 2035) (USD Billion)
- Table 25.98 Medical Passive Exoskeletons Market: Historical Trends (Since 2018) and Forecasted Estimates (Till 2035) (USD Billion)
- Table 25.99 Medical Hybrid Exoskeletons Market: Historical Trends (Since 2018) and Forecasted Estimates (Till 2035) (USD Billion)
- Table 25.100 Non-Medical Exoskeletons Market: Distribution by Mode of Operation (USD Billion)
- Table 25.101 Non-Medical Powered Exoskeletons Market: Historical Trends (Since 2018) and Forecasted Estimates (Till 2035) (USD Billion)
- Table 25.102 Non-Medical Passive Exoskeletons Market: Historical Trends (Since 2018) and Forecasted Estimates (Till 2035) (USD Billion)
- Table 25.103 Non-Medical Hybrid Exoskeletons Market: Historical Trends (Since 2018) and Forecasted Estimates (Till 2035) (USD Billion)
- Table 25.104 Overall Powered Exoskeletons Market: Historical Trends (Since 2018) and Forecasted Estimates (Till 2035) (USD Billion)
- Table 25.105 Overall Passive Exoskeletons Market: Historical Trends (Since 2018) and Forecasted Estimates (Till 2035) (USD Billion)
- Table 25.106 Overall Hybrid Exoskeletons Market: Historical Trends (Since 2018) and Forecasted Estimates (Till 2035) (USD Billion)
- Table 25.107 Medical Exoskeletons Market: Distribution by Form (USD Billion)
- Table 25.108 Medical Rigid Exoskeletons Market: Historical Trends (Since 2018) and Forecasted Estimates (Till 2035) (USD Billion)
- Table 25.109 Medical Soft Exoskeletons Market: Historical Trends (Since 2018) and Forecasted Estimates (Till 2035) (USD Billion)
- Table 25.110 Non-Medical Exoskeletons Market: Distribution by Form (USD Billion)
- Table 25.111 Non-Medical Rigid Exoskeletons Market: Historical Trends (Since 2018) and Forecasted Estimates (Till 2035) (USD Billion)
- Table 25.112 Non-Medical Soft Exoskeletons Market: Historical Trends (Since 2018) and Forecasted Estimates (Till 2035) (USD Billion)
- Table 25.113 Overall Exoskeletons Market: Distribution by Form (USD Billion)
- Table 25.114 Overall Rigid Exoskeletons Market: Historical Trends (Since 2018) and Forecasted Estimates (Till 2035)
- Table 25.115 Overall Soft Exoskeletons Market: Historical Trends (Since 2018) and Forecasted Estimates (Till 2035) (USD Billion)
- Table 25.116 Medical Fixed / Supported Exoskeletons Market: Historical Trends (Since 2018) and Forecasted Estimates (Till 2035) (USD Billion)
- Table 25.117 Medical Mobile / Overground Walking Exoskeletons Market: Historical Trends (Since 2018) and Forecasted Estimates (Till 2035) (USD Billion)
- Table 25.118 Overall Exoskeletons Market: Distribution by End Users (USD Billion)
- Table 25.119 Medical Exoskeletons Market by Patients: Historical Trends (Since 2018) and Forecasted Estimates (Till 2035) (USD Billion)
- Table 25.120 Medical Exoskeletons Market by Healthcare Professionals: Historical Trends (Since 2018) and Forecasted Estimates (Till 2035) (USD Billion)
- Table 25.121 Non-Medical Exoskeletons Market by Industry Workers: Historical Trends (Since 2018) and Forecasted Estimates (Till 2035) (USD Billion)
- Table 25.122 Non-Medical Exoskeletons Market by Military Personnel: Historical Trends (Since 2018) and Forecasted Estimates (Till 2035) (USD Billion)
- Table 25.123 Non-Medical Exoskeletons Market by Other End Users: Historical Trends (Since 2018) and Forecasted Estimates (Till 2035) (USD Billion)
- Table 25.124 Exoskeletons Market in North America: Historical Trends (Since 2018) Forecasted Estimates (Till 2035) (USD Billion)
- Table 25.125 Exoskeletons Market in Europe: Historical Trends (Since 2018) Forecasted Estimates (Till 2035) (USD Billion)
- Table 25.126 Exoskeleton Market in Asia-Pacific: Historical Trends (Since 2018) Forecasted Estimates (Till 2035) (USD Billion)
- Table 25.127 Exoskeleton Market in Rest of the World: Historical Trends (Since 2018) Forecasted Estimates (Till 2035) (USD Billion)
List of Figures
- Figure 2.1 Research Methodology: Project Assumptions
- Figure 2.2 Research Methodology: Forecast Methodology
- Figure 2.3 Research Methodology: Robust Quality Control
- Figure 2.4 Research Methodology: Key Market Segmentations
- Figure 3.1 Lessons Learnt from Past Recessions
- Figure 4.1 Executive Summary: Medical Exoskeletons Market Landscape
- Figure 4.2 Executive Summary: Non-Medical Exoskeletons Market Landscape
- Figure 4.3 Executive Summary: Partnerships and Collaborations
- Figure 4.4 Executive Summary: Patent Analysis
- Figure 4.5 Executive Summary: Overall Market Forecast and Opportunity Analysis
- Figure 4.6 Executive Summary: Medical Exoskeletons Market Forecast and Opportunity Analysis
- Figure 4.7 Executive Summary: Non-Medical Exoskeletons Market Forecast and Opportunity Analysis
- Figure 5.1 Types of Mobility Assistive Devices
- Figure 5.2 Historical Events Related to Exoskeletons
- Figure 5.3 Classification of Exoskeletons
- Figure 5.4 Movements Supported by Lower Body, Upper Body and Full Body Exoskeletons
- Figure 5.5 Components of a Powered / Robotic Exoskeletons
- Figure 5.6 Features of Exoskeletons
- Figure 5.7 Limitations of Exoskeletons
- Figure 5.8 Applications of Exoskeleton
- Figure 6.1 Medical Exoskeletons: Distribution by Status of Development
- Figure 6.2 Medical Exoskeletons: Distribution by Type of Body Part Covered
- Figure 6.3 Medical Exoskeletons: Distribution by Mode of Operation
- Figure 6.4 Medical Exoskeletons: Distribution Type of Body Part Covered and Mode of Operation
- Figure 6.5 Medical Exoskeletons: Distribution by Form of Exoskeleton
- Figure 6.6 Medical Exoskeletons: Distribution by Mode of Operation and Form of Exoskeleton
- Figure 6.7 Medical Exoskeletons: Distribution Type of Body Part Covered and Form of Exoskeleton
- Figure 6.8 Medical Exoskeletons: Distribution by Device Mobility
- Figure 6.9 Medical Exoskeletons: Distribution by Mode of Operation and Device Mobility
- Figure 6.10 Medical Exoskeletons: Distribution by Form and Device Mobility
- Figure 6.11 Medical Exoskeletons: Distribution by Type of Body Part Covered and Device Mobility
- Figure 6.12 Medical Exoskeletons: Distribution by User-Machine Interface
- Figure 6.13 Medical Exoskeletons: Distribution by Type of Body Part Covered and User-Machine Interface
- Figure 6.14 Medical Exoskeletons: Distribution by Mode of Operation and User-Machine Interface
- Figure 6.15 Medical Exoskeletons: Distribution by Availability of Advanced Features
- Figure 6.16 Medical Exoskeletons: Distribution by End User
- Figure 6.17 Medical Exoskeletons: Distribution by Patient Age Group
- Figure 6.18 Medical Exoskeletons: Distribution by Exoskeleton Setting for Patients
- Figure 6.19 Medical Exoskeletons: Distribution by Breakthrough Designation
- Figure 6.20 Medical Exoskeleton Developers: Distribution by Year of Establishment
- Figure 6.21 Medical Exoskeleton Developers: Distribution by Company Size
- Figure 6.22 Medical Exoskeleton Developers: Distribution by Company Size and Employee Count
- Figure 6.23 Medical Exoskeleton Developers: Distribution by Location of Headquarters (Region)
- Figure 6.24 Medical Exoskeleton Developers: Distribution by Location of Headquarters (Country)
- Figure 6.25 Medical Exoskeleton Developers: Distribution by Company Size and Location of Headquarters
- Figure 6.26 Medical Exoskeleton Developers: Distribution by Company Ownership
- Figure 6.27 Medical Exoskeleton Developers: Distribution by Location of Headquarters and Company Ownership
- Figure 6.28 Medical Exoskeleton Developers: Distribution by Additional Services Offered
- Figure 6.29 Most Active Players: Distribution by Number of Medical Exoskeleton
- Figure 7.1 Non-Medical Exoskeletons: Distribution by Status of Development
- Figure 7.2 Non-Medical Exoskeletons: Distribution by Type of Body Part Covered
- Figure 7.3 Non-Medical Exoskeletons: Distribution by Body Part Supported
- Figure 7.4 Non-Medical Exoskeletons: Distribution by Mode of Operation
- Figure 7.5 Non-Medical Exoskeletons: Distribution by Form of Exoskeleton
- Figure 7.6 Non-Medical Exoskeletons: Distribution by Type of Body Part Covered and Mode of Operation
- Figure 7.7 Non-Medical Exoskeletons: Distribution by Type of Body Part Covered and Form of Exoskeleton
- Figure 7.8 Non-Medical Exoskeletons: Distribution by Mode of Operation and Form of Exoskeleton
- Figure 7.9 Non-Medical Exoskeletons: Distribution by Application Area
- Figure 7.10 Non-Medical Exoskeletons: Distribution by Mode of Operation and Application Area
- Figure 7.11 Non-Medical Exoskeleton Developers: Distribution by Year of Establishment
- Figure 7.12 Non-Medical Exoskeleton Developers: Distribution by Company Size
- Figure 7.13 Non-Medical Exoskeleton Developers: Distribution by Company Size and Employee Count
- Figure 7.14 Non-Medical Exoskeleton Developers: Distribution by Location of Headquarters (Region)
- Figure 7.15 Non-Medical Exoskeleton Developers: Distribution by Location of Headquarters (Country)
- Figure 7.16 Non-Medical Exoskeleton Developers: Distribution by Company Size and Location of Headquarters
- Figure 7.17 Non-Medical Exoskeleton Developers: Distribution by Company Ownership
- Figure 7.18 Non-Medical Exoskeleton Developers: Distribution by Location of Headquarters and Company Ownership
- Figure 7.19 Most Active Players: Distribution by Number of Exoskeletons
- Figure 7.20 Most Active Players: Distribution by Number of Medical and Non-Medical Exoskeletons
- Figure 8.1 Product Competitiveness Analysis: Powered Upper Body Exoskeletons (Peer Group I)
- Figure 8.2 Product Competitiveness Analysis: Passive Upper Body Exoskeletons (Peer Group II)
- Figure 8.3 Product Competitiveness Analysis: Hybrid Upper Body Exoskeletons (Peer Group III)
- Figure 8.4 Product Competitiveness Analysis: Powered Lower Body Exoskeletons (Peer Group IV)
- Figure 8.5 Product Competitiveness Analysis: Passive Lower Body Exoskeletons (Peer Group V)
- Figure 8.6 Product Competitiveness Analysis: Hybrid Lower Body Exoskeletons (Peer Group VI)
- Figure 8.7 Product Competitiveness Analysis: Full Body Exoskeleton (Peer Group VII)
- Figure 9.1 CYBERDYNE: Annual Revenues, Since FY 2019 (JPY Billion)
- Figure 9.2 CYBERDYNE: Distribution of Revenues by Business Segment, Since FY 2021
- Figure 9.3 Ekso Bionics: Annual Revenues, 2018 - Q1 2023 (USD Billion)
- Figure 9.4 Ekso Bionics: Distribution of Revenues by Business Segment, FY 2023
- Figure 9.5 Panasonic: Annual Revenues, Since FY 2018 (JPY Billion)
- Figure 11.1 Partnerships and Collaborations: Cumulative Year-wise Trend, Since 2017
- Figure 11.2 Partnerships and Collaborations: Distribution by Type of Partnership
- Figure 11.3 Partnerships and Collaborations: Distribution by Year and Type of Partnership
- Figure 11.4 Partnerships and Collaborations: Distribution by Purpose of Partnership
- Figure 11.5 Partnerships and Collaborations: Distribution by Type and Purpose of Partnership
- Figure 11.6 Partnerships and Collaborations: Distribution by Type of Partner
- Figure 11.7 Partnerships and Collaborations: Distribution by Type of Partnership and Type of Partner
- Figure 11.8 Partnerships and Collaborations: Distribution by Type of Non-Industry Partner
- Figure 11.9 Most Active Players: Distribution by Number of Partnerships
- Figure 11.10 Partnerships and Collaborations: Local and International Agreements
- Figure 11.11 Partnerships and Collaborations: Intracontinental and Intercontinental Agreements
- Figure 12.1 Patent Analysis: Distribution by Type of Patent
- Figure 12.2 Patent Analysis: Cumulative Year-wise Trend by Patent Application Year, Since Pre
- Figure 12.3 Patent Analysis: Cumulative Year-wise Trend by Patent Publication Year, Since 2016
- Figure 12.4 Patent Analysis: Distribution by Type of Patent and Patent Publication Year, Since 2016
- Figure 12.5 Patent Analysis: Distribution by Publication Time
- Figure 12.6 Patent Analysis: Distribution by Patent Jurisdiction (Region)
- Figure 12.7 Patent Analysis: Distribution by Patent Jurisdiction (Country)
- Figure 12.8 Patent Analysis: Distribution by CPC Symbols
- Figure 12.9 Patent Analysis: Distribution by Type of Applicant
- Figure 12.10 Leading Industry Players: Distribution by Number of Patents
- Figure 12.11 Leading Non-Industry Players: Distribution by Number of Patents
- Figure 12.12 Leading Individual Assignees: Distribution by Number of Patents
- Figure 12.13 Patent Benchmarking Analysis: Distribution of CPC Codes by Leading Industry Players
- Figure 12.14 Patent Benchmarking Analysis: Distribution of CPC Codes by Leading Non- Industry Players
- Figure 12.15 Patent Analysis: Distribution by Patent Age
- Figure 12.16 Patent Analysis: Patent Valuation
- Figure 13.1 Differences Between Red Ocean Strategy and Blue Ocean Strategy
- Figure 13.2 Blue Ocean Strategy: Strategy Canvas
- Figure 13.3 Blue Ocean Strategy: Pioneer-Migrator-Settler (PMS) Map
- Figure 13.4 Blue Ocean Strategy: Buyer Utility Map
- Figure 15.1 Standard Demand-Price Curve for Exoskeleton
- Figure 15.2 Global Exoskeletons Market, Historical Trends (Since 2018) and Forecasted Estimates (Till 2035) (USD Billion)
- Figure 15.3 Global Exoskeletons Market, Forecasted Estimates (Since 2023), Conservative Scenario (USD Billion)
- Figure 15.4 Global Exoskeletons Market, Forecasted Estimates (Since 2023), Optimistic Scenario (USD Billion)
- Figure 16.1 Overall Exoskeletons Market: Distribution by Body Part Covered (USD Billion)
- Figure 16.2 Overall Exoskeletons Market for Upper Body Exoskeletons: Historical Trends (Since 2018) and Future Estimates (Till 2035) (USD Billion)
- Figure 16.3 Overall Exoskeletons Market for Lower Body Exoskeletons: Historical Trends (Since 2018) and Future Estimates (2023- 2035) (USD Billion)
- Figure 16.4 Overall Exoskeletons Market for Full Body Exoskeletons: Historical Trends (Since 2018) and Future Estimates (Till 2035) (USD Billion)
- Figure 16.5 Medical Exoskeletons Market: Distribution by Body Part Covered, 2018, 2023 and 2035 (USD Billion)
- Figure 16.6 Medical Exoskeletons Market for Upper Body Exoskeletons: Historical Trends (Since 2018) and Future Estimates (Till 2035) (USD Billion)
- Figure 16.7 Medical Exoskeletons Market for Lower Body Exoskeletons: Historical Trends (Since 2018) and Future Estimates (Till 2035) (USD Billion)
- Figure 16.8 Medical Exoskeletons Market for Full Body Exoskeletons: Historical Trends (Since 2018) and Future Estimates (Till 2035) (USD Billion)
- Figure 16.9 Non-Medical Exoskeletons Market: Distribution by Body Part Covered (USD Billion)
- Figure 16.10 Non-Medical Exoskeletons Market for Upper Body Exoskeletons: Historical Trends (Since 2018) and Future Estimates (Till 2035) (USD Billion)
- Figure 16.11 Non-Medical Exoskeletons Market for Lower Body Exoskeletons: Historical Trends (Since 2018) and Future Estimates (2023- 2035) (USD Billion)
- Figure 16.12 Non-Medical Exoskeletons Market for Full Body Exoskeletons: Historical Trends (Since 2018) and Future Estimates (Till 2035) (USD Billion)
- Figure 17.1 Overall Exoskeletons Market: Distribution by Mode of Operation (USD Billion)
- Figure 17.2 Overall Exoskeletons Market for Powered Exoskeletons, Historical Trends (Since 2018) and Future Estimates (Till 2035) (USD Billion)
- Figure 17.3 Overall Exoskeletons Market for Passive Exoskeletons, Historical Trends (Since 2018) and Future Estimates (Till 2035) (USD Billion)
- Figure 17.4 Overall Exoskeletons Market for Hybrid Exoskeletons, Historical Trends (Since 2018) and Future Estimates (Till 2035) (USD Billion)
- Figure 17.5 Medical Exoskeletons Market: Distribution by Mode of Operation (USD Billion)
- Figure 17.6 Medical Powered Exoskeletons Market, Historical Trends (Since 2018) and Future Estimates (Till 2035) (USD Billion)
- Figure 17.7 Medical Passive Exoskeletons Market, Historical Trends (Since 2018) and Future Estimates (Till 2035) (USD Billion)
- Figure 17.8 Medical Hybrid Exoskeletons Market, Historical Trends (Since 2018) and Future Estimates (Till 2035) (USD Billion)
- Figure 17.9 Non-Medical Exoskeletons Market: Distribution by Mode of Operation (USD Billion)
- Figure 17.10 Non-Medical Powered Exoskeletons Market, Historical Trends (Since 2018) and Future Estimates (Till 2035) (USD Billion)
- Figure 17.11 Non-Medical Passive Exoskeletons Market, Historical Trends (Since 2018) and Future Estimates (Till 2035) (USD Billion)
- Figure 17.12 Non-Medical Hybrid Exoskeletons Market, Historical Trends (Since 2018) and Future Estimates (Till 2035) (USD Billion)
- Figure 18.1 Overall Exoskeletons Market: Distribution by Form (USD Billion)
- Figure 18.2 Overall Exoskeletons Market for Rigid Exoskeletons, Historical Trends (Since 2018) and Future Estimates (Till 2035) (USD Billion)
- Figure 18.3 Overall Exoskeletons Market for Soft Exoskeletons, Historical Trends (Since 2018) and Future Estimates (Till 2035) (USD Billion)
- Figure 18.4 Medical Exoskeletons Market: Distribution by Form (USD Billion)
- Figure 18.5 Medical Rigid Exoskeletons Market, Historical Trends (Since 2018) and Future Estimates (Till 2035) (USD Billion)
- Figure 18.6 Medical Soft Exoskeletons Market, Historical Trends (Since 2018) and Future Estimates (Till 2035) (USD Billion)
- Figure 18.7 Non-Medical Exoskeletons Market: Distribution by Form (USD Billion)
- Figure 18.8 Non-Medical Rigid Exoskeletons Market, Historical Trends (Since 2018) and Future Estimates (Till 2035) (USD Billion)
- Figure 18.9 Non-Medical Soft Exoskeletons Market, Historical Trends (Since 2018) and Future Estimates (Till 2035) (USD Billion)
- Figure 19.1 Medical Exoskeletons Market: Distribution by Mobility (USD Billion)
- Figure 19.2 Medical Fixed / Supported Exoskeletons Market: Historical Trends (Since 2018) and Future Estimates (Till 2035) (USD Billion)
- Figure 19.3 Medical Mobile / Overground Walking Exoskeletons Market: Historical Trends (Since 2018) and Future Estimates (Till 2035) (USD Billion)
- Figure 20.1 Overall Exoskeletons Market: Distribution by End Users (USD Billion)
- Figure 20.2 Exoskeletons Market for Patients, Historical Trends (Since 2018) and Future Estimates (Till 2035) (USD Billion)
- Figure 20.3 Exoskeletons Market for Healthcare Professionals, Historical Trends (Since 2018) and Future Estimates (Till 2035) (USD Billion)
- Figure 20.4 Exoskeletons Market for Industry Workers, Historical Trends (Since 2018) and Future Estimates (Till 2035) (USD Billion)
- Figure 20.5 Exoskeletons Market for Military Personnel, Historical Trends (Since 2018) and Future Estimates (Till 2035) (USD Billion)
- Figure 20.6 Exoskeletons Market for Other End Users, Historical Trends (Since 2018) and Future Estimates (Till 2035) (USD Billion)
- Figure 21.1 Overall Exoskeletons Market: Distribution by Geography
- Figure 21.2 Exoskeletons Market in North America, Historical Trends (Since 2018) and Future Estimates (Till 2035) (USD Billion)
- Figure 21.3 Exoskeletons Market in Europe, Historical Trends (Since 2018) and Future Estimates (Till 2035) (USD Billion)
- Figure 21.4 Exoskeletons Market in Asia-Pacific, Historical Trends (Since 2018) and Future Estimates (Till 2035) (USD Billion)
- Figure 21.5 Exoskeletons Market in Rest of the World, Historical Trends (Since 2018) and Future Estimates (Till 2035) (USD Billion)
- Figure 22.1 Concluding Remarks: Overall Medical Exoskeletons Market Landscape
- Figure 22.2 Concluding Remarks: Overall Non-Medical Exoskeletons Market Landscape
- Figure 22.3 Concluding Remarks: Partnerships and Collaborations
- Figure 22.4 Concluding Remarks: Patent Analysis
- Figure 22.5 Concluding Remarks: Market Forecast and Opportunity Analysis (I/II)
- Figure 22.6 Concluding Remarks: Market Forecast and Opportunity Analysis (II/II)
- Figure 24.1 Blue Ocean Strategy: Three Tiers of Non-customers
- Figure 24.2 Blue Ocean Strategy: Sequence of Blue Ocean Strategy
- Figure 24.3 Blue Ocean Strategy: The Price Corridor of The Mass

