
PUBLISHER: Roots Analysis | PRODUCT CODE: 1958586

PUBLISHER: Roots Analysis | PRODUCT CODE: 1958586
Connected Drug Delivery Devices Market (3rd Edition): Distribution by Type of Device, Mode of Connectivity, Route of Administration, Therapeutic Area & Geographical Regions - Trends and Forecast Till 2035
Connected Drug Delivery Devices Market: Overview
As per Roots Analysis, the global connected drug delivery market is estimated to grow from USD 5.3 billion in the current year to USD 12.7 billion by 2035, at a CAGR of 10.2% during the forecast period, till 2035.
Connected Drug Delivery Devices Market: Growth and Trends
Over the years, poor compliance to prescribed medications continues to be a significant issue in the healthcare field, leading to disease progression, increased hospitalization rates, mortality, and rising healthcare expenses. Studies indicate that approximately 66% of individuals in the United States receive at least one prescription, yet nearly 50% fail to adhere to their physicians' instructions for medication use. This challenge of non-adherence arises from multiple factors, such as complicated dosing regimens, restricted access to medications, and inadequate patient assistance. To address this, healthcare professionals and technology providers are using various strategies to streamline dosage plans, provide individualized medication schedules, and improve patient education.
Connected drug delivery devices represent a viable solution as these devices integrate traditional delivery methods with digital health technologies to improve adherence. These devices come with advanced features, sensors, and wireless connectivity that allow for smooth integration with mobile apps, digital health platforms, and electronic health records. Additionally, the linked drug delivery system allows for real-time tracking of medication consumption and patient health conditions, thus facilitating prompt clinical interventions and customized therapy modifications. By enhancing patient involvement and adherence, these devices not only bolster patient results but also help in reducing total healthcare costs.
Further, the integration of sensor technologies has transformed the capabilities of conventional drug delivery systems, allowing them to evolve into intelligent, interconnected solutions. Ongoing advancements in telehealth integration and broader acceptance of digital health tools are anticipated to fuel consistent growth in the connected drug delivery device market in the upcoming years.
Growth Drivers: Strategic Enablers of Market Expansion
Rising chronic disease prevalence, including diabetes, asthma, chronic obstructive pulmonary disease (COPD), and autoimmune disorders, fuels demand. This is due to the fact that connected drug delivery devices enable precise dosing and long-term therapy management. Technological advances in sensors, Bluetooth Low Energy, AI analytics, and IoT integration allow remote monitoring, data sharing with providers, and personalized interventions, boosting adherence and outcomes. Patient engagement and aging populations further accelerate growth, with market projections showing a higher CAGR driven by telehealth synergies and precision medicine shifts.
Market Challenges: Critical Barriers Impeding Progress
Connected drug delivery devices, which integrate sensors and apps for real-time adherence tracking and remote monitoring in chronic conditions like diabetes and asthma, face multifaceted market challenges that hinder their widespread adoption. High development and manufacturing costs driven by advanced sensors, R&D, precision assembly, and supply chain issues elevate prices above traditional devices, compounded by ongoing cloud fees, tariffs, and payer reimbursement gaps. Further, stringent regulatory hurdles for drug-device combinations and global compliance delays, clash with rapid tech evolution and limit AI innovations. In addition, cybersecurity and data privacy risks hamper user trust and restrict data sharing, while usage barriers like usability issues persist.
Connected Drug Delivery Devices Market: Key Insights
The report delves into the current state of the connected drug delivery devices market and identifies potential growth opportunities within industry. Some key findings from the report include:
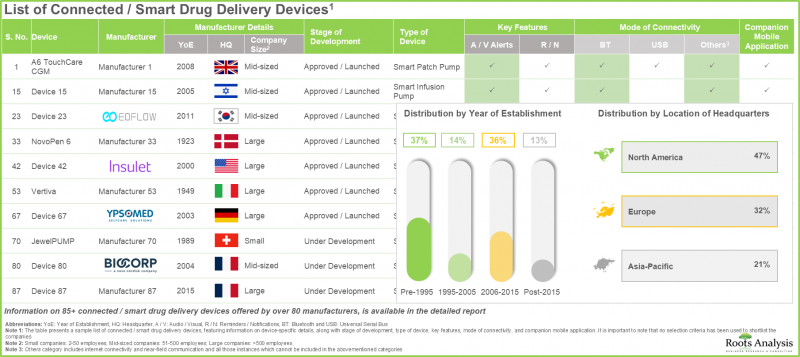
- The current market landscape features the presence of more than 80 manufacturers that offer various connected drug delivery devices; of these, majority are headquartered in North America.
- Nearly 75% of the connected / smart drug delivery devices are currently commercially available; notably, most of these devices are intended for the administration of medications via subcutaneous route.
- At present, over 30 innovative add-on sensors are available / under development for integration with conventional drug delivery devices; numerous add-on sensor manufacturers are start-ups based in Europe.
- More than 55% of the add-on sensors are designed for drug delivery via inhalation; of these, over 85% of the sensors can support Bluetooth connectivity.
- The majority of clinical trials registered in this domain till date have evaluated the safety and efficacy of various connected drug delivery devices; most of these studies have been conducted across multiple sites in the US.
- The growing interest of stakeholders in this market is reflected from the rising partnerships established among various stakeholders in the recent past; in fact, close to 70% of the deals were inked in the last three years.
- Investors are increasingly channelizing capital into connected drug delivery devices market for the development of advanced devices which are accelerating industry advancements.
- The development process of a connected / smart drug delivery device involves various steps, ranging from planning, designing, engineering, process validation, manufacturing and assembly to commercialization.
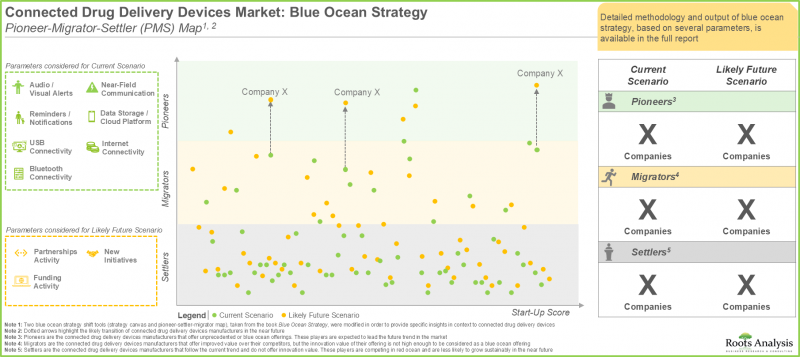
- The pioneer-migrator-settler map in blue ocean strategy analysis suggests that several connected drug delivery devices manufacturers focused on enhancing their products are likely to emerge as pioneers in the coming years.
- Owing to the ability of connected drug delivery devices to provide precise dosing and remote patient monitoring, the market is anticipated to witness a notable growth (CAGR of 10.2%) over the next decade.
- The connected drug delivery devices market in North America is expected to capture maximum share by 2035; further, majority of the devices manufactured for drug delivery are intended for metabolic disorders.
- Driven by the growing adoption of smart and connected drug delivery solutions in the US, the connected drug delivery devices market is poised to grow at a higher CAGR over the forecast period.
- Given the surge in demand for advanced drug delivery devices and the rising prevalence of chronic diseases, the connected drug delivery devices market is anticipated to rise steadily.
Connected Drug Delivery Devices Market
The market sizing and opportunity analysis has been segmented across the following parameters:
By Type of Device
- Connected / Smart Wearable Injectors
- Connected / Smart Inhalers
- Connected / Smart Pen Injectors
- Connected / Smart Autoinjectors
- Connected / Smart Needle-free Injection Systems
By Mode of Connectivity
- Bluetooth-enabled Devices
- Near Field Communication-enabled Devices
- Cellular-enabled Devices
- Wide Area Network-enabled Devices
By Route of Administration
- Parenteral
- Inhalational
By Therapeutic Area
- Metabolic Disorders
- Respiratory Disorders
- Autoimmune Disorders
- Other Disorders
By Geographical Regions
- North America
- US
- Canada
- Europe
- UK
- Germany
- France
- Italy
- Spain
- Rest of Europe
- Asia-Pacific
- China
- India
- Japan
- Rest of Asia-Pacific
Connected Drug Delivery Devices Market: Key Segments
Connected / Smart Wearable Injectors Account for the Largest Market Share
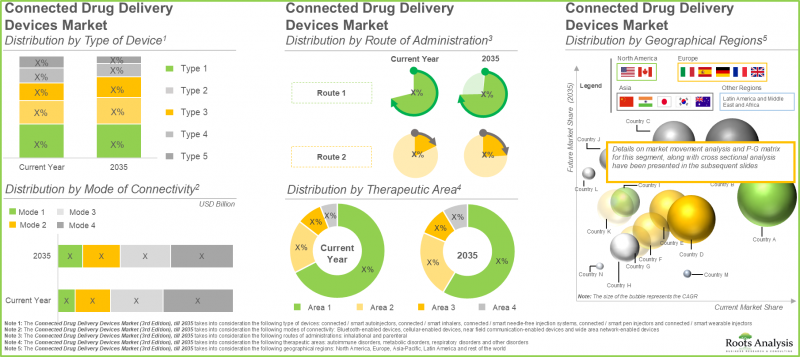
In the current year, the connected / smart wearable injectors holds the largest market share, and this trend is expected to persist in the coming years. This is due to the increasing prevalence of chronic diseases and the ongoing initiatives of stakeholders to incorporate enhanced features into their connected drug delivery devices. These improvements enhance monitoring, strengthen patient compliance, and allow data exchange with healthcare professionals.
Bluetooth-Enabled Connected / Smart Devices Hold the Highest Share in the Future
At present, Bluetooth-enabled connected / smart devices are expected to capture a larger share of the connected drug delivery devices market. Moreover, this segment is expected to experience substantial growth during the forecasted period. This is because Bluetooth connectivity is simple to set up, widely accessible on all smartphones, and operates without requiring any additional devices.
Parenteral Segment Holds the Highest Connected Drug Delivery Devices Market Share in the Current Year
According to our estimates, in the current year, the parenteral segment is likely to hold a larger market share. This is because it is the favored route for administering biologics and high-value treatments for chronic conditions. Further, the inhalation segment is expected to experience a higher CAGR over the forecast period, owing to the ease, versatility, and painless nature of drug delivery through this method, along with its ability for prolonged localized therapeutic effect.
North America Dominates the Market by Securing Highest Share
According to our estimates, North America is expected to dominate the connected drug delivery devices market share this year. Further, the Asia-Pacific market is expected to expand at a comparatively higher rate till 2035. The growth is driven by a rising number of biopharmaceutical start-ups, significant research and development efforts for innovative drug delivery systems, and an increase in device approvals for various disease therapies in this area.
Primary Research Overview
Discussions with multiple stakeholders in this domain influenced the opinions and insights presented in this study. The market report includes transcripts of the following other third-party discussions:
- Senior Director, Global Strategic Marketing, Medical, Large Company, US
- Co-Founder and Chief Executive Officer, Small Company, US
- Chief Executive Officer, Small Company, US
- Chief Executive Officer and President, Mid-sized Company, US
- Chief Executive Officer, Small Company, Italy
- Vice President and Chief Scientist, Large Company, Israel
- Director of Global Communications, and Former Vice President of Strategic Partnerships and Business Development, Mid-sized Company, US
- Former Chief Executive Officer, Small Company, US
- Former Director of Front-end Innovation and Head of Connected Health, Large Company, US
- Former Vice President, Marketing and Alliance Management, Mid-sized Company, US
- Advisor of Strategy and Business Development, Small Company, US
Example Players in Connected Drug Delivery Devices Market
- Bigfoot Biomedical
- BIOCORP
- Eitan Medical
- E3D Elcam Drug Delivery Device
- EoFlow
- Gerresheimer
- Insulet
- Medtronic
- Medtrum
- Nemera
- Phillips-Medisize
- Roche
- Sonceboz
- SOOIL Development
- Tandem Diabetes Care
- West Pharmaceutical Services
- Ypsomed
Connected Drug Delivery Devices Market: Research Coverage
- Market Sizing and Opportunity Analysis: The report features an in-depth analysis of the connected drug delivery devices market, focusing on key market segments, including [A] type of device [B] mode of connectivity, [C] route of administration, [D] therapeutic area, and [E] geographical regions.
- Connected / Smart Drug Delivery Devices Market Landscape: A detailed overview of the overall market landscape of integrated connected drug delivery devices, along with information on several relevant parameters, such as [A] stage of development, [B] launch year of device, [C] type of integrated device, [D] route of administration, [E] target indication, therapeutic area, [F] key features, [G] mode of connectivity, [H] availability of companion mobile application and availability of data storage / cloud platform, [I] year of establishment, [J] company size, [K] location of headquarters and [H] most active players.
- Add-On Sensors Market Landscape: : A detailed overview overall market landscape of add-on sensors market landscape, along with information on several relevant parameters, such as [A] stage of development, [B] launch year of device, [C] compatible device, [D] route of administration, [E] target indication, [F] therapeutic area, [G] target indication, [H] key features, [I] mode of connectivity, [J] availability of companion mobile application and [K] availability of data storage / cloud platform, [L] year of establishment, [M] company size, [N] location of headquarters and [O] most active players.
- Product Competitiveness Analysis: An insightful analysis of connected drug delivery devices and add-on sensors based on the [A] manufacturer strength and [B] portfolio strength.
- Company Profiles: In-depth profiles of leading players manufacturing connected drug delivery devices in North America, Europe and Asia-Pacific based on [A] year of establishment, [B] location of headquarters, [C] product portfolio, [D] recent developments and [E] an informed future outlook.
- Clinical Trial Analysis: An analysis of completed and ongoing clinical trials related to connected drug delivery devices, based on several relevant parameters, such as [A] trial registration year, [B] enrolled patient population, [C] trial status, [D] type of sponsor / collaborator, [E] study design [F] and geography.
- Partnerships and Collaborations: An analysis of partnerships and collaborations inked between stakeholders, based on several relevant parameters, such as [A] year of partnership, [B] type of partnership, [C] class of device, [D] type of integrated device, [E] most active players.
- Funding and Investment Analysis: An analysis of funding and investment signed in the domain based on several relevant parameters, such as [A] year of funding, [B] type of funding, [C] amount invested, [D] geography, [E] and most active players.
- Value Chain Analysis: An in-depth value chain analysis featuring a discussion on various steps involved in the development of connected / smart drug delivery devices, including research and development (R&D), product manufacturing and assembly, product distribution, marketing and sales, and post-market surveillance, along with the information on cost requirements across each of the aforementioned stages.
- Regulatory Landscape: An informative summary of various guidelines established and issued by major regulatory bodies for the approval of connected drug delivery devices, across different countries / geographical regions.
- Case Studies: Detailed case studies on two most common indications (namely asthma and diabetes), featuring a brief description of the disease, its epidemiology, economic burden (imposed due to non-adherence to prescribed treatments), and a summary of the evolution of drug delivery devices and other strategies focused on improving therapy adherence among patients suffering from the indication.
- Blue Ocean Analysis: A detailed analysis of the current and future market based on blue ocean strategy, covering a strategic plan / guide for emerging connected drug delivery device companies to help unlock an uncontested market, featuring strategic tools that can help them to shift towards a blue ocean in order to gain a competitive edge in the market.
- SWOT Analysis: A detailed discussion on industry affiliated trends, opportunities and challenges, under a SWOT analysis, which are likely to impact the evolution of connected drug delivery devices market.
Key Questions Answered in this Report
- Which are the leading companies in connected drug delivery devices market?
- Which region dominates the connected drug delivery devices market?
- What are the key trends observed in the connected drug delivery devices market?
- What factors are likely to influence the evolution of this market?
- What are the primary challenges faced by connected drug delivery device developers?
- What is the current and future market size?
- What is the CAGR of this market?
- How is the current and future market opportunity likely to be distributed across key market segments?
Reasons to Buy this Report
- The report provides a comprehensive market analysis, offering detailed revenue projections of the overall market and its specific sub-segments. This information is valuable to both established market leaders and emerging entrants.
- The report offers stakeholders a comprehensive overview of the market, including key drivers, barriers, opportunities, and challenges. This information empowers stakeholders to stay abreast of market trends and make data-driven decisions to capitalize on growth prospects.
- The report can aid businesses in identifying future opportunities in any sector. It also helps in understanding if those opportunities are worth pursuing.
- The report helps in identifying customer demand by understanding the needs, preferences, and behavior of the target audience in order to tailor products or services effectively.
- The report equips new entrants with requisite information regarding a particular market to help them build successful business strategies.
- The report allows for more effective communication with the audience and in building strong business relations.
Additional Benefits
- Complementary PPT Insights Pack
- Complimentary Excel Data Packs for all Analytical Modules in the Report
- 15% Free Content Customization
- Detailed Report Walkthrough Session with Research Team
- Free Updated report if the report is 6-12 months old or older
TABLE OF CONTENTS
1. PREFACE
- 1.1. Introduction
- 1.2. Market Share Insights
- 1.3. Key Market Insights
- 1.4. Report Coverage
- 1.5. Key Questions Answered
- 1.6. Chapter Outlines
2. RESEARCH METHODOLOGY
- 2.1. Chapter Overview
- 2.2. Research Assumptions
- 2.2.1. Market Landscape and Market Trends
- 2.2.2. Market Forecast and Opportunity Analysis
- 2.2.3. Comparative Analysis
- 2.3. Database Building
- 2.3.1. Data Collection
- 2.3.2. Data Validation
- 2.3.3. Data Analysis
- 2.4. Project Methodology
- 2.4.1. Secondary Research
- 2.4.1.1. Annual Reports
- 2.4.1.2. Academic Research Papers
- 2.4.1.3. Company Websites
- 2.4.1.4. Investor Presentations
- 2.4.1.5. Regulatory Filings
- 2.4.1.6. White Papers
- 2.4.1.7. Industry Publications
- 2.4.1.8. Conferences and Seminars
- 2.4.1.9. Government Portals
- 2.4.1.10. Media and Press Releases
- 2.4.1.11. Newsletters
- 2.4.1.12. Industry Databases
- 2.4.1.13. Roots Proprietary Databases
- 2.4.1.14. Paid Databases and Sources
- 2.4.1.15. Social Media Portals
- 2.4.1.16. Other Secondary Sources
- 2.4.2. Primary Research
- 2.4.2.1. Types of Primary Research
- 2.4.2.1.1. Qualitative Research
- 2.4.2.1.2. Quantitative Research
- 2.4.2.1.3. Hybrid Approach
- 2.4.2.2. Advantages of Primary Research
- 2.4.2.3. Techniques for Primary Research
- 2.4.2.3.1. Interviews
- 2.4.2.3.2. Surveys
- 2.4.2.3.3. Focus Groups
- 2.4.2.3.4. Observational Research
- 2.4.2.3.5. Social Media Interactions
- 2.4.2.4. Key Opinion Leaders Considered in Primary Research
- 2.4.2.4.1. Company Executives (CXOs)
- 2.4.2.4.2. Board of Directors
- 2.4.2.4.3. Company Presidents and Vice Presidents
- 2.4.2.4.4. Research and Development Heads
- 2.4.2.4.5. Technical Experts
- 2.4.2.4.6. Subject Matter Experts
- 2.4.2.4.7. Scientists
- 2.4.2.4.8. Doctors and Other Healthcare Providers
- 2.4.2.5. Ethics and Integrity
- 2.4.2.5.1. Research Ethics
- 2.4.2.5.2. Data Integrity
- 2.4.2.1. Types of Primary Research
- 2.4.3. Analytical Tools and Databases
- 2.4.1. Secondary Research
- 2.5. Robust Quality Control
3. MARKET DYNAMICS
- 3.1. Chapter Overview
- 3.2. Forecast Methodology
- 3.2.1. Top-down Approach
- 3.2.2. Bottom-up Approach
- 3.2.3. Hybrid Approach
- 3.3. Market Assessment Framework
- 3.3.1. Total Addressable Market (TAM)
- 3.3.2. Serviceable Addressable Market (SAM)
- 3.3.3. Serviceable Obtainable Market (SOM)
- 3.3.4. Currently Acquired Market (CAM)
- 3.4. Forecasting Tools and Techniques
- 3.4.1. Qualitative Forecasting
- 3.4.2. Correlation
- 3.4.3. Regression
- 3.4.4. Extrapolation
- 3.4.5. Convergence
- 3.4.6. Sensitivity Analysis
- 3.4.7. Scenario Planning
- 3.4.8. Data Visualization
- 3.4.9. Time Series Analysis
- 3.4.10. Forecast Error Analysis
- 3.5. Key Considerations
- 3.5.1. Demographics
- 3.5.2. Government Regulations
- 3.5.3. Reimbursement Scenarios
- 3.5.4. Market Access
- 3.5.5. Supply Chain
- 3.5.6. Industry Consolidation
- 3.5.7. Pandemic / Unforeseen Disruptions Impact
- 3.6. Limitations
4. MACRO-ECONOMIC INDICATORS
- 4.1. Chapter Overview
- 4.2. Market Dynamics
- 4.2.1. Time Period
- 4.2.1.1. Historical Trends
- 4.2.1.2. Current and Forecasted Estimates
- 4.2.2. Currency Coverage
- 4.2.2.1. Major Currencies Affecting the Market
- 4.2.2.2. Factors Affecting Currency Fluctuations on the Industry
- 4.2.2.3. Impact of Currency Fluctuations on the Industry
- 4.2.3. Foreign Currency Exchange Rate
- 4.2.3.1. Impact of Foreign Exchange Rate Volatility on the Market
- 4.2.3.2. Strategies for Mitigating Foreign Exchange Risk
- 4.2.4. Recession
- 4.2.4.1. Assessment of Current Economic Conditions and Potential Impact on the Market
- 4.2.4.2. Historical Analysis of Past Recessions and Lessons Learnt
- 4.2.5. Inflation
- 4.2.5.1. Measurement and Analysis of Inflationary Pressures in the Economy
- 4.2.5.2. Potential Impact of Inflation on the Market Evolution
- 4.2.6. Interest Rates
- 4.2.6.1. Interest Rates and Their Impact on the Market
- 4.2.6.2. Strategies for Managing Interest Rate Risk
- 4.2.7. Commodity Flow Analysis
- 4.2.7.1. Type of Commodity
- 4.2.7.2. Origins and Destinations
- 4.2.7.3. Values and Weights
- 4.2.7.4. Modes of Transportation
- 4.2.8. Global Trade Dynamics
- 4.2.8.1. Import Scenario
- 4.2.8.2. Export Scenario
- 4.2.8.3. Trade Policies
- 4.2.8.4. Strategies for Mitigating the Risks Associated with Trade Barriers
- 4.2.8.5. Impact of Trade Barriers on the Market
- 4.2.9. War Impact Analysis
- 4.2.9.1. Russian-Ukraine War
- 4.2.9.2. Israel-Hamas War
- 4.2.10. COVID Impact / Related Factors
- 4.2.10.1. Global Economic Impact
- 4.2.10.2. Industry-specific Impact
- 4.2.10.3. Government Response and Stimulus Measures
- 4.2.10.4. Future Outlook and Adaptation Strategies
- 4.2.11. Other Indicators
- 4.2.11.1. Fiscal Policy
- 4.2.11.2. Consumer Spending
- 4.2.11.3. Gross Domestic Product
- 4.2.11.4. Employment
- 4.2.11.5. Taxes
- 4.2.11.6. Stock Market Performance
- 4.2.11.7. Cross Border Dynamics
- 4.2.1. Time Period
- 4.3. Conclusion
5. EXECUTIVE SUMMARY
6. INTRODUCTION
- 6.1. Chapter Overview
- 6.2. Medication Adherence
- 6.2.1. Digital Tools for Improving Medication Adherence
- 6.3. Overview of Connected / Smart Drug Delivery Devices
- 6.4. Key Design Features and Development Process
- 6.5. Classification of Connected / Smart Drug Delivery Devices
- 6.5.1. Type of Device
- 6.5.1.1. Connected Inhalers
- 6.5.1.2. Connected Handheld Injectors
- 6.5.1.3. Smart Pills
- 6.5.1.4. Smart Implantable Devices
- 6.5.2. Type of Technology
- 6.5.1. Type of Device
- 6.6. Regulatory Guidelines for Connected / Smart Drug Delivery Devices
- 6.7. Advantages and Limitations of Connected / Smart Drug Delivery Devices
- 6.8. Impact of COVID-19 on Connected / Smart Drug Delivery Devices Domain
- 6.9. Future Perspective
7. MARKET LANDSCAPE: CONNECTED / SMART DRUG DELIVERY DEVICES
- 7.1. Chapter Overview
- 7.2. Connected / Smart Drug Delivery Devices: Overall Market Landscape
- 7.2.1. Analysis by Stage of Development
- 7.2.2. Analysis by Launch Year
- 7.2.3. Analysis by Type of Integrated Device
- 7.2.4. Analysis by Route of Administration
- 7.2.5. Analysis by Target Indication
- 7.2.6. Analysis by Therapeutic Area
- 7.2.7. Analysis by Key Features
- 7.2.8. Analysis by Mode of Connectivity
- 7.2.9. Analysis by Availability of Companion Mobile Application
- 7.2.10. Analysis by Availability of Data Storage / Cloud Platform
- 7.3. Connected / Smart Drug Delivery Device Manufacturers: Overall Market Landscape
- 7.3.1. Analysis by Year of Establishment
- 7.3.2. Analysis by Company Size
- 7.3.3. Analysis by Location of Headquarters
- 7.3.4. Analysis by Year of Establishment and Location of Headquarters
- 7.3.5. Analysis by Company Size and Location of Headquarters
- 7.3.6. Most Active Players: Analysis by Number of Connected / Smart Drug Delivery Devices Manufactured
8. MARKET LANDSCAPE: ADD-ON SENSORS
- 8.1. Chapter Overview
- 8.2. Add-on Sensors: Overall Market Landscape
- 8.2.1. Analysis by Stage of Development
- 8.2.2. Analysis by Launch Year
- 8.2.3. Analysis by Compatible Device
- 8.2.4. Analysis by Route of Administration
- 8.2.5. Analysis by Target Indication
- 8.2.6. Analysis by Therapeutic Area
- 8.2.7. Analysis by Key Features
- 8.2.8. Analysis by Mode of Connectivity
- 8.2.9. Analysis by Availability of Companion Mobile Application
- 8.2.10. Analysis by Availability of Data Storage / Cloud Platform
- 8.3. Add-on Sensor Manufacturers: Overall Market Landscape
- 8.3.1. Analysis by Year of Establishment
- 8.3.2. Analysis by Company Size
- 8.3.3. Analysis by Location of Headquarters
- 8.3.4. Analysis by Year of Establishment and Location of Headquarters
- 8.3.5. Analysis by Company Size and Location of Headquarters
- 8.3.6. Most Active Players: Analysis by Number of Add-on Sensors Manufactured
9. PRODUCT COMPETITIVENESS ANALYSIS
- 9.1. Chapter Overview
- 9.2. Assumptions and Key Parameters
- 9.3. Methodology
- 9.4. Connected Drug Delivery Devices and Add-on Sensors: Product Competitiveness Analysis
- 9.4.1. Connected / Smart Drug Delivery Devices
- 9.4.1.1. Smart Handheld Injectors (Peer Group 1a)
- 9.4.1.2. Smart Wearable Injectors (Peer Group 1b)
- 9.4.1.3. Other Integrated Devices (Peer Group 1c)
- 9.4.2. Add-on Sensors (Peer Group 2)
- 9.4.1. Connected / Smart Drug Delivery Devices
10. COMPANY PROFILES: CONNECTED / SMART DRUG DELIVERY DEVICE MANUFACTURERS BASED IN NORTH AMERICA
- 10.1. Chapter Overview
- 10.2. Leading Connected / Smart Drug Delivery Device Manufacturers
- 10.2.1. Medtronic
- 10.2.1.1. Company Overview
- 10.2.1.2. Financial Information
- 10.2.1.3. Connected / Smart Drug Delivery Devices Portfolio
- 10.2.1.4. Recent Developments and Future Outlook
- 10.2.2. Insulet
- 10.2.2.1. Company Overview
- 10.2.2.2. Financial Information
- 10.2.2.3. Connected / Smart Drug Delivery Devices Portfolio
- 10.2.2.4. Recent Developments and Future Outlook
- 10.2.3. Tandem Diabetes Care
- 10.2.3.1. Company Overview
- 10.2.3.2. Financial Information
- 10.2.3.3. Connected / Smart Drug Delivery Devices Portfolio
- 10.2.3.4. Recent Developments and Future Outlook
- 10.2.1. Medtronic
- 10.3. Other Prominent Connected / Smart Drug Delivery Device Manufacturers
- 10.3.1. Bigfoot Biomedical
- 10.3.1.1. Company Overview
- 10.3.1.2. Connected / Smart Drug Delivery Devices Portfolio
- 10.3.2. Phillips Medisize (a subsidiary of Molex)
- 10.3.2.1. Company Overview
- 10.3.2.2. Connected / Smart Drug Delivery Devices Portfolio
- 10.3.3. West Pharmaceutical Services
- 10.3.3.1. Company Overview
- 10.3.3.2. Connected / Smart Drug Delivery Devices Portfolio
- 10.3.1. Bigfoot Biomedical
11. COMPANY PROFILES: CONNECTED / SMART DRUG DELIVERY DEVICE MANUFACTURERS BASED IN EUROPE
- 11.1. Chapter Overview
- 11.2. Leading Connected / Smart Drug Delivery Device Manufacturers
- 11.2.1. BIOCORP
- 11.2.1.1. Company Overview
- 11.2.1.2. Financial Information
- 11.2.1.3. Connected / Smart Drug Delivery Devices Portfolio
- 11.2.1.4. Recent Developments and Future Outlook
- 11.2.2. Gerresheimer
- 11.2.2.1. Company Overview
- 11.2.2.2. Financial Information
- 11.2.2.3. Connected / Smart Drug Delivery Devices Portfolio
- 11.2.2.4. Recent Developments and Future Outlook
- 11.2.3. Roche
- 11.2.3.1. Company Overview
- 11.2.3.2. Financial Information
- 11.2.3.3. Connected / Smart Drug Delivery Devices Portfolio
- 11.2.3.4. Recent Developments and Future Outlook
- 11.2.4. Ypsomed
- 11.2.4.1. Company Overview
- 11.2.4.2. Financial Information
- 11.2.4.3. Connected / Smart Drug Delivery Devices Portfolio
- 11.2.4.4. Recent Developments and Future Outlook
- 11.2.1. BIOCORP
- 11.3. Other Prominent Connected / Smart Drug Delivery Device Manufacturers
- 11.3.1. Nemera
- 11.3.1.1. Company Overview
- 11.3.1.2. Connected / Smart Drug Delivery Devices Portfolio
- 11.3.2. Sonceboz
- 11.3.2.1. Company Overview
- 11.3.2.2. Connected / Smart Drug Delivery Devices Portfolio
- 11.3.1. Nemera
12. COMPANY PROFILES: CONNECTED / SMART DRUG DELIVERY DEVICE MANUFACTURERS BASED IN ASIA-PACIFIC AND REST OF THE WORLD
- 12.1. Chapter Overview
- 12.2. Leading Connected / Smart Drug Delivery Device Manufacturers
- 12.2.1. Medtrum
- 12.2.1.1. Company Overview
- 12.2.1.2. Connected / Smart Drug Delivery Devices Portfolio
- 12.2.1.3. Recent Developments and Future Outlook
- 12.2.2. SOOIL Development
- 12.2.2.1. Company Overview
- 12.2.2.2. Connected / Smart Drug Delivery Devices Portfolio
- 12.2.2.3. Recent Developments and Future Outlook
- 12.2.3. EOFlow
- 12.2.3.1. Company Overview
- 12.2.3.2. Financial Information
- 12.2.3.3. Connected / Smart Drug Delivery Devices Portfolio
- 12.2.3.4. Recent Developments and Future Outlook
- 12.2.1. Medtrum
- 12.3. Other Prominent Connected / Smart Drug Delivery Device Manufacturers
- 12.3.1. Eitan Medical
- 12.3.1.1. Company Overview
- 12.3.1.2. Connected / Smart Drug Delivery Devices Portfolio
- 12.3.2. E3D Elcam Drug Delivery Device
- 12.3.2.1. Company Overview
- 12.3.2.2. Connected / Smart Drug Delivery Devices Portfolio
- 12.3.1. Eitan Medical
13. CLINICAL TRIAL ANALYSIS
- 13.1. Chapter Overview
- 13.2. Scope and Methodology
- 13.3. Connected / Smart Drug Delivery Devices and Add-on Sensors: Clinical Trial Analysis
- 13.3.1. Analysis by Trial Registration Year
- 13.3.2. Analysis of Enrolled Patient Population by Trial Registration Year
- 13.3.3. Analysis by Trial Status
- 10.3.4. Analysis by Trial Registration Year and Trial Status
- 13.3.5. Analysis of Number of Enrolled Patients Population by Trial Status
- 13.3.6. Analysis by Target Patient Population
- 13.3.7. Analysis by Type of Sponsor / Collaborator
- 13.3.8. Analysis by Study Design
- 10.3.8.1. Analysis by Type of Allocation
- 10.3.8.2. Analysis by Type of Intervention Model
- 10.3.8.3. Analysis by Type of Masking
- 10.3.8.4. Analysis by Trial Purpose
- 13.3.9. Leading Players: Analysis by Number of Registered Trials
- 13.3.10. Leading Connected / Smart Drug Delivery Devices and Add-on Sensors: Analysis by Number of Registered Trials
- 13.3.11. Analysis by Geography
- 13.3.11.1. Analysis of Clinical Trials by Geography
- 13.3.11.2. Analysis of Number of Registered Trials by Trial Status and Geography
- 13.3.11.3. Analysis of Number of Enrolled Patient Population by Geography
14. PARTNERSHIPS AND COLLABORATIONS
- 14.1. Chapter Overview
- 14.2. Partnership Models
- 14.3. Connected / Smart Drug Delivery Devices: Partnerships and Collaborations
- 14.3.1. Analysis by Year of Partnership
- 14.3.2. Analysis by Type of Partnership
- 14.3.3. Analysis by Year and Type of Partnership
- 14.3.4. Analysis by Class of Device
- 14.3.5. Analysis by Type of Integrated Device
- 14.3.6. Most Active Players: Analysis by Number of Partnerships
- 14.3.7. Analysis by Geography
- 14.3.7.1. Intracontinental and Intercontinental Deals
- 14.3.7.2. Local and International Deals
15. FUNDING AND INVESTMENT ANALYSIS
- 15.1. Chapter Overview
- 15.2. Funding Models
- 15.3. Connected / Smart Drug Delivery Devices: Funding and Investments
- 15.3.1. Analysis by Year of Funding
- 15.3.2. Analysis by Type of Funding
- 15.3.3. Analysis by Year and Type of Funding
- 15.3.4. Analysis of Amount Invested by Year of Funding
- 15.3.5. Analysis of Amount Invested by Type of Funding
- 15.3.6. Analysis by Geography
- 15.3.7. Most Active Players: Analysis by Number of Funding Instances
- 15.3.8. Most Active Players: Analysis by Amount Raised
16. VALUE CHAIN ANALYSIS
- 16.1. Chapter Overview
- 16.2. Connected / Smart Drug Delivery Devices: Value Chain
- 16.3. Cost Distribution across the Value Chain
- 16.3.1. Concept Development and Proof of Concept
- 16.3.2. Research and Product Development
- 16.3.3. Conduct of Clinical Trials
- 16.3.4. Regulatory Approvals
- 16.3.5. Manufacturing and Product Assembly
- 16.3.6. Application Development
- 16.3.7. Marketing and Sales
17. REGULATORY LANDSCAPE FOR CONNECTED / SMART DRUG DELIVERY DEVICES
- 17.1. Chapter Overview
- 17.2. Regulatory Approval of Combination Products in North America
- 17.2.1. Regulatory Approval of Combination Products in the US
- 17.2.1.1. Overview
- 17.2.1.2. Historical Background
- 17.2.1.3. Role of Regulatory Bodies in Product Approval
- 17.2.2. Regulatory Approval of Combination Products in Canada
- 17.2.2.1. Overview
- 17.2.2.2. Role of Regulatory Bodies in Product Approval
- 17.2.3. Regulatory Approval of Combination Products in Mexico
- 17.2.3.1. Overview
- 17.2.3.2. Role of Regulatory Bodies in Product Approval
- 17.2.1. Regulatory Approval of Combination Products in the US
- 17.3. Regulatory Approval of Combination Products in Europe
- 17.3.1. Regulatory Approval of Combination Products in EU5 Countries
- 17.3.1.1. Overview
- 17.3.1.2. Role of Regulatory Bodies in Product Approval
- 17.3.1. Regulatory Approval of Combination Products in EU5 Countries
- 17.4. Regulatory Approval of Combination Products in Asia-Pacific
- 17.4.1. Regulatory Approval of Combination Products in Japan
- 17.4.1.1. Overview
- 17.4.1.2. Role of Regulatory Bodies in Product Approval
- 17.4.2. Regulatory Approval of Combination Products in China
- 17.4.2.1. Overview
- 17.4.2.2. Role of Regulatory Bodies in Product Approval
- 17.4.3. Regulatory Approval of Combination Products in India
- 17.4.3.1. Overview
- 17.4.3.2. Role of Regulatory Bodies in Product Approval
- 17.4.4. Regulatory Approval of Combination Products in South Korea
- 17.4.4.1. Overview
- 17.4.4.2. Role of Regulatory Bodies in Product Approval
- 17.4.5. Regulatory Approval of Combination Products in Australia
- 17.4.5.1. Overview
- 17.4.5.2. Role of Regulatory Bodies in Product Approval
- 17.4.1. Regulatory Approval of Combination Products in Japan
- 17.5. Regulatory Approval of Combination Products in Middle East and North Africa
- 17.5.1. Regulatory Approval of Combination Products in Saudi Arabia
- 17.5.1.1. Overview
- 17.5.1.2. Role of Regulatory Bodies in Product Approval
- 17.5.2. Regulatory Approval of Combination Products in United Arab Emirates
- 17.5.2.1. Overview
- 17.5.2.2. Role of Regulatory Bodies in Product Approval
- 17.5.1. Regulatory Approval of Combination Products in Saudi Arabia
- 17.6. Regulatory Approval of Combination Products in Latin America
- 17.6.1. Regulatory Approval of Combination Products in Brazil
- 17.6.1.1. Overview
- 17.6.1.2. Role of Regulatory Bodies in Product Approval
- 17.6.2. Regulatory Approval of Combination Products in Argentina
- 17.6.2.1. Overview
- 17.6.2.2. Role of Regulatory Bodies in Product Approval
- 17.6.1. Regulatory Approval of Combination Products in Brazil
- 17.7. Connected Devices: Other Measures for Testing Safety, Effectiveness and Performance
- 17.8. Ensuring Security of Data Captured
- 17.9. Concluding Remarks
18. CASE STUDIES: APPLICATION OF CONNECTED DRUG DELIVERY DEVICES TO IMPROVE MEDICATION ADHERENCE
- 18.1. Chapter Overview
- 18.2. Case Study I: Diabetes
- 18.2.1. Disease Overview
- 18.2.2. Key Statistics
- 18.2.3. Economic Burden due to Non-Adherence
- 18.2.4. Evolution of Connected / Smart Drug Delivery Devices for Improving Adherence
- 18.3. Case Study II: Asthma
- 18.3.1. Disease Overview
- 18.3.2. Key Statistics
- 18.3.3. Economic Burden due to Non-Adherence
- 18.3.4. Evolution of Connected / Smart Drug Delivery Devices for Improving Adherence
19. SWOT ANALYSIS
- 19.1. Chapter Overview
- 19.2. Strengths
- 19.2.1. Ability to Minimize / Eliminate Medication Errors
- 19.2.2. Economic Advantages
- 19.2.3. Technological Advancements
- 19.3. Weaknesses
- 19.3.1. Cybersecurity
- 19.3.2. Stringent Regulatory Approvals
- 19.3.3. High Developmental Costs
- 19.4. Opportunities
- 19.4.1. Growing Prevalence of Chronic Disorders
- 19.4.2. Increasing Adoption of Digital Health Technologies
- 19.4.3. Rising Partnership and Investment Activity
- 19.5. Threats
- 19.5.1. Material Compatibility Issues
- 19.5.2. Availability of Alternative Drug Delivery Devices
- 19.5.3. Concern Related to Product Recalls in Past
- 19.6. Comparison of SWOT Factors
20. BLUE OCEAN STRATEGY
- 20.1. Overview of Blue Ocean Strategy
- 20.1.1. Red Oceans
- 20.1.2. Blue Oceans
- 20.1.3. Comparison of Red Ocean Strategy and Blue Ocean Strategy
- 20.1.4. Connected Drug Delivery Devices: Blue Ocean Strategy and Shift Tools
- 20.1.4.1. Strategy Canvas
- 20.1.4.2. Pioneer-Migrator-Settler (PMS) Map
21. GLOBAL CONNECTED DRUG DELIVERY DEVICES MARKET
- 21.1. Chapter Overview
- 21.2. Assumptions and Methodology
- 21.3. Global Connected Drug Delivery Devices Market: Historical Trends (since 2020) and Forecasted Estimates (till 2035)
- 21.3.1. Scenario Analysis
- 21.3.1.1. Conservative Scenario
- 21.3.1.2. Optimistic Scenario
- 21.3.1. Scenario Analysis
- 21.4. Key Market Segmentations
22. CONNECTED DRUG DELIVERY DEVICES MARKET, BY TYPE OF DEVICE
- 22.1. Chapter Overview
- 22.2. Assumptions and Methodology
- 22.3. Connected Drug Delivery Devices Market: Distribution by Type of Device
- 22.3.1. Connected Drug Delivery Devices Market for Connected / Smart Wearable Injectors: Historical Trends (since 2020) and Forecasted Estimates (till 2035)
- 22.3.2. Connected Drug Delivery Devices Market for Connected / Smart Inhalers: Historical Trends (since 2020) and Forecasted Estimates (till 2035)
- 22.3.3. Connected Drug Delivery Devices Market for Connected / Smart Pen Injectors: Historical Trends (since 2020) and Forecasted Estimates (till 2035)
- 22.3.4. Connected Drug Delivery Devices Market for Connected / Smart Autoinjectors: Historical Trends (since 2020) and Forecasted Estimates (till 2035)
- 22.3.5. Connected Drug Delivery Devices Market for Connected / Smart Needle-free Injection Systems: Historical Trends (since 2020) and Forecasted Estimates (till 2035)
- 22.4. Data Triangulation and Validation
23. CONNECTED DRUG DELIVERY DEVICES MARKET, BY MODE OF CONNECTIVITY
- 23.1. Chapter Overview
- 23.2. Assumptions and Methodology
- 23.3. Connected Drug Delivery Devices Market: Distribution by Mode of Connectivity
- 23.3.1. Connected Drug Delivery Devices Market for Bluetooth-enabled Devices: Historical Trends (since 2020) and Forecasted Estimates (till 2035)
- 23.3.2. Connected Drug Delivery Devices Market for Near-field Communication-enabled Devices: Historical Trends (since 2020) and Forecasted Estimates (till 2035)
- 23.3.3. Connected Drug Delivery Devices Market for Cellular-enabled Devices: Historical Trends (since 2020) and Forecasted Estimates (till 2035)
- 23.3.4. Connected Drug Delivery Devices Market for Wide Area Network-enabled Devices: Historical Trends (since 2020) and Forecasted Estimates (till 2035)
- 23.4. Data Triangulation and Validation
24. CONNECTED DRUG DELIVERY DEVICES MARKET, BY ROUTE OF ADMINISTRATION
- 24.1. Chapter Overview
- 24.2. Assumptions and Methodology
- 24.3. Connected Drug Delivery Devices Market: Distribution by Route of Administration
- 24.3.1. Connected Drug Delivery Devices Market for Parenteral Administration: Historical Trends (since 2020) and Forecasted Estimates (till 2035)
- 24.3.2. Connected Drug Delivery Devices Market for Inhalational Administration: Historical Trends (since 2020) and Forecasted Estimates (till 2035)
- 24.4. Data Triangulation and Validation
25. CONNECTED DRUG DELIVERY DEVICES MARKET, BY THERAPEUTIC AREA
- 25.1. Chapter Overview
- 25.2. Assumptions and Methodology
- 25.3. Connected Drug Delivery Devices Market: Distribution by Therapeutic Area
- 25.3.1. Connected Drug Delivery Devices Market for Metabolic Disorders: Historical Trends (since 2020) and Forecasted Estimates (till 2035)
- 25.3.2. Connected Drug Delivery Devices Market for Respiratory Disorders: Historical Trends (since 2020) and Forecasted Estimates (till 2035)
- 25.3.3. Connected Drug Delivery Devices Market for Autoimmune Disorders: Historical Trends (since 2020) and Forecasted Estimates (till 2035)
- 25.3.4. Connected Drug Delivery Devices Market for Other Disorders: Historical Trends (since 2020) and Forecasted Estimates (till 2035)
- 25.4. Data Triangulation and Validation
26. CONNECTED DRUG DELIVERY DEVICES MARKET, BY GEOGRAPHICAL REGIONS
- 26.1. Chapter Overview
- 26.2. Assumptions and Methodology
- 26.3. Connected Drug Delivery Devices Market: Distribution by Geographical Regions
- 26.3.1. Connected Drug Delivery Devices Market in North America: Historical Trends (since 2020) and Forecasted Estimates (till 2035)
- 26.3.1.1. Connected Drug Delivery Devices Market in the US: Historical Trends (since 2020) and Forecasted Estimates (till 2035)
- 26.3.1.2. Connected Drug Delivery Devices Market in Canada: Historical Trends (since 2020) and Forecasted Estimates (till 2035)
- 26.3.2. Connected Drug Delivery Devices Market in Europe: Historical Trends (since 2020) and Forecasted Estimates (till 2035)
- 26.3.2.1. Connected Drug Delivery Devices Market in the UK: Historical Trends (since 2020) and Forecasted Estimates (till 2035)
- 26.3.2.2. Connected Drug Delivery Devices Market in Germany: Historical Trends (since 2020) and Forecasted Estimates (till 2035)
- 26.3.2.3. Connected Drug Delivery Devices Market in France: Historical Trends (since 2020) and Forecasted Estimates (till 2035)
- 26.3.2.4. Connected Drug Delivery Devices Market in Italy: Historical Trends (since 2020) and Forecasted Estimates (till 2035)
- 26.3.2.5. Connected Drug Delivery Devices Market in Spain: Historical Trends (since 2020) and Forecasted Estimates (till 2035)
- 26.3.2.6. Connected Drug Delivery Devices Market in Rest of Europe: Historical Trends (since 2020) and Forecasted Estimates (till 2035)
- 26.3.3. Connected Drug Delivery Devices Market in Asia-Pacific: Historical Trends (since 2020) and Forecasted Estimates (till 2035)
- 26.3.3.1. Connected Drug Delivery Devices Market in China: Historical Trends (since 2020) and Forecasted Estimates (till 2035)
- 26.3.3.2. Connected Drug Delivery Devices Market in India: Historical Trends (since 2020) and Forecasted Estimates (till 2035)
- 26.3.3.3. Connected Drug Delivery Devices Market in Japan: Historical Trends (since 2020) and Forecasted Estimates (till 2035)
- 26.3.3.4. Connected Drug Delivery Devices Market in Rest of Asia-Pacific: Historical Trends (since 2020) and Forecasted Estimates (till 2035)
- 26.3.4. Connected Drug Delivery Devices Market in Middle East and North Africa: Historical Trends (since 2020) and Forecasted Estimates (till 2035)
- 26.3.4.1. Connected Drug Delivery Devices Market in Egypt: Historical Trends (since 2020) and Forecasted Estimates (till 2035)
- 26.3.4.2. Connected Drug Delivery Devices Market in Israel: Historical Trends (since 2020) and Forecasted Estimates (till 2035)
- 26.3.4.3. Connected Drug Delivery Devices Market in Saudi Arabia: Historical Trends (since 2020) and Forecasted Estimates (till 2035)
- 26.3.4.4. Connected Drug Delivery Devices Market in Rest of Middle East and North Africa: Historical Trends (since 2020) and Forecasted Estimates (till 2035)
- 26.3.5. Connected Drug Delivery Devices Market in Latin America and Rest of the World: Historical Trends (since 2020) and Forecasted Estimates (till 2035)
- 26.3.5.1. Connected Drug Delivery Devices Market in Brazil: Historical Trends (since 2020) and Forecasted Estimates (till 2035)
- 26.3.5.2. Connected Drug Delivery Devices Market in Argentina: Historical Trends (since 2020) and Forecasted Estimates (till 2035)
- 26.3.5.3. Connected Drug Delivery Devices Market in Other Countries: Historical Trends (since 2020) and Forecasted Estimates (till 2035)
- 26.3.1. Connected Drug Delivery Devices Market in North America: Historical Trends (since 2020) and Forecasted Estimates (till 2035)
- 26.4. Data Triangulation and Validation
27. CONNECTED DRUG DELIVERY DEVICES MARKET, BY LEADING PLAYERS
28. CONCLUDING REMARKS
29. EXECUTIVE INSIGHTS
30. APPENDIX 1: TABULATED DATA
31. APPENDIX 2: LIST OF COMPANIES AND ORGANIZATIONS
32. APPENDIX 3: PARTNERSHIPS AND COLLABORATIONS, 2015-2020
List of Tables
- Table 7.1 Connected / Smart Drug Delivery Devices: Information on Manufacturer, Stage of Development, Launch Year, Type of Integrated Device and Route of Administration
- Table 7.2 Connected / Smart Drug Delivery Devices: Information on Therapeutic Area, Target Indication and Key Features
- Table 7.3 Connected / Smart Drug Delivery Devices: Information on Mode of Connectivity, Availability of Companion Mobile Application, Compatible Operating System and Availability of Data Storage / Cloud Platform
- Table 7.4 Connected / Smart Drug Delivery Devices: Information on Regulatory Approvals, Geographical Reach and Compatible Drug
- Table 7.5 Connected / Smart Drug Delivery Device Manufacturers: Information on Year of Establishment, Company Size and Location of Headquarters
- Table 8.1 Add-on Sensors: Information on Manufacturer, Stage of Development, Launch Year, Type of Integrated Device and Route of Administration
- Table 8.2 Add-on Sensors: Information on Therapeutic Area, Target Indication and Key Features
- Table 8.3 Add-on Sensors: Information on Mode of Connectivity, Availability of Companion Mobile Application, and Availability of Data Storage / Cloud Platform
- Table 8.4 Add-on Sensors: Information on Regulatory Approval, Geographical Reach and Drug Delivered
- Table 8.5 Add-on Sensor Manufacturers: Information on Year of Establishment, Company Size and Location of Headquarters
- Table 9.1 Product Competitiveness Analysis: Connected / Smart Drug Delivery Devices
- Table 10.1 Connected / Smart Drug Delivery Device Manufacturers in North America: List of Companies Profiled
- Table 10.2 Medtronic: Company Overview
- Table 10.3 Medtronic: Connected / Smart Drug Delivery Devices Portfolio
- Table 10.4 Medtronic: Recent Developments and Future Outlook
- Table 10.5 Insulet: Company Overview
- Table 10.6 Insulet: Connected / Smart Drug Delivery Devices Portfolio
- Table 10.7 Insulet: Recent Developments and Future Outlook
- Table 10.8 Tandem Diabetes Care: Company Overview
- Table 10.9 Tandem Diabetes Care: Connected / Smart Drug Delivery Devices Portfolio
- Table 10.10 Tandem Diabetes Care: Recent Developments and Future Outlook
- Table 10.11 Bigfoot Biomedical: Company Overview
- Table 10.12 Bigfoot Biomedical: Connected / Smart Drug Delivery Devices Portfolio
- Table 10.13 Phillips-Medsize (a subsidiary of Molex): Company Overview
- Table 10.14 Phillips-Medsize (a subsidiary of Molex): Connected / Smart Drug Delivery Devices Portfolio
- Table 10.15 West Pharmaceutical Services: Company Overview
- Table 10.16 West Pharmaceutical Services: Connected / Smart Drug Delivery Devices Portfolio
- Table 11.1 Connected / Smart Drug Delivery Device Manufacturers in Europe: List of Companies Profiled
- Table 11.2 BIOCORP: Company Overview
- Table 11.3 BIOCORP: Connected / Smart Drug Delivery Devices Portfolio
- Table 11.4 BIOCORP: Recent Developments and Future Outlook
- Table 11.5 Gerresheimer: Company Overview
- Table 11.6 Gerresheimer: Connected / Smart Drug Delivery Devices Portfolio
- Table 11.7 Gerresheimer: Recent Developments and Future Outlook
- Table 11.8 Roche: Company Overview
- Table 11.9 Roche: Connected / Smart Drug Delivery Devices Portfolio
- Table 11.10 Roche: Recent Developments and Future Outlook
- Table 11.11 Ypsomed: Company Overview
- Table 11.12 Ypsomed: Connected / Smart Drug Delivery Devices Portfolio
- Table 11.13 Ypsomed: Recent Developments and Future Outlook
- Table 11.14 Nemera: Company Overview
- Table 11.15 Nemera: Connected / Smart Drug Delivery Devices Portfolio
- Table 11.16 Sonceboz: Company Overview
- Table 11.17 Sonceboz: Connected / Smart Drug Delivery Devices Portfolio
- Table 12.1 Connected / Smart Drug Delivery Device Manufacturers in Asia-Pacific and Rest of the World: List of Companies Profiled
- Table 12.2 Medtrum: Company Overview
- Table 12.3 Medtrum: Connected / Smart Drug Delivery Devices Portfolio
- Table 12.4 SOOIL Development: Company Overview
- Table 12.5 SOOIL Development: Connected / Smart Drug Delivery Devices Portfolio
- Table 12.6 SOOIL Development: Recent Developments and Future Outlook
- Table 12.7 EOFlow: Company Overview
- Table 12.8 EOFlow: Connected / Smart Drug Delivery Devices Portfolio
- Table 12.9 EOFlow: Recent Developments and Future Outlook
- Table 12.10 Eitan Medical: Company Overview
- Table 12.11 Eitan Medical: Connected / Smart Drug Delivery Devices Portfolio
- Table 12.12 E3D Elcam Drug Delivery Device: Company Overview
- Table 12.13 E3D Elcam Drug Delivery Device: Connected / Smart Drug Delivery Devices Portfolio
- Table 14.1 Connected / Smart Drug Delivery Devices: List of Partnerships and Collaborations, since 2021
- Table 15.1 Connected / Smart Drug Delivery Devices: List of Funding and Investments, since 2021
- Table 17.1 FDA Centers for Drug and Device Approval
- Table 17.2 Regulatory Review Timelines for Combination Products in the US
- Table 17.3 Regulatory Bodies in EU5 Countries
- Table 17.4 SFDA: Regulatory Review Timeline
- Table 27.1 Connected Drug Delivery Devices Market: Leading Industry Players
- Table 27.1 Company A: Company Overview
- Table 27.2 Company B: Company Overview
- Table 27.3 Company C: Company Overview
- Table 27.4 Company D: Company Overview
- Table 27.5 Company E: Company Overview
- Table 27.6 Company F: Company Overview
- Table 27.7 Company G: Company Overview
- Table 27.8 Company H: Company Overview
- Table 27.9 Company I: Company Overview
- Table 27.10 Company J: Company Overview
- Table 27.11 Company K: Company Overview
- Table 28.1 Connected / Smart Drug Delivery Devices: Distribution by Stage of Development
- Table 28.2 Connected / Smart Drug Delivery Devices: Distribution by Launch Year
- Table 28.3 Connected / Smart Drug Delivery Devices: Distribution by Type of Integrated Device
- Table 28.4 Connected / Smart Drug Delivery Devices: Distribution by Route of Administration
- Table 28.5 Connected / Smart Drug Delivery Devices: Distribution by Therapeutic Area
- Table 28.6 Connected / Smart Drug Delivery Devices: Distribution by Target Indication
- Table 28.7 Connected / Smart Drug Delivery Devices: Distribution by Key Features
- Table 28.8 Connected / Smart Drug Delivery Devices: Distribution by Mode of Connectivity
- Table 28.9 Connected / Smart Drug Delivery Devices: Distribution by Availability of Companion Mobile Application
- Table 28.10 Connected / Smart Drug Delivery Devices: Distribution by Availability of Data Storage / Cloud Platform
- Table 28.11 Connected / Smart Drug Delivery Device Manufacturers: Distribution by Year of Establishment
- Table 28.12 Connected / Smart Drug Delivery Device Manufacturers: Distribution by Company Size
- Table 28.13 Connected / Smart Drug Delivery Device Manufacturers: Distribution by Location of Headquarters
- Table 28.14 Connected / Smart Drug Delivery Device Manufacturers: Distribution by Year of Establishment and Location of Headquarters (Region)
- Table 28.15 Connected / Smart Drug Delivery Device Manufacturers: Distribution by Company Size and Location of Headquarters (Region)
- Table 28.16 Most Active Players: Distribution by Number of Connected / Smart Drug Delivery Devices Manufactured
- Table 28.17 Add-on Sensors: Distribution by Stage of Development
- Table 28.18 Add-on Sensors: Distribution by Launch Year
- Table 28.19 Add-on Sensors: Distribution by Compatible Device
- Table 28.20 Add-on Sensors: Distribution by Route of Administration
- Table 28.21 Add-on Sensors: Distribution by Target Indication
- Table 28.22 Add-on Sensors: Distribution by Therapeutic Area
- Table 28.23 Add-on Sensors: Distribution by Key Features
- Table 28.24 Add-on Sensors: Distribution by Mode of Connectivity
- Table 28.25 Add-on Sensors: Distribution by Availability of Companion Mobile Application
- Table 28.26 Add-on Sensors: Distribution by Availability of Data Storage / Cloud Platform
- Table 28.27 Add-on Sensor Manufacturers: Distribution by Year of Establishment
- Table 28.28 Add-on Sensor Manufacturers: Distribution by Company Size
- Table 28.29 Add-on Sensor Manufacturers: Distribution by Location of Headquarters
- Table 28.30 Add-on Sensor Manufacturers: Distribution by Year of Establishment and Location of Headquarters
- Table 28.31 Add-on Sensor Manufacturers: Distribution by Company Size and Location of Headquarters
- Table 28.32 Most Active Players: Distribution by Number of Add-on Sensors Manufactured
- Table 28.33 Medtronic: Business Segment-wise Revenues and Consolidated Financial Details (USD Billion)
- Table 28.34 Insulet: Business Segment-wise Revenues and Consolidated Financial Details (USD Million)
- Table 28.35 Tandem Diabetes Care: Consolidated Financial Details (USD Million)
- Table 28.36 Gerresheimer: Business Segment-wise Revenues and Consolidated Financial Details (EUR Million)
- Table 28.37 Roche: Business Segment-wise Revenues and Consolidated Financial Details (CHF Billion)
- Table 28.38 Ypsomed: Business Segment-wise Revenues and Consolidated Financial Details (CHF Million)
- Table 28.39 Clinical Trial Analysis: Distribution by Trial Registration Year, since 2021
- Table 28.40 Clinical Trial Analysis: Year-wise Trend of Patients Enrolled by Trial Registration Year, since 2021
- Table 28.41 Clinical Trial Analysis: Distribution by Trial Status
- Table 28.42 Clinical Trial Analysis: Distribution by Enrolled Patient Population by Trial Registration Year
- Table 28.43 Clinical Trial Analysis: Distribution by Trial Registration Year and Trial Status
- Table 28.44 Clinical Trial Analysis: Distribution of Number of Enrolled Patient Population by Trial Status
- Table 28.45 Clinical Trial Analysis: Distribution by Target Patient Population
- Table 28.46 Clinical Trial Analysis: Distribution by Type of Sponsor / Collaborator
- Table 28.47 Clinical Trial Analysis: Distribution by Study Design
- Table 28.48 Clinical Trial Analysis: Distribution by Type of Allocation
- Table 28.49 Clinical Trial Analysis: Distribution by Type of Intervention Model
- Table 28.50 Clinical Trial Analysis: Distribution by Type of Masking
- Table 28.51 Clinical Trial Analysis: Distribution by Trial Purpose
- Table 28.52 Leading Players: Distribution by Number of Registered Trials
- Table 28.53 Leading Connected / Smart Drug Delivery Devices and Add-On Sensors: Distribution by Number of Registered Trials
- Table 28.54 Clinical Trial Analysis: Distribution of Clinical Trials by Geography
- Table 28.55 Clinical Trial Analysis: Distribution of Number of Registered Trials by Trial Status and Geography
- Table 28.56 Clinical Trial Analysis: Distribution of Number of Enrolled Patients Population by Geography
- Table 28.57 Partnerships and Collaborations: Cumulative Year-wise Trend, since 2021
- Table 28.58 Partnerships and Collaborations: Distribution by Type of Partnership
- Table 28.59 Partnerships and Collaborations: Distribution by Year and Type of Partnership, since 2021
- Table 28.60 Partnerships and Collaborations: Distribution by Class of Device
- Table 28.61 Partnerships and Collaborations: Distribution by Type of Integrated Device
- Table 28.62 Partnerships and Collaborations: Distribution by Compatible Device
- Table 28.63 Most Active Players: Distribution by Number of Partnerships
- Table 28.64 Partnerships and Collaborations: Intercontinental and Intracontinental Deals
- Table 28.65 Partnerships and Collaborations: Local and International Deals
- Table 28.66 Funding and Investment Analysis: Cumulative Year-wise Trend, since 2021
- Table 28.67 Funding and Investment Analysis: Distribution by Amount Invested, since 2021 (USD Million)
- Table 28.68 Funding and Investment Analysis: Distribution of Funding Instances by Type of Funding
- Table 28.69 Funding and Investments: Distribution by Amount Invested by Type of Funding (USD Million)
- Table 28.70 Distribution of Funding Instances by Year and Type of Funding, since 2021
- Table 28.71 Funding and Investments: Distribution of Funding Instances by Geography
- Table 28.72 Most Active Players: Distribution by Number of Funding Instances
- Table 28.73 Most Active Players: Distribution by Amount Raised (USD Million)
- Table 28.74 Funding and Investments Summary, since 2021 (USD Million)
- Table 28.75 Global Connected Drug Delivery Devices Demand, Historical Trends, since 2020 (Million Units Sold)
- Table 28.76 Global Connected Drug Delivery Devices Demand, till 2035 (Million Units Sold)
- Table 28.77 Global Connected Drug Delivery Devices Market, Historical Trends, Since 2020 (USD Million)
- Table 28.78 Global Connected Drug Delivery Devices Market, till 2035 (USD Million)
- Table 28.79 Connected Drug Delivery Devices Market: Distribution by Type of Device (USD Million)
- Table 28.80 Connected Drug Delivery Devices Demand for Connected / Smart Wearable Injectors, Historical Trends, since 2020 (Million Units Sold)
- Table 28.81 Connected Drug Delivery Devices Demand for Connected / Smart Wearable Injectors, till 2035 (Million Units Sold)
- Table 28.82 Connected Drug Delivery Devices Market for Connected / Smart Wearable Injectors, Historical Trends, Since 2020 (USD Million)
- Table 28.83 Connected Drug Delivery Devices Market for Connected / Smart Wearable Injectors, till 2035 (USD Million)
- Table 28.84 Connected Drug Delivery Devices Demand for Connected / Smart Inhalers, Historical Trends, since 2020 (Million Units Sold)
- Table 28.85 Connected Drug Delivery Devices Demand for Connected / Smart Inhalers, till 2035 (Million Units Sold)
- Table 28.86 Connected Drug Delivery Devices Market for Connected / Smart Inhalers, Historical Trends, since 2020 (USD Million)
- Table 28.87 Connected Drug Delivery Devices Market for Connected / Smart Inhalers, till 2035 (USD Million)
- Table 28.88 Connected Drug Delivery Devices Demand for Connected / Smart Pen Injectors, Historical Trends, since 2020 (Million Units Sold)
- Table 28.89 Connected Drug Delivery Devices Demand for Connected / Smart Pen Injectors, till 2035 (Million Units Sold)
- Table 28.90 Connected Drug Delivery Devices Market for Connected / Smart Pen Injectors, Historical Trends, since 2020 (USD Million)
- Table 28.91 Connected Drug Delivery Devices Market for Connected / Smart Pen Injectors, till 2035 (USD Million)
- Table 28.92 Connected Drug Delivery Devices Demand for Connected / Smart Autoinjectors, Historical Trends, since 2020 (Million Units Sold)
- Table 28.93 Connected Drug Delivery Devices Demand for Connected / Smart Autoinjectors, till 2035 (Million Units Sold)
- Table 28.94 Connected Drug Delivery Devices Market for Connected / Smart Autoinjectors, Historical Trends, since 2020 (USD Million)
- Table 28.95 Connected Drug Delivery Devices Market for Connected / Smart Autoinjectors, till 2035 (USD Million)
- Table 28.96 Connected Drug Delivery Devices Demand for Connected / Smart Needle-free Injection Systems, till 2035 (Million Units Sold)
- Table 28.97 Connected Drug Delivery Devices Demand for Connected / Smart Needle-free Injection Systems, till 2035 (USD Million)
- Table 28.98 Connected Drug Delivery Devices Market: Distribution by Mode of Connectivity, 2020, 2024 and 2035 (USD Million)
- Table 28.99 Connected Drug Delivery Devices Demand for Bluetooth-enabled Devices, Historical Trends, since 2020 (Million Units Sold)
- Table 28.100 Connected Drug Delivery Devices Demand for Bluetooth-enabled Devices, till 2035 (Million Units Sold)
- Table 28.101 Connected Drug Delivery Devices Market for Bluetooth-enabled Devices, Historical Trends, since 2020 (USD Million)
- Table 28.102 Connected Drug Delivery Devices Market for Bluetooth-enabled Devices, till 2035 (USD Million)
- Table 28.103 Connected Drug Delivery Devices Demand for Near-field Communication-enabled Devices, Historical Trends, since 2020 (Million Units Sold)
- Table 28.104 Connected Drug Delivery Devices Demand for Near-field Communication-enabled Devices, till 2035 (Million Units Sold)
- Table 28.105 Connected Drug Delivery Devices Market for Near-field Communication-enabled Devices, Historical Trends, since 2020 (USD Million)
- Table 28.106 Connected Drug Delivery Devices Market for Near-field Communication-enabled Devices, till 2035 (USD Million)
- Table 28.107 Connected Drug Delivery Devices Demand for Cellular-enabled Devices, Historical Trends, since 2020 (Million Units Sold)
- Table 28.108 Connected Drug Delivery Devices Demand for Cellular-enabled Devices, till 2035 (Million Units Sold)
- Table 28.109 Connected Drug Delivery Devices Market for Cellular-enabled Devices, Historical Trends, since 2020 (USD Million)
- Table 28.110 Connected Drug Delivery Devices Market for Cellular-enabled Devices, till 2035 (USD Million)
- Table 28.111 Connected Drug Delivery Devices Demand for Wide Area Network-enabled Devices, Historical Trends, since 2020 (Million Units Sold)
- Table 28.112 Connected Drug Delivery Devices Demand for Wide Area Network-enabled Devices, till 2035 (Million Units Sold)
- Table 28.113 Connected Drug Delivery Devices Market for Wide Area Network-enabled Devices, Historical Trends, since 2020 (USD Million)
- Table 28.114 Connected Drug Delivery Devices Market for Wide Area Network-enabled Devices, till 2035 (USD Million)
- Table 28.115 Connected Drug Delivery Devices Market: Distribution by Route of Administration, 2020, 2024 and 2035 (USD Million)
- Table 28.116 Connected Drug Delivery Demand for Parenteral Administration, Historical Trends, since 2020 (Million Units Sold)
- Table 28.117 Connected Drug Delivery Devices Demand for Parenteral Administration, till 2035 (Million Units Sold)
- Table 28.118 Connected Drug Delivery Devices Market for Parenteral Administration, Historical Trends, since 2020 (USD Million)
- Table 28.119 Connected Drug Delivery Devices Market for Parenteral Administration, till 2035 (USD Million)
- Table 28.120 Connected Drug Delivery Devices Demand for Inhalational Administration, Historical Trends, since 2020 (Million Units Sold)
- Table 28.121 Connected Drug Delivery Devices Demand for Inhalational Administration, till 2035 (Million Units Sold)
- Table 28.122 Connected Drug Delivery Devices Market for Inhalational Administration, Since 2020 (USD Million)
- Table 28.123 Connected Drug Delivery Devices Market for Inhalational Administration, till 2035 (USD Million)
- Table 28.124 Connected Drug Delivery Devices Market: Distribution by Therapeutic Area, 2020, 2024 and 2035 (USD Million)
- Table 28.125 Connected Drug Delivery Devices Demand for Metabolic Disorders, Historical Trends, since 2020 (Million Units Sold)
- Table 28.126 Connected Drug Delivery Devices Demand for Metabolic Disorders, till 2035 (Million Units Sold)
- Table 28.127 Connected Drug Delivery Devices Market for Metabolic Disorders, Historical Trends, since 2020 (USD Million)
- Table 28.128 Connected Drug Delivery Devices Market for Metabolic Disorders, till 2035 (USD Million)
- Table 28.129 Connected Drug Delivery Devices Demand for Respiratory Disorders, Historical Trends, since 2020 (Million Units Sold)
- Table 28.130 Connected Drug Delivery Devices Demand for Respiratory Disorders, till 2035 (Million Units Sold)
- Table 28.131 Connected Drug Delivery Devices Market for Respiratory Disorders, Historical Trends, since 2020 (USD Million)
- Table 28.132 Connected Drug Delivery Devices Market for Respiratory Disorders, till 2035 (USD Million)
- Table 28.133 Connected Drug Delivery Devices Demand for Autoimmune Disorders, Historical Trends, since 2020 (Million Units Sold)
- Table 28.134 Connected Drug Delivery Devices Demand for Autoimmune Disorders, till 2035 (Million Units Sold)
- Table 28.135 Connected Drug Delivery Devices Market for Autoimmune Disorders, Historical Trends, since 2020 (USD Million)
- Table 28.136 Connected Drug Delivery Devices Market for Autoimmune Disorders, till 2035 (USD Million)
- Table 28.137 Connected Drug Delivery Devices Demand for Other Disorders, Historical Trends, since 2020 (Million Units Sold)
- Table 28.138 Connected Drug Delivery Devices Demand for Other Disorders, till 2035 (Million Units Sold)
- Table 28.139 Connected Drug Delivery Devices Market for Other Disorders, Historical Trends, since 2020 (USD Million)
- Table 28.140 Connected Drug Delivery Devices Market for Other Disorders, till 2035 (USD Million)
- Table 28.141 Connected Drug Delivery Devices Market: Distribution by Geographical Regions, 2020, 2024 and 2035 (USD Million)
- Table 28.142 Connected Drug Delivery Devices Demand in North America, Historical Trends, since 2020 (Million Units Sold)
- Table 28.143 Connected Drug Delivery Devices Demand in North America, till 2035 (Million Units Sold)
- Table 28.144 Connected Drug Delivery Devices Market in North America, Historical Trends, since 2020 (USD Million)
- Table 28.145 Connected Drug Delivery Devices Market in North America, till 2035 (USD Million)
- Table 28.146 Connected Drug Delivery Devices Market in the US, Historical Trends, Since 2020 (USD Million)
- Table 28.147 Connected Drug Delivery Devices Market in the US, till 2035 (USD Million)
- Table 28.148 Connected Drug Delivery Devices Market in Canada, Historical Trends, since 2020 (USD Million)
- Table 28.149 Connected Drug Delivery Devices Market in Canada, till 2035 (USD Million)
- Table 28.150 Connected Drug Delivery Devices Demand in Europe, Historical Trends, since 2020 (Million Units Sold)
- Table 28.151 Connected Drug Delivery Devices Demand in Europe, till 2035 (Million Units Sold)
- Table 28.152 Connected Drug Delivery Devices Market in Europe, Historical Trends, since 2020 (USD Million)
- Table 28.153 Connected Drug Delivery Devices Market in Europe, till 2035 (USD Million)
- Table 28.154 Connected Drug Delivery Devices Market in the UK, Historical Trends, since 2020 (USD Million)
- Table 28.155 Connected Drug Delivery Devices Market in the UK, till 2035 (USD Million)
- Table 28.156 Connected Drug Delivery Devices Market in Germany, Historical Trends, since 2020 (USD Million)
- Table 28.157 Connected Drug Delivery Devices Market in Germany, till 2035 (USD Million)
- Table 28.158 Connected Drug Delivery Devices Market in France, Historical Trends, Since 2020 (USD Million)
- Table 28.159 Connected Drug Delivery Devices Market in France, till 2035 (USD Million)
- Table 28.160 Connected Drug Delivery Devices Market in Italy, Historical Trends, since 2020 (USD Million)
- Table 28.161 Connected Drug Delivery Devices Market in Italy, till 2035 (USD Million)
- Table 28.162 Connected Drug Delivery Devices Market in Spain, Historical Trends, since 2020 (USD Million)
- Table 28.163 Connected Drug Delivery Devices Market in Spain, till 2035 (USD Million)
- Table 28.164 Connected Drug Delivery Devices Market in Rest of Europe, Historical Trends, since 2020 (USD Million)
- Table 28.165 Connected Drug Delivery Devices Market in Rest of Europe, till 2035 (USD Million)
- Table 28.166 Connected Drug Delivery Devices Demand in Asia-Pacific, Historical Trends, since 2020 (Million Units Sold)
- Table 28.167 Connected Drug Delivery Devices Demand in Asia-Pacific, till 2035 (Million Units Sold)
- Table 28.168 Connected Drug Delivery Devices Market in Asia-Pacific, Historical Trends, since 2020 (USD Million)
- Table 28.169 Connected Drug Delivery Devices Market in Asia-Pacific, till 2035 (USD Million)
- Table 28.170 Connected Drug Delivery Devices Market in China, Historical Trends, since 2020 (USD Million)
- Table 28.171 Connected Drug Delivery Devices Market in China, till 2035 (USD Million)
- Table 28.172 Connected Drug Delivery Devices Market in India, Historical Trends, Since 2020 (USD Million)
- Table 28.173 Connected Drug Delivery Devices Market in India, till 2035 (USD Million)
- Table 28.174 Connected Drug Delivery Devices Market in Japan, Historical Trends, Since 2020 (USD Million)
- Table 28.175 Connected Drug Delivery Devices Market in Japan, till 2035 (USD Million)
- Table 28.176 Connected Drug Delivery Devices Market in Rest of the Asia-Pacific, Historical Trends, since 2020 (USD Million)
- Table 28.177 Connected Drug Delivery Devices Market in Rest of the Asia-Pacific, till 2035 (USD Million)
- Table 28.178 Connected Drug Delivery Devices Demand in Middle East and North Africa, Historical Trends, since 2020 (Million Units Sold)
- Table 28.179 Connected Drug Delivery Devices Demand in Middle East and North Africa, till 2035 (Million Units Sold)
- Table 28.180 Connected Drug Delivery Devices Market in Middle East and North Africa, Historical Trends, Since 2020 (USD Million)
- Table 28.181 Connected Drug Delivery Devices Market in Middle East and North Africa, till 2035 (USD Million)
- Table 28.182 Connected Drug Delivery Devices Market in Egypt, Historical Trends, since 2020 (USD Million)
- Table 28.183 Connected Drug Delivery Devices Market in Egypt, till 2035 (USD Million)
- Table 28.184 Connected Drug Delivery Devices Market in Israel, Historical Trends, since 2020 (USD Million)
- Table 28.185 Connected Drug Delivery Devices Market in Israel, till 2035 (USD Million)
- Table 28.186 Connected Drug Delivery Devices Market in Saudi Arabia, Historical Trends, since 2020 (USD Million)
- Table 28.187 Connected Drug Delivery Devices Market in Saudi Arabia, till 2035 (USD Million)
- Table 28.188 Connected Drug Delivery Devices Market in Rest of the Middle East and North Africa, Historical Trends, since 2020 (USD Million)
- Table 28.189 Connected Drug Delivery Devices Market in Rest of the Middle East and North Africa, till 2035 (USD Million)
- Table 28.190 Connected Drug Delivery Devices Demand in Latin America and Rest of the World, Historical Trends, since 2020 (Million Units Sold)
- Table 28.191 Connected Drug Delivery Devices Demand in Latin America and Rest of the World, till 2035 (Million Units Sold)
- Table 28.192 Connected Drug Delivery Devices Market in Latin America and Rest of the World, Historical Trends, since 2020 (USD Million)
- Table 28.193 Connected Drug Delivery Devices Market in Latin America and Rest of the World, till 2035 (USD Million)
- Table 28.194 Connected Drug Delivery Devices Market in Brazil, Historical Trends, since 2020 (USD Million)
- Table 28.195 Connected Drug Delivery Devices Market in Brazil, till 2035 (USD Million)
- Table 28.196 Connected Drug Delivery Devices Market in Argentina, Historical Trends, since 2020 (USD Million)
- Table 28.197 Connected Drug Delivery Devices Market in Argentina, till 2035 (USD Million)
- Table 28.198 Connected Drug Delivery Devices Market in Rest of the World, Historical Trends, since 2020 (USD Million)
- Table 28.199 Connected Drug Delivery Devices Market in Rest of the World, till 2035 (USD Million)
List of Figures
- Figure 2.1 Research Methodology: Project Methodology
- Figure 2.2 Research Methodology: Data Sources for Secondary Research
- Figure 3.1 Market Dynamics: Forecast Methodology
- Figure 3.2 Market Dynamics: Key Market Segmentation
- Figure 3.3 Market Dynamics: Robust Quality Control
- Figure 4.1 Lessons Learnt from Past Recessions
- Figure 5.1 Executive Summary: Connected / Smart Drug Delivery Devices Market Landscape
- Figure 5.2 Executive Summary: Add-on Sensors Market Landscape
- Figure 5.3 Executive Summary: Market Trends
- Figure 5.4 Executive Summary: Market Forecast and Opportunity Analysis
- Figure 6.1 Different Components of IoT Ecosystem
- Figure 6.2 Framework of Connected / Smart Drug Delivery Devices
- Figure 6.3 Key Considerations for Designing and Developing a Connected / Smart Drug Delivery Device
- Figure 6.4 Stack Model for the Development of Connected Drug Delivery Devices
- Figure 6.5 Type of Technology Used for Connected / Smart Drug Delivery Device
- Figure 6.6 Advantages of Connected / Smart Drug Delivery Devices
- Figure 7.1 Connected / Smart Drug Delivery Devices: Distribution by Stage of Development
- Figure 7.2 Connected / Smart Drug Delivery Devices: Distribution by Launch Year
- Figure 7.3 Connected / Smart Drug Delivery Devices: Distribution by Type of Integrated Device
- Figure 7.4 Connected / Smart Drug Delivery Devices: Distribution by Route of Administration
- Figure 7.5 Connected / Smart Drug Delivery Devices: Distribution by Target Indication
- Figure 7.6 Connected / Smart Drug Delivery Devices: Distribution by Therapeutic Area
- Figure 7.7 Connected / Smart Drug Delivery Devices: Distribution by Key Features
- Figure 7.8 Connected / Smart Drug Delivery Devices: Distribution by Mode of Connectivity
- Figure 7.9 Connected / Smart Drug Delivery Devices: Distribution by Availability of Companion Mobile Application
- Figure 7.10 Connected / Smart Drug Delivery Devices: Distribution by Availability of Data Storage / Cloud Platform
- Figure 7.11 Connected / Smart Drug Delivery Device Manufacturers: Distribution by Year of Establishment
- Figure 7.12 Connected / Smart Drug Delivery Device Manufacturers: Distribution by Company Size
- Figure 7.13 Connected / Smart Drug Delivery Device Manufacturers: Distribution by Location of Headquarters
- Figure 7.14 Connected / Smart Drug Delivery Device Manufacturers: Distribution by Year of Establishment and Location of Headquarters
- Figure 7.15 Connected / Smart Drug Delivery Device Manufacturers: Distribution by Company Size and Location of Headquarters
- Figure 7.16 Most Active Players: Distribution by Number of Connected / Smart Drug Delivery Devices Manufactured
- Figure 8.1 Add-on Sensors: Distribution by Stage of Development
- Figure 8.2 Add-on Sensors: Distribution by Launch Year
- Figure 8.3 Add-on Sensors: Distribution by Compatible Device
- Figure 8.4 Add-on Sensors: Distribution by Route of Administration
- Figure 8.5 Add-on Sensors: Distribution by Target Indication
- Figure 8.6 Add-on Sensors: Distribution by Therapeutic Area
- Figure 8.7 Add-on Sensors: Distribution by Key Features
- Figure 8.8 Add-on Sensors: Distribution by Mode of Connectivity
- Figure 8.9 Add-on Sensors: Distribution by Availability of Companion Mobile Application
- Figure 8.10 Add-on Sensors: Distribution by Availability of Data Storage / Cloud Platform
- Figure 8.11 Add-on Sensor Manufacturers: Distribution by Year of Establishment
- Figure 8.12 Add-on Sensor Manufacturers: Distribution by Company Size
- Figure 8.13 Add-on Sensor Manufacturers: Distribution by Location of Headquarters
- Figure 8.14 Add-on Sensor Manufacturers: Distribution by Year of Establishment and Location of Headquarters
- Figure 8.15 Add-on Sensor Manufacturers: Distribution by Company Size and Location of Headquarters
- Figure 8.16 Most Active Players: Distribution by Number of Add-on Sensors Manufactured
- Figure 9.1 Product Competitiveness Analysis: Smart Handheld Injectors (Peer Group 1a)
- Figure 9.2 Product Competitiveness Analysis: Smart Wearable Injectors (Peer Group 1b)
- Figure 9.3 Product Competitiveness Analysis: Other Integrated Devices (Peer Group 1c)
- Figure 9.4 Product Competitiveness Analysis: Add-on Sensors (Peer Group 2)
- Figure 10.1 Medtronic: Business Segment-wise Revenues and Consolidated Financial Details (USD Billion)
- Figure 10.2 Insulet: Business Segment-wise Revenues and Consolidated Financial Details (USD Millon)
- Figure 10.3 Tandem Diabetes Care: Consolidated Financial Details (USD Million)
- Figure 11.1 Gerresheimer: Business Segment-wise Revenues and Consolidated Financial Details (EUR Million)
- Figure 11.2 Roche: Business Segment-wise Revenues and Consolidated Financial Details (CHF Billion)
- Figure 11.3 Ypsomed: Business Segment-wise Revenues and Consolidated Financial Details (CHF Million)
- Figure 13.1 Clinical Trial Analysis: Cumulative Year-wise Trend, since 2021
- Figure 13.2 Clinical Trial Analysis: Year-wise Trend of Enrolled Patient Population by Trial Registration Year, since 2021
- Figure 13.3 Clinical Trial Analysis: Distribution by Trial Status
- Figure 13.4 Clinical Trial Analysis: Distribution by Trial Registration Year and Trial Status
- Figure 13.5 Clinical Trial Analysis: Distribution of Number of Enrolled Patient Population by Trial Status
- Figure 13.6 Clinical Trial Analysis: Distribution by Target Patient Population
- Figure 13.7 Clinical Trial Analysis: Distribution by Type of Sponsor / Collaborator
- Figure 13.8 Clinical Trial Analysis: Distribution by Study Design
- Figure 13.9 Clinical Trial Analysis: Distribution by Type of Allocation
- Figure 13.10 Clinical Trial Analysis: Distribution by Type of Intervention Model
- Figure 13.11 Clinical Trial Analysis: Distribution by Type of Masking
- Figure 13.12 Clinical Trial Analysis: Distribution by Trial Purpose
- Figure 13.13 Leading Players: Distribution by Number of Registered Trials
- Figure 13.14 Leading Connected / Smart Drug Delivery Devices and Add-On Sensors: Distribution by Number of Registered Trials
- Figure 13.15 Clinical Trial Analysis: Distribution of Clinical Trials by Geography
- Figure 13.16 Clinical Trial Analysis: Distribution of Number of Registered Trials by Trial Status and Geography
- Figure 13.17 Clinical Trial Analysis: Distribution of Number of Enrolled Patients Population by Geography
- Figure 14.1 Partnerships and Collaborations: Cumulative Year-wise Trend, since 2021
- Figure 14.2 Partnerships and Collaborations: Distribution by Type of Partnership
- Figure 14.3 Partnerships and Collaborations: Distribution by Year and Type of Partnership, since 2021
- Figure 14.4 Partnerships and Collaborations: Distribution by Class of Device
- Figure 14.5 Partnerships and Collaborations: Distribution by Type of Integrated Device
- Figure 14.6 Partnerships and Collaborations: Distribution by Compatible Device
- Figure 14.7 Most Active Players: Distribution by Number of Partnerships
- Figure 14.8 Partnerships and Collaborations: Intracontinental and Intercontinental Deals
- Figure 14.9 Partnerships and Collaborations: Local and International Deals
- Figure 15.1 Funding and Investments: Cumulative Year-wise Trend, since 2021
- Figure 15.2 Funding and Investments: Distribution by Amount Invested, since 2021 (USD Million)
- Figure 15.3 Funding and Investments: Distribution of Funding Instances by Type of Funding
- Figure 15.4 Funding and Investments: Distribution of Amount Invested by Type of Funding (USD Million)
- Figure 15.5 Funding and Investments: Distribution of Funding Instances by Year and Type of Funding, since 2021
- Figure 15.6 Funding and Investments: Distribution of Funding Instances by Geography
- Figure 15.7 Most Active Players: Distribution by Number of Funding Instances
- Figure 15.8 Most Active Players: Distribution by Amount Raised (USD Million)
- Figure 15.9 Summary of Funding and Investments, since 2021 (USD Million)
- Figure 16.1 Connected / Smart Drug Delivery Devices: Value Chain
- Figure 16.2 Cost Distribution Across Value Chain
- Figure 16.3 Costs Associated with Concept Development and Proof of Concept
- Figure 16.4 Costs Associated with Research and Product Development
- Figure 16.5 Costs Associated with Clinical Trials
- Figure 16.6 Costs Associated with Regulatory Approvals
- Figure 16.7 Costs Associated with Manufacturing and Product Assembly
- Figure 16.8 Costs Associated with Application Development
- Figure 16.9 Costs Associated with Marketing and Sales
- Figure 17.1 Global Regulations related to Smart Inhalers, Smart Injectors and Smart Wearable Injectors
- Figure 17.2 USFDA: Approval Pathway for Combination Products
- Figure 17.3 Health Canada: Approval Pathway for Combination Products
- Figure 17.4 NMPA: Approval Pathway for Combination Products
- Figure 17.5 Connected / Smart Drug Delivery Devices: Major Steps for Managing Privacy
- Figure 18.1 Diabetes: Evolution of Drug Delivery / Connected Devices
- Figure 18.2 Impact of Drug Delivery / Connected Devices in Improving Drug Adherence in Diabetic Patients: Highlights on Twitter
- Figure 18.3 Asthma: Evolution of Drug Delivery / Connected Devices
- Figure 18.4 Impact of Drug Delivery / Connected Devices in Improving Drug Adherence in Asthmatic Patients: Highlights on Twitter
- Figure 19.1 Connected Drug Delivery Devices Market: SWOT Analysis
- Figure 19.2 Comparison of SWOT Factors: Harvey Ball Analysis
- Figure 20.1 Blue Ocean Strategy: Strategy Canvas
- Figure 20.2 Blue Ocean Strategy: Pioneer-Migrator (PMS) Map
- Figure 21.1 Global Connected Drug Delivery Devices Market: Historical Trends (since 2020) and Forecasted Estimates (till 2035) (Million Units Sold, USD Million)
- Figure 21.2 Global Connected Drug Delivery Devices Market, till 2035: Conservative Scenario (Million Units Sold, USD Million)
- Figure 21.3 Global Connected Drug Delivery Devices Market, till 2035: Optimistic Scenario (Million Units Sold, USD Million)
- Figure 22.1 Connected Drug Delivery Devices Market: Distribution by Type of Device (USD Million)
- Figure 22.2 Connected Drug Delivery Devices Market for Connected / Smart Wearable Injectors: Historical Trends (since 2020) and Forecasted Estimates (till 2035) (Million Units Sold, USD Million)
- Figure 22.3 Connected Drug Delivery Devices Market for Connected / Smart Inhalers: Historical Trends (since 2020) and Forecasted Estimates (till 2035) (Million Units Sold, USD Million)
- Figure 22.4 Connected Drug Delivery Devices Market for Connected / Smart Pen Injectors: Historical Trends (since 2020) and Forecasted Estimates (till 2035) (Million Units Sold, USD Million)
- Figure 22.5 Connected Drug Delivery Devices Market for Connected / Smart Autoinjectors: Historical Trends (since 2020) and Forecasted Estimates (till 2035) (USD Million, Million Units Sold)
- Figure 22.6 Connected Drug Delivery Devices Market for Connected / Smart Needle-free Injection Systems: Historical Trends (since 2020) and Forecasted Estimates (till 2035) (USD Million, Million Units Sold)
- Figure 23.1 Connected Drug Delivery Devices Market: Distribution by Mode of Connectivity (USD Million)
- Figure 23.2 Connected Drug Delivery Devices Market for Bluetooth-enabled Devices: Historical Trends (since 2020) and Forecasted Estimates (till 2035) (Million Units Sold, USD Million)
- Figure 23.3 Connected Drug Delivery Devices Market for Near-field Communication-enabled Devices: Historical Trends (since 2020) and Forecasted Estimates (till 2035) (Million Units Sold, USD Million)
- Figure 23.4 Connected Drug Delivery Devices Market for Cellular-enabled Devices: Historical Trends (since 2020) and Forecasted Estimates (till 2035) (Million Units Sold, USD Million)
- Figure 23.5 Connected Drug Delivery Devices Market for Wide Area Network-enabled Devices: Historical Trends (since 2020) and Forecasted Estimates (till 2035) (Million Units Sold, USD Million)
- Figure 24.1 Connected Drug Delivery Devices Market: Distribution by Route of Administration (USD Million)
- Figure 24.2 Connected Drug Delivery Devices Market for Parenteral Administration: Historical Trends (since 2020) and Forecasted Estimates (till 2035) (Million Units Sold, USD Million)
- Figure 24.3 Connected Drug Delivery Devices Market for Inhalational Administration: Historical Trends (since 2020) and Forecasted Estimates (till 2035) (Million Units Sold, USD Million)
- Figure 25.1 Connected Drug Delivery Devices Market: Distribution by Therapeutic Area (USD Million)
- Figure 25.2 Connected Drug Delivery Devices Market for Metabolic Disorders: Historical Trends (since 2020) and Forecasted Estimates (till 2035) (Million Units Sold, USD Million)
- Figure 25.3 Connected Drug Delivery Devices Market for Respiratory Disorders: Historical Trends (since 2020) and Forecasted Estimates (till 2035) (Million Units Sold, USD Million)
- Figure 25.4 Connected Drug Delivery Devices Market for Autoimmune Disorders: Historical Trends (since 2020) and Forecasted Estimates (till 2035) (Million Units Sold, USD Million)
- Figure 25.5 Connected Drug Delivery Devices Market for Other Disorders: Historical Trends (since 2020) and Forecasted Estimates (till 2035) (Million Units Sold, USD Million)
- Figure 26.1 Connected Drug Delivery Devices Market: Distribution by Geographical Regions (USD Million)
- Figure 26.2 Connected Drug Delivery Devices Market in North America: Historical Trends (since 2020) and Forecasted Estimates (till 2035) (Million Units Sold, USD Million)
- Figure 26.3 Connected Drug Delivery Devices Market in the US: Historical Trends (since 2020) and Forecasted Estimates (till 2035) (USD Million)
- Figure 26.4 Connected Drug Delivery Devices Market in Canada: Historical Trends (since 2020) and Forecasted Estimates (till 2035) (USD Million)
- Figure 26.5 Connected Drug Delivery Devices Market in Europe: Historical Trends (since 2020) and Forecasted Estimates (till 2035) (Million Units Sold, USD Million)
- Figure 26.6 Connected Drug Delivery Devices Market in the UK: Historical Trends (since 2020) and Forecasted Estimates (till 2035) (USD Million)
- Figure 26.7 Connected Drug Delivery Devices Market in Germany: Historical Trends (since 2020) and Forecasted Estimates (till 2035) (USD Million)
- Figure 26.8 Connected Drug Delivery Devices Market in France: Historical Trends (since 2020) and Forecasted Estimates (till 2035) (USD Million)
- Figure 26.9 Connected Drug Delivery Devices Market in Italy: Historical Trends (since 2020) and Forecasted Estimates (till 2035) (USD Million)
- Figure 26.10 Connected Drug Delivery Devices Market in Spain: Historical Trends (since 2020) and Forecasted Estimates (till 2035) (USD Million)
- Figure 26.11 Connected Drug Delivery Devices Market in Rest of Europe: Historical Trends (since 2020) and Forecasted Estimates (till 2035) (USD Million)
- Figure 26.12 Connected Drug Delivery Devices Market in Asia-Pacific: Historical Trends (since 2020) and Forecasted Estimates (till 2035) (Million Units Sold, USD Million)
- Figure 26.13 Connected Drug Delivery Devices Market in China: Historical Trends (since 2020) and Forecasted Estimates (till 2035) (USD Million)
- Figure 26.14 Connected Drug Delivery Devices Market in India: Historical Trends (since 2020) and Forecasted Estimates (till 2035) (USD Million)
- Figure 26.15 Connected Drug Delivery Devices Market in Japan: Historical Trends (since 2020) and Forecasted Estimates (till 2035) (USD Million)
- Figure 26.16 Connected Drug Delivery Devices Market in Rest of Asia-Pacific: Historical Trends (since 2020) and Forecasted Estimates (till 2035) (USD Million)
- Figure 26.17 Connected Drug Delivery Devices Market in Middle East and North Africa: Historical Trends (since 2020) and Forecasted Estimates (till 2035) (Million Units Sold, USD Million)
- Figure 26.18 Connected Drug Delivery Devices Market in Egypt: Historical Trends (since 2020) and Forecasted Estimates (till 2035) (USD Million)
- Figure 26.19 Connected Drug Delivery Devices Market in Israel: Historical Trends (since 2020) and Forecasted Estimates (till 2035) (USD Million)
- Figure 26.20 Connected Drug Delivery Devices Market in Saudi Arabia: Historical Trends (since 2020) and Forecasted Estimates (till 2035) (USD Million)
- Figure 26.21 Connected Drug Delivery Devices Market in Rest of Middle East and North Africa: Historical Trends (since 2020) and Forecasted Estimates (till 2035) (USD Million)
- Figure 26.22 Connected Drug Delivery Devices Market in Latin America and Rest of the World: Historical Trends (since 2020) and Forecasted Estimates (till 2035) (Million Units Sold, USD Million)
- Figure 26.23 Connected Drug Delivery Devices Market in Brazil: Historical Trends (since 2020) and Forecasted Estimates (till 2035) (USD Million)
- Figure 26.24 Connected Drug Delivery Devices Market in Argentina: Historical Trends (since 2020) and Forecasted Estimates (till 2035) (USD Million)
- Figure 26.25 Connected Drug Delivery Devices Market in Other Countries: Historical Trends (since 2020) and Forecasted Estimates (till 2035) (USD Million)
- Figure 27.1 Concluding Remarks: Connected Drug Delivery Devices Market Landscape
- Figure 27.2 Concluding Remarks: Add-on-Sensors Market Landscape
- Figure 27.3 Concluding Remarks: Partnerships and Collaborations
- Figure 27.4 Concluding Remarks: Funding and Investments
- Figure 27.5 Concluding Remarks: Market Sizing and Opportunity Analysis

