
PUBLISHER: Roots Analysis | PRODUCT CODE: 1958587

PUBLISHER: Roots Analysis | PRODUCT CODE: 1958587
Wearable Injectors Market (8th Edition): Distribution by Type of Device, Degree of Automation, Usability, Therapeutic Area, and Geographical Regions - Trends and Forecast Till 2035
Wearable Injectors Market: Overview
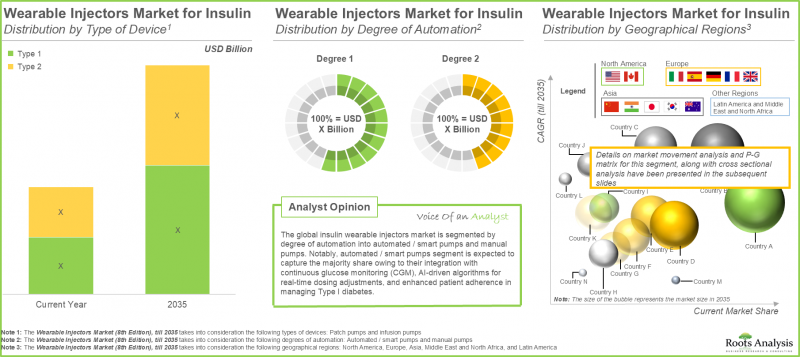
As per Roots Analysis, the global wearable injectors market is estimated to grow from USD 6.8 billion in the current year to USD 13.0 billion by 2035, at a CAGR of 7.4% during the forecast period, till 2035.
Wearable Injectors Market: Growth and Trends
The rise in autoimmune diseases, heart conditions, and cancer continues to put pressure on healthcare systems as the population grows and ages. In response, pharmaceutical companies are developing patient-focused solutions to enhance treatment adherence and outcomes through advanced drug delivery technologies. Wearable injectors, such as on-body patch pumps, provide sustained basal, bolus, or continuous doses of large-volume biologics, making administration easier and improving adherence. Their integrated safety features minimize needlestick injuries, while ensuring comfort and confidence when used at home. Illustrating this trend, BD recently announced the launch of the first clinical trial sponsored by a pharmaceutical company for a combination product using the BD Libertas wearable injector for the subcutaneous delivery of complex biologics. This highlights the increasing trust in these large-volume, patient-friendly systems for at-home care.
Due to this development, wearable devices have emerged as the favored option for administering drugs subcutaneously in home-care environments. In addition, the rise in popularity of on-body injectors has led pharmaceutical companies and medical device manufacturers to incorporate advanced features into their product lines. These features include artificial intelligence algorithms, mobile applications with intelligent health monitoring, reminders, and visual or audible notifications confirming drug delivery. With constant advancements occurring in this sector, it is anticipated that the usage of such on-body injectors will rise substantially, fueling market expansion in the foreseeable future.
Growth Drivers: Strategic Enablers of Market Expansion
The market drivers in the wearable injector's domain include rising prevalence of chronic diseases like diabetes, oncology, and autoimmune disorders, which fuels the demand for convenient subcutaneous delivery of biologics and high-volume therapies. In addition, the market is fueled by the growing preference for home healthcare enables self-administration, reducing clinic visits and enhancing patient autonomy and adherence. Technological advancements, including miniaturization, wireless connectivity for real-time monitoring, and integration with digital health platforms, further accelerate the market adoption.
Market Challenges: Critical Barriers Impeding Progress
Key challenges hindering the adoption of wearable injectors include rising development and production costs especially in emerging markets with weak reimbursement infrastructure. Further, stringent regulatory requirements delay approvals of these devices and raise compliance burdens for manufacturers. Patient-related barriers, such as lack of training on device use and concerns over safety or comfort, hinder widespread adoption alongside competition from established delivery methods.
Wearable Injectors Market: Key Insights
The report delves into the current state of the wearable injectors market and identifies potential growth opportunities within industry. Some key findings from the report include:
- The current market landscape features more than 50 wearable injectors for insulin drugs; a relatively higher proportion (~40%) of the companies developing such injectors are mid-sized players.
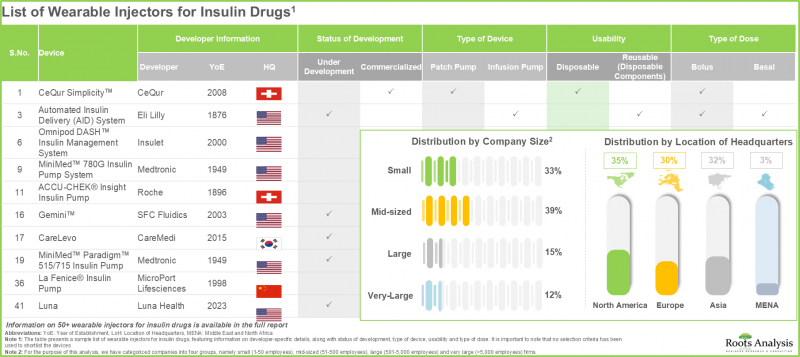
- About 65% of wearable injectors for insulin drugs are commercialized; of these, majority of devices are targeting Type I diabetes to enable intensive basal-bolus insulin regimens for patients requiring frequent dosing.
- The current market landscape features the presence of several companies developing wearable injectors for the delivery of non-insulin drugs worldwide; majority (64%) of these firms are headquartered in Europe.
- Around 70% of the wearable injectors utilize cartridges for storing non-insulin drugs; further, about 85% of the devices offer Bluetooth connectivity, enabling enhanced monitoring and data integration capabilities.
- Close to 20 drug-device combinations are available for delivering non-insulin drugs globally; over 55% of these devices have been developed by relatively larger players utilizing their advanced manufacturing capabilities.
- 60% of drug-device combinations for delivering non-insulin drugs are commercialized; notably, such device combinations are more popular for neurological and oncological disorders.
- Around 70% of the patents published in the wearable injectors domain are patent applications; notably, majority (~75%) of the patents have been published in North America.
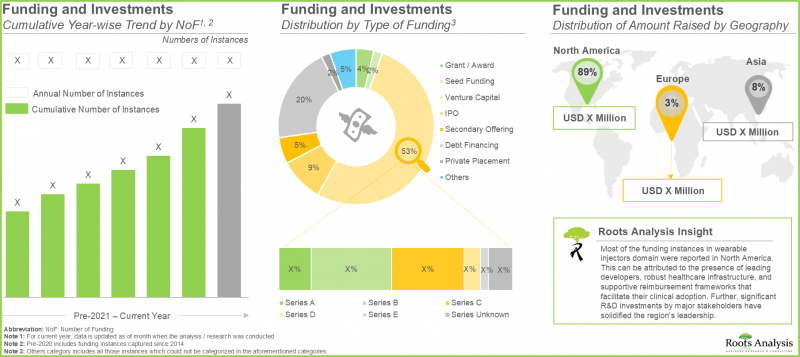
- Given various benefits of wearable injectors in enabling self-administration of drugs and reducing healthcare costs, several investors have extended financial support; over USD 16.5 billion has been invested since 2020.
- Several clinical trials have been registered till date to evaluate the safety and efficacy of various wearable injectors; majority of these studies have been conducted across various sites in the US.
- Driven by the rising prevalence of chronic diseases and the shift towards home-based, patient-centric care models, the wearable injectors market is anticipated to witness robust growth over the coming years.
- Patch pumps are expected to capture the largest market share due to their discreet low-profile design, superior patient comfort, and simpler self-administration.
- Currently, the majority share in the wearable injectors market for insulin is captured by North America owing to its advanced healthcare infrastructure and widespread adoption of integrated CGM-enabled pump technologies.
- The wearable injectors market in North America is expected to capture maximum share in current year, owing to the rising prevalence of chronic diseases and a favorable reimbursement landscape in this region.
- The wearable injectors market in the US is poised to grow at a higher CAGR over the forecast period, driven by the rising demand for patient-centric large-volume injectors.
- Given the robust drug development pipeline and rising focus on home-based care, the wearable injectors market is poised for substantial growth in the coming years.
Wearable Injectors Market
The market sizing and opportunity analysis has been segmented across the following parameters:
Market by Type of Device
- Patch Pumps
- Infusion Pumps
Market by Degree of Automation
- Automated / Smart Pump
- Manual Pumps
Market by Usability
- Disposable
- Reusable (Disposable Components)
Market by Therapeutic Area
- Oncological Disorders
- Cardiovascular Disorders
- Autoimmune Disorders
- Neurological Disorders
- Other Disorders
Market by Geographical Regions
- North America
- US
- Canada
- Mexico
- Europe
- France
- Germany
- UK
- Italy
- Spain
- Rest of Europe
- Asia
- China
- India
- Japan
- Pakistan
- Rest of Asia
- Middle East and North Africa
- Egypt
- Israel
- Saudi Arabia
- Latin America
- Argentina
- Brazil
Wearable Injectors Market: Key Segments
Infusion Pumps Segment Account for the Largest Market Share
The overall market for wearable insulin injectors is divided into various device types, including patch pumps and infusion pumps. According to our projections, the infusion pumps category represents around 95% of the existing market share for wearable injectors. This is due to its advantages, including their unparalleled accuracy and adaptability in administering drugs. Further, the patch pumps segment is expected to experience a higher CAGR in the future, due to the fact that they provide enhanced convenience for home use and self-administration. Their discreet design is ideal for ongoing treatments (such as diabetes and cancer), facilitating swift adoption as disease rates increase.
North America: Dominating the Market by Securing Highest Share
North America accounts for largest wearable injectors market size (with nearly 70% of the market share). Several factors, such as advanced healthcare system, high prevalence of chronic diseases and increased investment in healthcare spending are some of the prominent factors driving the market growth in this region.
Oncological Disorders Segment Dominates the Non-Insulin Wearable Injectors Market
The overall market is divided into sub-segments according to therapeutic areas, which include cancer-related disorders, heart disorders, neurological issues, autoimmune conditions, and various other disorders. Based on our analysis of the non-insulin wearable injector market, the oncological disorders segment leads the market, owing to the significant incidence of cancer and the accuracy of these devices for administering complex biologics and chemotherapy. The segment for neurological disorders is expected to grow at a greater CAGR throughout the forecast period.
Primary Research Overview
Discussions with multiple stakeholders in this domain influenced the opinions and insights presented in this study. The market report includes transcripts of the following other third-party discussions:
- Chief Executive Officer, Small Company, US
- Chief Executive Officer, Mid Sized Company, US
- Chief Executive Officer, Small Company, Denmark
- Former President and Chief Executive Officer, Mid Sized Company, US
- Vice President and Chief Scientist, Large Company, Israel
- Former Vice President and General Manager, Biologics, Very Large Company, US
- Anonymous, Large Company, Switzerland
- Engineering Project Manager / Senior System Engineer, Small Company, Switzerland
- Vice President, Marketing and Alliance Management, Mid Sized Company, US
Example Players in Wearable Injectors Market
- Becton Dickinson (BD)
- Enable Injections
- Insulet
- Medtronic
- Tandem Diabetes Care
- West Pharmaceutical Services
- Ypsomed
Wearable Injectors Market: Research Coverage
- Market Sizing and Opportunity Analysis: The report features an in-depth analysis of the wearable injectors market, focusing on key market segments, including [A] type of device [B] degree of automation, [C] usability, [D] therapeutic area, and [E] geographical regions.
- Wearable Injectors for Non-Insulin Drugs Market Landscape: A detailed overview of the overall market landscape of wearable injectors for non-insulin drugs market landscape, along with information on several relevant parameters, such as [A] type of device, [B] status of development, [C] type of drug delivery, [D] usability, [E] drug reservoir volume, type of drug molecule, [F] type of dose, [G] dose of drug, [H] mode of injection, [I] therapeutic area, [J] type of drug container, [K] mode of drug filling, [H] most active players, [I] year of establishment, [J] company size, [K] location of headquarters and [L] leading players.
- Drug Device Combinations for Non-Insulin Drugs Market Landscape: A detailed overview of the overall market landscape of wearable injectors for drug device combinations for non-insulin drugs market landscape, along with information on several relevant parameters, such as [A] type of device, [B] status of development, [C] type of drug delivery, [D] usability, [E] drug reservoir volume, type of drug molecule, [F] type of dose, [G] dose of drug, [H] mode of injection, [I] therapeutic area, [J] type of drug container, [K] mode of drug filling, [H] most active players, [I] year of establishment, [J] company size, [K] location of headquarters and [L] leading players.
- Wearable Injectors for Insulin Market Landscape: A detailed overview of the overall market landscape of wearable injectors for insulin drugs market landscape, along with information on several relevant parameters, such as [A] type of device, [B] status of development, [C] type of drug delivery, [D] usability, [E] drug reservoir volume, type of drug molecule, [F] type of dose, [G] dose of drug, [H] mode of injection, [I] therapeutic area, [J] type of drug container, [K] mode of drug filling, [H] most active players, [I] year of establishment, [J] company size, [K] location of headquarters and [L] leading players.
- Company Profiles: In-depth profiles of leading players manufacturing wearable injectors in North America, Europe and Asia-Pacific based on [A] year of establishment, [B] location of headquarters, [C] product portfolio, [D] recent developments and [E] an informed future outlook.
- Patent Analysis: An in-depth analysis of patents that have been filed / granted related to wearable injectors over the last decade across several relevant parameters, such as [A] type of patent, [B] patent publication year, [C] jurisdiction, [D] CPC symbol, [E] type of organization, [F] emerging focus area, [G] most active players, [H] patent benchmarking analysis and [I] insightful patent valuation analysis.
- Likely Drug Candidates: An overview of marketed drugs / therapies and pipeline candidates that are likely to be developed in combination with wearable injectors in the near future, identified on the basis of an in-depth analysis of potential candidates (marketed drugs and clinical-stage drugs), taking into consideration multiple parameters, such as [A] type of drug molecule, [B] phase of development, [C] indication, [D] dosing frequency, [E] type of therapy, [F] method of administration and [G] route of administration.
- Clinical Trial Analysis: A detailed analysis of completed, ongoing and planned clinical trials related to wearable injectors based on several relevant parameters, such as [A] trial recruitment status, [B] trial registration year, [C] trial phase, [D] study design, [E] type of sponsor / collaborator, [F] leading players (based on the number of registered trials), [G] key focus area, [H] therapeutic area, and [I] geography.
- Funding and Investment Analysis: An analysis of funding and investment signed in the domain based on several relevant parameters, such as [A] year of funding, [B] type of funding, [C] amount invested, [D] geography, [E] and most active players.
- SWOT Analysis: An in-depth value chain analysis featuring a discussion on various steps involved in the development of connected / smart drug delivery devices, including research and development (R&D), product manufacturing and assembly, product distribution, marketing and sales, and post-market surveillance, along with the information on cost requirements across each of the aforementioned stages.
- Regulatory and Reimbursement Landscape: A discussion on the various guidelines established by regulatory bodies for medical device approvals across North America (US, Canada and Mexico), Europe (UK, France, Germany, Italy, Spain and rest of Europe), Asia-Pacific and rest of the world (Australia, Brazil, China, India, Israel, Japan, New Zealand, Singapore, South Africa, South Korea, Taiwan, and Thailand).
- Market Impact Analysis: An in-depth analysis of the factors that can impact the growth of wearable injectors market. It also features identification and analysis of key drivers, potential restraints, emerging opportunities, and existing challenges.
Key Questions Answered in this Report
- Which are the leading companies in wearable injectors market?
- Which region dominates the wearable injectors market?
- What are the key trends observed in the wearable injectors market?
- What factors are likely to influence the evolution of this market?
- What are the primary challenges faced by wearable injectors developers?
- What is the current and future market size?
- What is the CAGR of this market?
- How is the current and future market opportunity likely to be distributed across key market segments?
Reasons to Buy this Report
- The report provides a comprehensive market analysis, offering detailed revenue projections of the overall market and its specific sub-segments. This information is valuable to both established market leaders and emerging entrants.
- The report offers stakeholders a comprehensive overview of the market, including key drivers, barriers, opportunities, and challenges. This information empowers stakeholders to stay abreast of market trends and make data-driven decisions to capitalize on growth prospects.
- The report can aid businesses in identifying future opportunities in any sector. It also helps in understanding if those opportunities are worth pursuing.
- The report helps in identifying customer demand by understanding the needs, preferences, and behavior of the target audience in order to tailor products or services effectively.
- The report equips new entrants with requisite information regarding a particular market to help them build successful business strategies.
- The report allows for more effective communication with the audience and in building strong business relations.
Additional Benefits
- Complementary PPT Insights Pack
- Complimentary Excel Data Packs for all Analytical Modules in the Report
- 15% Free Content Customization
- Detailed Report Walkthrough Session with Research Team
- Free Updated report if the report is 6-12 months old or older
TABLE OF CONTENTS
1. PREFACE
- 1.1. Introduction
- 1.2. Market Share Insights
- 1.3. Key Market Insights
- 1.4. Report Coverage
- 1.5. Key Questions Answered
- 1.6. Chapter Outlines
2. RESEARCH METHODOLOGY
- 2.1. Chapter Overview
- 2.2. Research Assumptions
- 2.2.1. Market Landscape and Market Trends
- 2.2.2. Market Forecast and Opportunity Analysis
- 2.2.3. Comparative Analysis
- 2.3. Database Building
- 2.3.1. Data Collection
- 2.3.2. Data Validation
- 2.3.3. Data Analysis
- 2.4. Project Methodology
- 2.4.1. Secondary Research
- 2.4.1.1. Annual Reports
- 2.4.1.2. Academic Research Papers
- 2.4.1.3. Company Websites
- 2.4.1.4. Investor Presentations
- 2.4.1.5. Regulatory Filings
- 2.4.1.6. White Papers
- 2.4.1.7. Industry Publications
- 2.4.1.8. Conferences and Seminars
- 2.4.1.9. Government Portals
- 2.4.1.10. Media and Press Releases
- 2.4.1.11. Newsletters
- 2.4.1.12. Industry Databases
- 2.4.1.13. Roots Proprietary Databases
- 2.4.1.14. Paid Databases and Sources
- 2.4.1.15. Social Media Portals
- 2.4.1.16. Other Secondary Sources
- 2.4.2. Primary Research
- 2.4.2.1. Types of Primary Research
- 2.4.2.1.1. Qualitative Research
- 2.4.2.1.2. Quantitative Research
- 2.4.2.1.3. Hybrid Approach
- 2.4.2.2. Advantages of Primary Research
- 2.4.2.3. Techniques for Primary Research
- 2.4.2.3.1. Interviews
- 2.4.2.3.2. Surveys
- 2.4.2.3.3. Focus Groups
- 2.4.2.3.4. Observational Research
- 2.4.2.3.5. Social Media Interactions
- 2.4.2.4. Key Opinion Leaders Considered in Primary Research
- 2.4.2.4.1. Company Executives (CXOs)
- 2.4.2.4.2. Board of Directors
- 2.4.2.4.3. Company Presidents and Vice Presidents
- 2.4.2.4.4. Research and Development Heads
- 2.4.2.4.5. Technical Experts
- 2.4.2.4.6. Subject Matter Experts
- 2.4.2.4.7. Scientists
- 2.4.2.4.8. Doctors and Other Healthcare Providers
- 2.4.2.5. Ethics and Integrity
- 2.4.2.5.1. Research Ethics
- 2.4.2.5.2. Data Integrity
- 2.4.2.1. Types of Primary Research
- 2.4.3. Analytical Tools and Databases
- 2.4.1. Secondary Research
- 2.5. Robust Quality Control
3. MARKET DYNAMICS
- 3.1. Chapter Overview
- 3.2. Forecast Methodology
- 3.2.1. Top-down Approach
- 3.2.2. Bottom-up Approach
- 3.2.3. Hybrid Approach
- 3.3. Market Assessment Framework
- 3.3.1. Total Addressable Market (TAM)
- 3.3.2. Serviceable Addressable Market (SAM)
- 3.3.3. Serviceable Obtainable Market (SOM)
- 3.3.4. Currently Acquired Market (CAM)
- 3.4. Forecasting Tools and Techniques
- 3.4.1. Qualitative Forecasting
- 3.4.2. Correlation
- 3.4.3. Regression
- 3.4.4. Extrapolation
- 3.4.5. Convergence
- 3.4.6. Sensitivity Analysis
- 3.4.7. Scenario Planning
- 3.4.8. Data Visualization
- 3.4.9. Time Series Analysis
- 3.4.10. Forecast Error Analysis
- 3.5. Key Considerations
- 3.5.1. Demographics
- 3.5.2. Government Regulations
- 3.5.3. Reimbursement Scenarios
- 3.5.4. Market Access
- 3.5.5. Supply Chain
- 3.5.6. Industry Consolidation
- 3.5.7. Pandemic / Unforeseen Disruptions Impact
- 3.6. Limitations
4. MACRO-ECONOMIC INDICATORS
- 4.1. Chapter Overview
- 4.2. Market Dynamics
- 4.2.1. Time Period
- 4.2.1.1. Historical Trends
- 4.2.1.2. Current and Forecasted Estimates
- 4.2.2. Currency Coverage
- 4.2.2.1. Major Currencies Affecting the Market
- 4.2.2.2. Factors Affecting Currency Fluctuations
- 4.2.2.3. Impact of Currency Fluctuations on the Industry
- 4.2.3. Foreign Currency Exchange Rate
- 4.2.3.1. Impact of Foreign Exchange Rate Volatility on the Market
- 4.2.3.2. Strategies for Mitigating Foreign Exchange Risk
- 4.2.4. Recession
- 4.2.4.1. Assessment of Current Economic Conditions and Potential Impact on the Market
- 4.2.4.2. Historical Analysis of Past Recessions and Lessons Learnt
- 4.2.5. Inflation
- 4.2.5.1. Measurement and Analysis of Inflationary Pressures in the Economy
- 4.2.5.2. Potential Impact of Inflation on the Market Evolution
- 4.2.6. Interest Rates
- 4.2.6.1. Interest Rates and Their Impact on the Market
- 4.2.6.2. Strategies for Managing Interest Rate Risk
- 4.2.7. Commodity Flow Analysis
- 4.2.7.1. Type of Commodity
- 4.2.7.2. Origins and Destinations
- 4.2.7.3. Values and Weights
- 4.2.7.4. Modes of Transportation
- 4.2.8. Global Trade Dynamics
- 4.2.8.1. Import Scenario
- 4.2.8.2. Export Scenario
- 4.2.8.3. Trade Policies
- 4.2.8.4. Strategies for Mitigating the Risks Associated with Trade Barriers
- 4.2.8.5. Impact of Trade Barriers on the Market
- 4.2.9. War Impact Analysis
- 4.2.9.1. Russian-Ukraine War
- 4.2.9.2. Israel-Hamas War
- 4.2.10. COVID Impact / Related Factors
- 4.2.10.1. Global Economic Impact
- 4.2.10.2. Industry-specific Impact
- 4.2.10.3. Government Response and Stimulus Measures
- 4.2.10.4. Future Outlook and Adaptation Strategies
- 4.2.11. Other Indicators
- 4.2.11.1. Fiscal Policy
- 4.2.11.2. Consumer Spending
- 4.2.11.3. Gross Domestic Product
- 4.2.11.4. Employment
- 4.2.11.5. Taxes
- 4.2.11.6. Stock Market Performance
- 4.2.11.7. Cross Border Dynamics
- 4.2.1. Time Period
- 4.3. Conclusion
5. EXECUTIVE SUMMARY
6. INTRODUCTION
- 6.1. Chapter Overview
- 6.2. Introduction to Drug Delivery Devices
- 6.3. Conventional Parenteral Drug Delivery Devices
- 6.3.1. Needlestick Injuries
- 6.3.2. Incidence and Cost Burden
- 6.3.3. Prevention of Needlestick Injuries
- 6.3.4. Government Legislations for the Prevention of Needlestick Injuries
- 6.4. Emergence of Self-Administration Devices
- 6.4.1. Key Driving Factors
- 6.4.1.1. Rising Burden of Chronic Diseases
- 6.4.1.2. Healthcare Cost Savings
- 6.4.1.3. Need for Immediate Treatment in Emergency Situations
- 6.4.1.4. Growing Injectable Drugs Market
- 6.4.1.5. Need for Improving Medication Adherence
- 6.4.1. Key Driving Factors
- 6.5. Available Self-Injection Devices
- 6.5.1. Prefilled Syringes
- 6.5.2. Pen-Injectors
- 6.5.3. Needle-Free Injectors
- 6.5.4. Autoinjectors
- 6.5.5. Wearable Injectors
- 6.6. Regulatory Considerations
- 6.6.1. Medical Devices
- 6.6.2. Drug Device Combination Products
- 6.7. Future Perspectives
7. WEARABLE INJECTORS FOR NON-INSULIN DRUGS: MARKET LANDSCAPE
- 7.1. Chapter Overview
- 7.2. Wearable Injectors for Non-Insulin Drugs: Overall Market Landscape
- 7.2.1. Analysis by Type of Device
- 7.2.2. Analysis by Status of Development
- 7.2.3. Analysis by Type of Drug Delivery
- 7.2.4. Analysis by Usability
- 7.2.5. Analysis by Drug Reservoir Volume
- 7.2.6. Analysis by Type of Drug Molecule
- 7.2.7. Analysis by Type of Dose
- 7.2.8. Analysis by Dose of Drug
- 7.2.9. Analysis by Mode of Injection
- 7.2.10. Analysis by Therapeutic Area
- 7.2.11. Analysis by Type of Drug Container
- 7.2.12. Analysis by Mode of Drug Filling
- 7.3. Wearable Injectors for Non-Insulin Drugs: Developer Landscape
- 7.3.1. Analysis by Year of Establishment
- 7.3.2. Analysis by Company Size
- 7.3.3. Analysis by Location of Headquarters
- 7.3.4. Leading Players: Analysis by Number of Wearable Injectors Developed for Non-Insulin
8. DRUG DEVICE COMBINATIONS FOR NON-INSULIN DRUGS: MARKET LANDSCAPE
- 8.1. Chapter Overview
- 8.2. Drug Device Combinations for Non-Insulin Drugs: Overall Market Landscape
- 8.2.1. Analysis by Type of Device
- 8.2.2. Analysis by Status of Development
- 8.2.3. Analysis by Type of Drug Delivery
- 8.2.4. Analysis by Usability
- 8.2.5. Analysis by Drug Reservoir Volume
- 8.2.6. Analysis by Type of Drug Molecule
- 8.2.7. Analysis by Type of Dose
- 8.2.8. Analysis by Dose of Drug
- 8.2.9. Analysis by Mode of Injection
- 8.2.10. Analysis by Therapeutic Area
- 8.2.11. Analysis by Type of Drug Container
- 8.2.12. Analysis by Mode of Drug Filling
- 8.3 Drug Device Combinations for Non-Insulin Drugs: Developer Landscape
- 8.3.1. Analysis by Year of Establishment
- 8.3.2. Analysis by Company Size
- 8.3.3. Analysis by Location of Headquarters
- 8.3.4. Device Developers: Distribution by Number of Drug Device Combination Developed
9. WEARABLE INJECTORS FOR INSULIN: MARKET LANDSCAPE
- 9.1. Chapter Overview
- 9.2. Wearable Injectors for Insulin: Overall Market Landscape
- 9.2.1. Analysis by Type of Device
- 9.2.2. Analysis by Status of Development
- 9.2.3. Analysis by Type of Insulin Delivery
- 9.2.4. Analysis by Type of Automated Insulin Delivery
- 9.2.5. Analysis by Type of Connectivity Feature
- 9.2.6. Analysis by Type of Feedback Mechanism
- 9.2.7. Analysis by Waterproofing Capability
- 9.2.8. Analysis by Usability
- 9.2.9. Analysis by Period of Use
- 9.2.10. Analysis by Type of Advanced Feature
- 9.2.11. Analysis by Type of Drug Container
- 9.2.12. Analysis by Mode of Drug Filling
- 9.2.13. Analysis by Type of Dose
- 9.2.14. Analysis by Type of Diabetes
- 9.2.15. Analysis by Availability of Connectivity Feature
- 9.3. Wearable Injectors for Insulin: Developer Landscape
- 9.3.1. Analysis by Year of Establishment
- 9.3.2. Analysis by Company Size
- 9.3.3. Analysis by Location of Headquarters
- 9.3.4. Leading Players: Analysis by Number of Wearable Injectors Developed for Insulin
10. PRODUCT COMPETITIVENESS ANALYSIS
- 10.1. Chapter Overview
- 10.2. Assumptions / Key Parameters
- 10.3. Methodology
- 10.4. Product Competitiveness Analysis
- 10.4.1. Product Competitiveness Analysis: Wearable Injectors for Non-Insulin Drugs
- 10.4.2. Product Competitiveness Analysis: Drug Device Combinations for Non-Insulin Drugs
- 10.4.3. Product Competitiveness Analysis: Wearable Injectors for Insulin
11. WEARABLE INJECTOR DEVELOPERS: COMPANY PROFILES
- 11.1. Chapter Overview
- 11.2. Key Players Developing Wearable Injectors for Non-Insulin
- 11.2.1. CCBio
- 11.2.1.1. Company Overview
- 11.2.1.2. Product Portfolio
- 11.2.1.3. Recent Developments and Future Outlook
- 11.2.2. E3D Elcam Drug Delivery Devices
- 11.2.3. Enable Injections
- 11.2.4. Gerresheimer
- 11.2.5. Sonceboz
- 11.2.6. Weibel CDS (Acquired by SHL Medical)
- 11.2.7. West Pharmaceuticals
- 11.2.1. CCBio
- 11.3. Key Players Developing Wearable Injectors for Insulin
- 11.3.1. CeQur
- 11.3.2. Debiotech
- 11.3.3. Eli Lilly
- 11.3.4. Insulet
- 11.3.5. Medtronic
- 11.3.6. Medtrum Technologies
- 11.3.7. PharmaSens
- 11.3.8. Roche
- 11.3.9. SOOIL Development
12. DRUG-DEVICE COMBINATIONS: DEVICE PROFILES
- 12.1. Chapter Overview
- 12.2. Neulasta(R) (pegfilgrastim) OnPro(TM) Kit
- 12.3. D-mine(R) Pump
- 12.4. Lasix(R) ONYU
- 12.5. The LUTREPULSE(R) System
- 12.6. ND0612L Next generation patch pump
- 12.7. Unnamed (Developed by Phillips Medisize)
- 12.8. FUROSCIX(R)
- 12.9. SMT-201 Pump
- 12.10. SMT-301 Pump
- 12.11. ULTOMRIS(R) Smartdose Injector (ravulizumab-cwvz)
- 12.12. EMPAVELI(R) Injector
- 12.13. SKYRIZI(R) On Body Injector (risankizumab)
- 12.14. VYALEV(TM) Pump (foscarbidopa and foslevodopa)
- 12.15. UDENYCA(R) on-body injector
- 12.16. ONAPGO(TM)
- 12.17. Remunity(R) Pump
- 12.18. G-Lasta(R) BodyPod
- 12.19. Sarclisa (isatuximab) On-Body Injector
13. PARTNERSHIPS AND COLLABORATIONS
- 13.1. Chapter Overview
- 13.2. Partnership Models
- 13.3. Wearable Injectors: Partnerships and Collaborations
- 13.3.1. Analysis by Year of Partnership
- 13.3.2. Analysis by Type of Partnership
- 13.3.3. Analysis by Year and Type of Partnership
- 13.3.4. Analysis by Type of Partner
- 13.3.5. Analysis by Type of Device
- 13.3.6. Most Active Players: Analysis by Number of Partnerships
- 13.3.7. Analysis by Geography
- 13.3.7.1. Local and International Agreements
- 13.3.7.2. Intercontinental and Intracontinental Agreements
14. KEY ACQUISITION TARGETS
- 14.1. Chapter Overview
- 14.2. Scope and Methodology
- 14.3. Scoring Criteria and Key Assumptions
- 14.4. Potential Acquisition Targets: Non-Insulin Drug Delivery Device Developers
- 14.5. Potential Acquisition Targets: Insulin Drug Delivery Device Developers
- 14.6. Concluding Remarks
15. PATENT ANALYSIS
- 15.1. Chapter Overview
- 15.2. Scope and Methodology
- 15.3. Wearable Injectors: Patent Analysis
- 15.3.1. Analysis by Type of Patent
- 15.3.2. Analysis by Patent Publication Year
- 15.3.3. Analysis by Patent Application Year
- 15.3.4. Analysis of Granted Patents and Patent Applications by Publication Year
- 15.3.5. Analysis by Jurisdiction
- 15.3.6. Analysis by Type of Applicant
- 15.3.7. Analysis by Patent Age
- 15.3.8. Analysis by CPC Symbol
- 15.3.9. Most Active Players: Analysis by Number of Patents
- 15.4. Wearable Injectors: Patent Benchmarking Analysis
- 15.4.1. Analysis by Patent Characteristics
- 15.5. Patent Valuation
- 15.6. Leading Patents by Number of Citations
16. WEARABLE INJECTORS: LIKELY DRUG CANDIDATES
- 16.1. Chapter Overview
- 16.2. Marketed Drugs
- 16.2.1. Most Likely Candidates for Delivery via Wearable Injectors
- 16.2.2. Likely Candidates for Delivery via Wearable Injectors
- 16.2.3. Less Likely Candidates for Delivery via Wearable Injectors
- 16.2.4. Least Likely Candidates for Delivery via Wearable Injectors
- 16.3. Clinical Stage Drugs
- 16.3.1. Most Likely Candidates for Delivery via Wearable Injectors
- 16.3.2. Likely Candidates for Delivery via Wearable Injectors
- 16.3.3. Less Likely Candidates for Delivery via Wearable Injectors
- 16.3.4. Least Likely Candidates for Delivery via Wearable Injectors
17. CLINICAL TRIAL ANALYSIS
- 17.1. Chapter Overview
- 17.2. Scope and Methodology
- 17.3. Wearable Injectors: Clinical Trial Analysis
- 17.3.1. Analysis by Trial Recruitment Status
- 17.3.2. Analysis by Trial Registration Year
- 17.3.3. Analysis of Enrolled Patient Population by Trial Registration Year
- 17.3.4. Analysis by Trial Phase
- 17.3.5. Analysis of Enrolled Patient Population by Trial Phase
- 17.3.6. Analysis by Trial Registration Year and Trial Recruitment Status
- 17.3.7. Analysis by Study Design
- 17.3.8. Analysis by Type of Sponsor / Collaborator
- 17.3.9. Analysis by Therapeutic Area
- 17.3.10. Most Active Players: Analysis by Number of Registered Trials
- 17.3.11. Most Popular Wearable Injectors: Analysis by Number of Registered Trials
- 17.3.12. Analysis by Geography
- 17.3.12.1. Analysis by Trial Recruitment Status and Geography
- 17.3.12.2. Analysis of Enrolled Patient Population by Trial Recruitment Status and Geography
18. FUNDING AND INVESTMENT ANALYSIS
- 18.1. Chapter Overview
- 18.2. Types of Funding
- 18.3. Wearable Injectors: Funding and Investment Analysis
- 18.3.1. Analysis by Year of Funding
- 18.3.2. Analysis of Amount Invested by Year
- 18.3.3. Analysis by Type of Funding
- 18.3.4. Analysis by Type of Device
- 18.3.5. Analysis of Amount Invested by Year and Type of Funding
- 18.3.6. Analysis of Amount Invested by Type of Device
- 18.3.7. Analysis by Target Disease Indication
- 18.3.8. Most Active Players: Analysis by Number of Funding Instances
- 18.3.9. Most Active Players: Analysis by Amount Invested
- 18.3.10. Leading Investors: Analysis by Number of Funding Instances
- 18.3.11. Analysis by Geography
19. SWOT ANALYSIS
- 19.1. Chapter Overview
- 19.2. SWOT Analysis
- 19.2.1. Strengths
- 19.2.2. Weaknesses
- 19.2.3. Opportunities
- 19.2.4. Threats
- 19.3. Wearable Injectors: Future Growth Opportunities
- 19.3.1. Rising Focus on Self-Administration of Drugs
- 19.3.2. Possibility of Integration with Mobile Applications
- 19.3.3. Potential Life Cycle Management Tool
- 19.3.4. Potential Usability for Multiple Therapeutic Areas
20. CASE STUDY: ROLE OF CONTRACT MANUFACTURING ORGANIZATIONS IN DEVICE DEVELOPMENT SUPPLY CHAIN
- 20.1. Chapter Overview
- 20.2. Device Development Supply Chain
- 20.3. Role of Contract Manufacturing Organizations (CMOs) in Device Development
- 20.4. List of CMOs
- 20.4.1. Geographical Distribution of CMOs
- 20.5. Medical Devices Design and Development Service Providers
21. REGULATORY AND REIMBURSEMENT LANDSCAPE FOR MEDICAL DEVICES
- 21.1. Chapter Overview
- 21.2. General Regulatory and Reimbursement Guidelines for Medical Devices
- 21.3. Regulatory and Reimbursement Landscape in North America
- 21.3.1. The US Scenario
- 21.3.1.1. Regulatory Authority
- 21.3.1.2. Review / Approval Process
- 21.3.1.3. Reimbursement Landscape
- 21.3.1.3.1. Payer Mix
- 21.3.1.3.2. Reimbursement Process
- 21.3.2. The Canadian Scenario
- 21.3.2.1. Regulatory Authority
- 21.3.2.2. Review / Approval Process
- 21.3.2.3. Reimbursement Landscape
- 21.3.2.3.1. Payer Mix
- 21.3.2.3.2. Reimbursement Process
- 21.3.3. The Mexican Scenario
- 21.3.3.1. Regulatory Authority
- 21.3.3.2. Review / Approval Process
- 21.3.3.3. Reimbursement Landscape
- 21.3.3.3.1. Payer Mix
- 21.3.1. The US Scenario
- 21.4. Regulatory and Reimbursement Landscape in Europe
- 21.4.1. Overall Scenario
- 21.4.1.1. Overall Regulatory Authority
- 21.4.1.2. Overall Review / Approval Process
- 21.4.2. The UK Scenario
- 21.4.2.1. Regulatory Authority
- 21.4.2.2. Review / Approval Process
- 21.4.2.3. Reimbursement Landscape
- 21.4.2.3.1. Payer Mix
- 21.4.2.3.2. Reimbursement Process
- 21.4.3. The French Scenario
- 21.4.3.1. Regulatory Authority
- 21.4.3.2. Review / Approval Process
- 21.4.3.3. Reimbursement Landscape
- 21.4.3.3.1. Payer Mix
- 21.4.3.3.2. Reimbursement Process
- 21.4.4. The German Scenario
- 21.4.4.1. Regulatory Authority
- 21.4.4.2. Review / Approval Process
- 21.4.4.3. Reimbursement Landscape
- 21.4.4.3.1. Payer Mix
- 21.4.4.3.2. Reimbursement Process
- 21.4.5. The Italian Scenario
- 21.4.5.1. Regulatory Authority
- 21.4.5.2. Review / Approval Process
- 21.4.5.3. Reimbursement Landscape
- 21.4.5.3.1. Payer Mix
- 21.4.5.3.2. Reimbursement Process
- 21.4.6. The Spanish Scenario
- 21.4.6.1. Regulatory Authority
- 21.4.6.2. Review / Approval Process
- 21.4.6.3. Reimbursement Landscape
- 21.4.6.3.1. Payer Mix
- 21.4.6.3.2. Reimbursement Process
- 21.4.1. Overall Scenario
- 21.5. Regulatory and Reimbursement Landscape in Asia-Pacific and Rest of the World
- 21.5.1. The Australian Scenario
- 21.5.1.1. Regulatory Authority
- 21.5.1.2. Review / Approval Process
- 21.5.1.3. Reimbursement Landscape
- 21.5.1.3.1. Payer Mix
- 21.5.1.3.2. Reimbursement Process
- 21.5.2. The Brazilian Scenario
- 21.5.2.1. Regulatory Authority
- 21.5.2.2. Review / Approval Process
- 21.5.2.3. Reimbursement Landscape
- 21.5.2.3.1. Payer Mix
- 21.5.2.3.2. Reimbursement Process
- 21.5.3. The Chinese Scenario
- 21.5.3.1. Regulatory Authority
- 21.5.3.2. Review / Approval Process
- 21.5.3.3. Reimbursement Landscape
- 21.5.3.3.1. Payer Mix
- 21.5.3.3.2. Reimbursement Process
- 21.5.1. The Australian Scenario
22. MARKET IMPACT ANALYSIS: DRIVERS, RESTRAINTS, OPPORTUNITIES AND CHALLENGES
- 22.1. Chapter Overview
- 22.2. Market Drivers
- 22.3. Market Restraints
- 22.4. Market Opportunities
- 22.5. Market Challenges
- 22.6. Conclusion
23. WEARABLE INJECTORS MARKET FOR NON-INSULIN DRUGS
- 23.1. Chapter Overview
- 23.2. Key Assumptions and Methodology
- 23.3. Global Wearable Injectors Market for Non-Insulin Drugs, Historical Trends (Since 2022) and Forecasted Estimates (Till 2035) (By Value)
- 23.3.1. Scenario Analysis
- 23.3.1.1. Conservative Scenario
- 23.3.1.2. Optimistic Scenario
- 23.3.1. Scenario Analysis
- 23.4. Global Wearable Injectors Market for Non-Insulin Drugs, Historical Trends (Since 2022) and Forecasted Estimates (Till 2035) (By Volume)
- 23.4.1. Scenario Analysis
- 23.4.1.1. Conservative Scenario
- 23.4.1.2. Optimistic Scenario
- 23.4.1. Scenario Analysis
- 23.5. Key Market Segmentations
24. WEARABLE INJECTORS MARKET FOR NON-INSULIN DRUGS, BY TYPE OF DEVICE
- 24.1. Chapter Overview
- 24.2. Key Assumptions and Methodology
- 24.3. Wearable Injectors Market for Non-Insulin Drugs: Distribution by Type of Device (By Value)
- 24.3.1. Wearable Patch Pump Market for Non-Insulin Drugs, Historical Trends (Since 2022) and Forecasted Estimates (Till 2035) (By Value)
- 24.3.2. Wearable Infusion Pump Market for Non-Insulin Drugs, Historical Trends (Since 2022) and Forecasted Estimates (Till 2035) (By Value)
- 24.4. Wearable Injectors Market for Non-Insulin Drugs: Distribution by Type of Device (By Volume)
- 24.4.1. Wearable Patch Pump Market for Non-Insulin Drugs, Historical Trends (Since 2022) and Forecasted Estimates (Till 2035) (By Volume)
- 24.4.2. Wearable Infusion Pump Market for Non-Insulin Drugs, Historical Trends (Since 2022) and Forecasted Estimates (Till 2035) (By Volume)
- 24.5. Data Triangulation and Validation
25. WEARABLE INJECTORS MARKET FOR NON-INSULIN DRUGS, BY USABILITY
- 25.1. Chapter Overview
- 25.2. Key Assumptions and Methodology
- 25.3. Wearable Injectors Market for Non-Insulin Drugs: Distribution by Usability (By Value)
- 25.3.1. Disposable Wearable Injectors Market for Non-Insulin Drugs, Historical Trends (Since 2022) and Forecasted Estimates (Till 2035) (By Value)
- 25.3.2. Reusable / Disposable Components Wearable Injectors Market for Non-Insulin Drugs, Historical Trends (Since 2022) and Forecasted Estimates (Till 2035) (By Value)
- 25.4. Wearable Injectors Market for Non-Insulin Drugs: Distribution by Usability (By Volume)
- 25.4.1. Disposable Wearable Injectors Market for Non-Insulin Drugs, Historical Trends (Since 2022) and Forecasted Estimates (Till 2035) (By Volume)
- 25.4.2. Reusable / Disposable Components Wearable Injectors Market for Non-Insulin Drugs, Historical Trends (Since 2022) and Forecasted Estimates (Till 2035) (By Volume)
- 25.5. Data Triangulation and Validation
26. WEARABLE INJECTORS MARKET FOR NON-INSULIN DRUGS, BY THERAPEUTIC AREA
- 26.1. Chapter Overview
- 26.2. Key Assumptions and Methodology
- 26.3. Wearable Injectors Market for Non-Insulin Drugs: Distribution by Therapeutic Area (By Value)
- 26.3.1. Wearable Injectors Market for Non-Insulin Drugs Targeting Oncological Disorders, Historical Trends (Since 2022) and Forecasted Estimates (Till 2035) (By Value)
- 26.3.2. Wearable Injectors Market for Non-Insulin Drugs Targeting Cardiovascular Disorders, Historical Trends (Since 2022) and Forecasted Estimates (Till 2035) (By Value)
- 26.3.3. Wearable Injectors Market for Non-Insulin Drugs Targeting Autoimmune Disorders, Historical Trends (Since 2022) and Forecasted Estimates (Till 2035) (By Value)
- 26.3.4. Wearable Injectors Market for Non-Insulin Drugs Targeting Neurological Disorders, Historical Trends (Since 2022) and Forecasted Estimates (Till 2035) (By Value)
- 26.3.5. Wearable Injectors Market for Non-Insulin Drugs Targeting Other Disorders, Historical Trends (Since 2022) and Forecasted Estimates (Till 2035) (By Value)
- 26.4. Wearable Injectors Market for Non-Insulin Drugs: Distribution by Therapeutic Area (By Volume)
- 26.4.1. Wearable Injectors Market for Non-Insulin Drugs Targeting Oncological Disorders, Historical Trends (Since 2022) and Forecasted Estimates (Till 2035) (By Volume)
- 26.4.2. Wearable Injectors Market for Non-Insulin Drugs Targeting Cardiovascular Disorders, Historical Trends (Since 2022) and Forecasted Estimates (Till 2035) (By Volume)
- 26.4.3. Wearable Injectors Market for Non-Insulin Drugs Targeting Autoimmune Disorders, Historical Trends (Since 2022) and Forecasted Estimates (Till 2035) (By Volume)
- 26.4.4. Wearable Injectors Market for Non-Insulin Drugs Targeting Neurological Disorders, Historical Trends (Since 2022) and Forecasted Estimates (Till 2035) (By Volume)
- 26.4.5. Wearable Injectors Market for Non-Insulin Drugs Targeting Other Disorders, Historical Trends (Since 2022) and Forecasted Estimates (Till 2035) (By Volume)
- 26.5. Data Triangulation and Validation
27. WEARABLE INJECTORS MARKET FOR NON-INSULIN DRUGS, BY GEOGRAPHICAL REGIONS
- 27.1. Chapter Overview
- 27.2. Key Assumptions and Methodology
- 27.3. Wearable Injectors Market for Non-Insulin Drugs: Distribution by Geographical Regions (By Value)
- 27.3.1. Wearable Injectors Market for Non-Insulin Drugs in North America, Historical Trends (Since 2022) and Forecasted Estimates (Till 2035) (By Value)
- 27.3.2. Wearable Injectors Market for Non-Insulin Drugs in Europe, Historical Trends (Since 2022) and Forecasted Estimates (Till 2035) (By Value)
- 27.3.3. Wearable Injectors Market for Non-Insulin Drugs in Asia, Historical Trends (Since 2022) and Forecasted Estimates (Till 2035) (By Value)
- 27.3.4. Wearable Injectors Market for Non-Insulin Drugs in Latin America, Historical Trends (Since 2022) and Forecasted Estimates (Till 2035) (By Value)
- 27.3.5. Wearable Injectors Market for Non-Insulin Drugs in Middle East and North Africa, Historical Trends (Since 2022) and Forecasted Estimates (Till 2035) (By Value)
- 27.4. Wearable Injectors Market for Non-Insulin Drugs: Distribution by Geographical Regions (By Volume)
- 27.4.1. Wearable Injectors Market for Non-Insulin Drugs in North America, Historical Trends (Since 2022) and Forecasted Estimates (Till 2035) (By Volume)
- 27.4.2. Wearable Injectors Market for Non-Insulin Drugs in Europe, Historical Trends (Since 2022) and Forecasted Estimates (Till 2035) (By Volume)
- 27.4.3. Wearable Injectors Market for Non-Insulin Drugs in Asia, Historical Trends (Since 2022) and Forecasted Estimates (Till 2035) (By Volume)
- 27.4.4. Wearable Injectors Market for Non-Insulin Drugs in Latin America, Historical Trends (Since 2022) and Forecasted Estimates (Till 2035) (By Volume)
- 27.4.5. Wearable Injectors Market for Non-Insulin Drugs in Middle East and North Africa, Historical Trends (Since 2022) and Forecasted Estimates (Till 2035) (By Volume)
- 27.5. Market Dynamics Assessment
- 27.5.1. Penetration Growth (P-G) Matrix
- 27.5.2. Market Movement Analysis
- 27.6. Data Triangulation and Validation
28. WEARABLE INJECTORS MARKET FOR INSULIN
- 28.1. Chapter Overview
- 28.2. Key Assumptions and Methodology
- 28.3. Global Wearable Injectors Market for Insulin, Historical Trends (Since 2022) and Forecasted Estimates (Till 2035) (By Value)
- 28.3.1. Scenario Analysis
- 28.3.1.1. Conservative Scenario
- 28.3.1.2. Optimistic Scenario
- 28.3.1. Scenario Analysis
- 28.4. Global Wearable Injectors Market for Insulin, Historical Trends (Since 2022) and Forecasted Estimates (Till 2035) (By Volume)
- 28.4.1. Scenario Analysis
- 28.4.1.1. Conservative Scenario
- 28.4.1.2. Optimistic Scenario
- 28.4.1. Scenario Analysis
- 28.5. Key Market Segmentations
29. WEARABLE INJECTORS MARKET FOR INSULIN, BY TYPE OF DEVICE
- 29.1. Chapter Overview
- 29.2. Key Assumptions and Methodology
- 29.3. Wearable Injectors Market for Insulin: Distribution by Type of Device (By Value)
- 29.3.1. Wearable Patch Pump Market for Insulin, Historical Trends (Since 2022) and Forecasted Estimates (Till 2035) (By Value)
- 29.3.2. Wearable Infusion Pump Market for Insulin, Historical Trends (Since 2022) and Forecasted Estimates (Till 2035) (By Value)
- 29.4. Wearable Injectors Market for Insulin: Distribution by Type of Device (By Volume)
- 29.4.1. Wearable Patch Pump Market for Insulin, Historical Trends (Since 2022) and Forecasted Estimates (Till 2035) (By Volume)
- 29.4.2. Wearable Infusion Pump Market for Insulin, Historical Trends (Since 2022) and Forecasted Estimates (Till 2035) (By Volume)
- 29.5. Data Triangulation and Validation
30. WEARABLE INJECTORS MARKET FOR INSULIN, BY DEGREE OF AUTOMATION
- 30.1. Chapter Overview
- 30.2. Key Assumptions and Methodology
- 30.3. Wearable Injectors Market for Insulin: Distribution by Degree of Automation (By Value)
- 30.3.1. Automated / Smart Wearable Injectors Market for Insulin, Historical Trends (Since 2022) and Forecasted Estimates (Till 2035) (By Value)
- 30.3.2. Manual Wearable Injectors Market for Insulin, Historical Trends (Since 2022) and Forecasted Estimates (Till 2035) (By Value)
- 30.4. Wearable Injectors Market for Insulin: Distribution by Degree of Automation (By Volume)
- 30.4.1. Automated / Smart Wearable Injectors Market for Insulin, Historical Trends (Since 2022) and Forecasted Estimates (Till 2035) (By Volume)
- 30.4.2. Manual Wearable Injectors Market for Insulin, Historical Trends (Since 2022) and Forecasted Estimates (Till 2035) (By Volume)
- 30.5. Data Triangulation and Validation
31. WEARABLE INJECTORS MARKET FOR INSULIN, BY GEOGRAPHICAL REGIONS
- 31.1. Chapter Overview
- 31.2. Key Assumptions and Methodology
- 31.3. Wearable Injectors Market for Insulin: Distribution by Geographical Regions (By Value)
- 31.3.1. Wearable Injectors Market for Insulin in North America, Historical Trends (Since 2022) and Forecasted Estimates (Till 2035) (By Value)
- 31.3.1.1. Wearable Injectors Market for Insulin in the US, Historical Trends (Since 2022) and Forecasted Estimates (Till 2035) (By Value)
- 31.3.1.2. Wearable Injectors Market for Insulin in Canada, Historical Trends (Since 2022) and Forecasted Estimates (Till 2035) (By Value)
- 31.3.2. Wearable Injectors Market for Insulin in Europe, Historical Trends (Since 2022) and Forecasted Estimates (Till 2035) (By Value)
- 31.3.2.1. Wearable Injectors Market for Insulin in Germany, Historical Trends (Since 2022) and Forecasted Estimates (Till 2035) (By Value)
- 31.3.2.2. Wearable Injectors Market for Insulin in the UK, Historical Trends (Since 2022) and Forecasted Estimates (Till 2035) (By Value)
- 31.3.2.3. Wearable Injectors Market for Insulin in Spain, Historical Trends (Since 2022) and Forecasted Estimates (Till 2035) (By Value)
- 31.3.2.4. Wearable Injectors Market for Insulin in France, Historical Trends (Since 2022) and Forecasted Estimates (Till 2035) (By Value)
- 31.3.2.5. Wearable Injectors Market for Insulin in Italy, Historical Trends (Since 2022) and Forecasted Estimates (Till 2035) (By Value)
- 31.3.2.6. Wearable Injectors Market for Insulin in Rest of Europe, Historical Trends (Since 2022) and Forecasted Estimates (Till 2035) (By Value)
- 31.3.3. Wearable Injectors Market for Insulin in Asia, Historical Trends (Since 2022) and Forecasted Estimates (Till 2035) (By Value)
- 31.3.3.1. Wearable Injectors Market for Insulin in China, Historical Trends (Since 2022) and Forecasted Estimates (Till 2035) (By Value)
- 31.3.3.2. Wearable Injectors Market for Insulin in India, Historical Trends (Since 2022) and Forecasted Estimates (Till 2035) (By Value)
- 31.3.3.3. Wearable Injectors Market for Insulin in Japan, Historical Trends (Since 2022) and Forecasted Estimates (Till 2035) (By Value)
- 31.3.3.4. Wearable Injectors Market for Insulin in Pakistan, Historical Trends (Since 2022) and Forecasted Estimates (Till 2035) (By Value)
- 31.3.3.5. Wearable Injectors Market for Insulin in Rest of Asia, Historical Trends (Since 2022) and Forecasted Estimates (Till 2035) (By Value)
- 31.3.4. Wearable Injectors Market for Insulin in Latin America, Historical Trends (Since 2022) and Forecasted Estimates (Till 2035) (By Value)
- 31.3.4.1. Wearable Injectors Market for Insulin in Brazil, Historical Trends (Since 2022) and Forecasted Estimates (Till 2035) (By Value)
- 31.3.4.2. Wearable Injectors Market for Insulin in Mexico, Historical Trends (Since 2022) and Forecasted Estimates (Till 2035) (By Value)
- 31.3.4.3. Wearable Injectors Market for Insulin in Argentina, Historical Trends (Since 2022) and Forecasted Estimates (Till 2035) (By Value)
- 31.3.5. Wearable Injectors Market for Insulin in Middle East and North Africa, Historical Trends (Since 2022) and Forecasted Estimates (Till 2035) (By Value)
- 31.3.5.1. Wearable Injectors Market for Insulin in Saudi Arabia, Historical Trends (Since 2022) and Forecasted Estimates (Till 2035) (By Value)
- 31.3.5.2. Wearable Injectors Market for Insulin in Israel, Historical Trends (Since 2022) and Forecasted Estimates (Till 2035) (By Value)
- 31.3.5.3. Wearable Injectors Market for Insulin in Egypt, Historical Trends (Since 2022) and Forecasted Estimates (Till 2035) (By Value)
- 31.3.1. Wearable Injectors Market for Insulin in North America, Historical Trends (Since 2022) and Forecasted Estimates (Till 2035) (By Value)
- 31.4. Wearable Injectors Market for Insulin: Distribution by Geographical Regions (By Volume)
- 31.4.1. Wearable Injectors Market for Insulin in North America, Historical Trends (Since 2022) and Forecasted Estimates (Till 2035) (By Volume)
- 31.4.1.1. Wearable Injectors Market for Insulin in the US, Historical Trends (Since 2022) and Forecasted Estimates (Till 2035) (By Volume)
- 31.4.1.2. Wearable Injectors Market for Insulin in Canada, Historical Trends (Since 2022) and Forecasted Estimates (Till 2035) (By Volume)
- 31.4.2. Wearable Injectors Market for Insulin in Europe, Historical Trends (Since 2022) and Forecasted Estimates (Till 2035) (By Volume)
- 31.4.2.1. Wearable Injectors Market for Insulin in Germany, Historical Trends (Since 2022) and Forecasted Estimates (Till 2035) (By Volume)
- 31.4.2.2. Wearable Injectors Market for Insulin in the UK, Historical Trends (Since 2022) and Forecasted Estimates (Till 2035) (By Volume)
- 31.4.2.3. Wearable Injectors Market for Insulin in Spain, Historical Trends (Since 2022) and Forecasted Estimates (Till 2035) (By Volume)
- 31.4.2.4. Wearable Injectors Market for Insulin in France, Historical Trends (Since 2022) and Forecasted Estimates (Till 2035) (By Volume)
- 31.4.2.5. Wearable Injectors Market for Insulin in Italy, Historical Trends (Since 2022) and Forecasted Estimates (Till 2035) (By Volume)
- 31.4.2.6. Wearable Injectors Market for Insulin in Rest of Europe, Historical Trends (Since 2022) and Forecasted Estimates (Till 2035) (By Volume)
- 31.4.3. Wearable Injectors Market for Insulin in Asia, Historical Trends (Since 2022) and Forecasted Estimates (Till 2035) (By Volume)
- 31.4.3.1. Wearable Injectors Market for Insulin in China, Historical Trends (Since 2022) and Forecasted Estimates (Till 2035) (By Volume)
- 31.4.3.2. Wearable Injectors Market for Insulin in India, Historical Trends (Since 2022) and Forecasted Estimates (Till 2035) (By Volume)
- 31.4.3.3. Wearable Injectors Market for Insulin in Japan, Historical Trends (Since 2022) and Forecasted Estimates (Till 2035) (By Volume)
- 31.4.3.4. Wearable Injectors Market for Insulin in Pakistan, Historical Trends (Since 2022) and Forecasted Estimates (Till 2035) (By Volume)
- 31.4.3.5. Wearable Injectors Market for Insulin in Rest of Asia, Historical Trends (Since 2022) and Forecasted Estimates (Till 2035) (By Volume)
- 31.4.4. Wearable Injectors Market for Insulin in Latin America, Historical Trends (Since 2022) and Forecasted Estimates (Till 2035) (By Volume)
- 31.4.4.1. Wearable Injectors Market for Insulin in Brazil, Historical Trends (Since 2022) and Forecasted Estimates (Till 2035) (By Volume)
- 31.4.4.2. Wearable Injectors Market for Insulin in Mexico, Historical Trends (Since 2022) and Forecasted Estimates (Till 2035) (By Volume)
- 31.4.4.3. Wearable Injectors Market for Insulin in Argentina, Historical Trends (Since 2022) and Forecasted Estimates (Till 2035) (By Volume)
- 31.4.5. Wearable Injectors Market for Insulin in Middle East and North Africa, Historical Trends (Since 2022) and Forecasted Estimates (Till 2035) (By Volume)
- 31.4.5.1. Wearable Injectors Market for Insulin in Saudi Arabia, Historical Trends (Since 2022) and Forecasted Estimates (Till 2035) (By Volume)
- 31.4.5.2. Wearable Injectors Market for Insulin in Israel, Historical Trends (Since 2022) and Forecasted Estimates (Till 2035) (By Volume)
- 31.4.5.3. Wearable Injectors Market for Insulin in Egypt, Historical Trends (Since 2022) and Forecasted Estimates (Till 2035) (By Volume)
- 31.4.1. Wearable Injectors Market for Insulin in North America, Historical Trends (Since 2022) and Forecasted Estimates (Till 2035) (By Volume)
- 31.5. Market Dynamics Assessment
- 31.5.1. Penetration Growth (P-G) Matrix
- 31.5.2. Market Movement Analysis
- 31.6. Data Triangulation and Validation
32. CONCLUDING INSIGHTS
33. EXECUTIVE INSIGHTS
34. APPENDIX I: TABULATED DATA
35. APPENDIX II: LIST OF COMPANIES AND ORGANIZATIONS
List of Tables
- Table 7.1 Wearable Injectors for Non-Insulin Drugs: Information on Status of Development, Type of Device and Usability
- Table 7.2 Wearable Injectors for Non-Insulin Drugs: Information on Type of Dose, Type of Drug Container and Mode of Drug Filling
- Table 7.3 Wearable Injectors for Non-Insulin Drugs: Information on Container Volume, Route of Administration and Mode of Injection
- Table 7.4 Wearable Injectors for Non-Insulin Drugs: Information on Mechanism of Action / Driving Force and Type of Technology
- Table 7.5 Wearable Injectors for Non-Insulin Drugs: Information on Availability of Connectivity Feature and Type of Compatible Drug
- Table 7.6 Wearable Injectors for Non-Insulin Drugs: Information on Compatibility with High Viscosity Drugs and Therapeutic Area
- Table 7.7 Wearable Injectors for Non-Insulin Drugs: Information on Device Developer, Year of Establishment, Company Size, and Location of Headquarters
- Table 8.1 Drug Device Combinations for Non-Insulin Drugs: Information on Status of Development, Type of Device and Usability
- Table 8.2 Drug Device Combinations for Non-Insulin Drugs: Information on Type of Dose, Mode of Drug Filling, Type of Drug Container and Container Volume
- Table 8.3 Drug Device Combinations for Non-Insulin Drugs: Information on Route of Administration, Mode of Injection and Type of Compatible Drug
- Table 8.4 Drug Device Combinations for Non-Insulin Drugs: Information on Drug Delivery Technology, Mechanism of Action / Driving Force and Therapeutic Area
- Table 8.5 Drug Device Combinations for Non-Insulin Drugs: Information on Device Developer, Year of Establishment, Company Size, and Location of Headquarters
- Table 9.1 Wearable Injectors for Insulin: Information on Status of Development, Type of Device and Type of Insulin Delivery
- Table 9.2 Wearable Injectors for Insulin: Information on Type of Automated Insulin Delivery, Type of Connectivity Feature and Type of Feedback Mechanism
- Table 9.3 Wearable Injectors for Insulin: Information on Waterproofing Capability, Usability and Period of Use
- Table 9.4 Wearable Injectors for Insulin: Information on Type of Advanced Feature, Type of Drug Container and Mode of Drug Filling
- Table 9.5 Wearable Injectors for Insulin: Information on Type of Dose, Type of Diabetes and Availability of Connectivity Feature
- Table 9.6 Wearable Injectors for Insulin: Information on Device Developer, Year of Establishment, Company Size, and Location of Headquarters
- Table 11.1 Wearable Injector Developers: List of Companies Profiled
- Table 11.2 CCBio: Company Overview
- Table 11.3 CCBio: Device Portfolio
- Table 11.4 CCBio: Recent Developments and Future Outlook
- Table 11.5 E3D Elcam Drug Delivery Device: Company Overview
- Table 11.6 E3D Elcam Drug Delivery Device: Device Portfolio
- Table 11.7 E3D Elcam Drug Delivery Devices: Recent Developments and Future Outlook
- Table 11.8 Enable Injections: Company Overview
- Table 11.9 Enable Injections: Device Portfolio
- Table 11.10 Enable Injections: Recent Developments and Future Outlook
- Table 11.11 Gerresheimer: Company Overview
- Table 11.12 Gerresheimer: Device Portfolio
- Table 11.13 Gerresheimer: Recent Developments and Future Outlook
- Table 11.14 Sonceboz: Company Overview
- Table 11.15 Sonceboz: Device Portfolio
- Table 11.16 Sonceboz: Recent Developments and Future Outlook
- Table 11.17 Weibel CDS: Company Overview
- Table 11.18 Weibel CDS: Device Portfolio
- Table 11.19 Weibel CDS: Developments and Future Outlook
- Table 11.20 West Pharmaceuticals: Company Overview
- Table 11.21 West Pharmaceuticals: Device Portfolio
- Table 11.22 West Pharmaceuticals: Developments and Future Outlook
- Table 11.23 CeQur: Company Overview
- Table 11.24 CeQur: Device Portfolio
- Table 11.25 CeQur: Developments and Future Outlook
- Table 11.26 Eli Lilly: Company Overview
- Table 11.27 Eli Lilly: Device Portfolio
- Table 11.28 Eli Lilly: Developments and Future Outlook
- Table 11.29 Insulet: Company Overview
- Table 11.30 Insulet: Device Portfolio
- Table 11.31 Insulet: Developments and Future Outlook
- Table 11.32 Medtronic: Company Overview
- Table 11.33 Medtronic: Device Portfolio
- Table 11.34 Medtronic: Developments and Future Outlook
- Table 11.35 Medtrum Technologies: Company Overview
- Table 11.36 Medtrum Technologies: Device Portfolio
- Table 11.37 Medtrum Technologies: Developments and Future Outlook
- Table 11.38 Roche: Company Overview
- Table 11.39 Roche: Device Portfolio
- Table 11.40 Roche: Developments and Future Outlook
- Table 11.41 SOOIL Development: Company Overview
- Table 11.42 SOOIL Development: Device Portfolio
- Table 11.43 SOOIL Development: Developments and Future Outlook
- Table 12.1 Drug Device Combination: 3 mL Micropump (Furosemide)
- Table 12.2 Drug Device Combination: 3M hMTS (Adalimumab)
- Table 12.3 Drug Device Combination: D-mine Pump (Apomorphine)
- Table 12.4 Drug Device Combination: On-body Infusor (Furosemide)
- Table 12.5 Drug Device Combination: Herceptin SC Injector (Herceptin)
- Table 12.6 Drug Device Combination: ND0712H Belt Pump (Levodopa / Carbidopa)
- Table 12.7 Drug Device Combination: ND0712L belt pump (Levodopa / Carbidopa)
- Table 12.8 Drug Device Combination: ND0712L next generation patch pump (Levodopa / Carbidopa)
- Table 12.9 Drug Device Combination: ND0801 (Apomorphine)
- Table 12.10 Drug Device Combination: ND0901 (Levodopa / Carbidopa)
- Table 12.11 Drug Device Combination: Neulasta Onpro On-Body Injector (Neulasta)
- Table 12.12 Drug Device Combination: Pushtronex System (Repatha)
- Table 12.13 Drug Device Combination: SMT-201 (Ketorolac)
- Table 12.14 Drug Device Combination: SMT-301 (Bupivacaine)
- Table 12.15 Drug Device Combination: The LUTREPULSE System (Lutrepulse)
- Table 12.16 Drug Device Combination: Trevyent (Treprostinil)
- Table 12.17 Drug Device Combination: Ultomris (Ravulizumab)
- Table 13.1 Wearable Injectors: List of Partnerships and Collaborations, 2018-2021
- Table 14.1 Wearable Injectors: List of Key Acquisitions, 2000-2023
- Table 14.2 Non-Insulin Drug Delivery Devices: Likelihood of Players for Acquisition
- Table 14.3 Insulin Delivery Devices: Likelihood of Players for Acquisition
- Table 15.1 Patent Analysis: Prominent CPC Symbols
- Table 15.2 Patent Analysis: List of Top CPC Symbols
- Table 15.3 Patent Analysis: Most Popular CPC Symbols
- Table 15.4 Patent Analysis: Summary of Benchmarking Analysis
- Table 15.5 Patent Analysis: Categorization based on Weighted Valuation Scores
- Table 15.6 Patent Analysis: List of Leading Patents (by Highest Relative Valuation)
- Table 16.1 Marketed Drugs: Most Likely Candidates for Delivery via Wearable Injectors
- Table 16.2 Marketed Drugs: Likely Candidates for Delivery via Wearable Injectors
- Table 16.3 Marketed Drugs: Less Likely Candidates for Delivery via Wearable Injectors
- Table 16.4 Marketed Drugs: Least Likely Candidates for Delivery via Wearable Injectors
- Table 16.5 Clinical Stage Drugs: Most Likely Candidates for Delivery via Wearable Injectors
- Table 16.6 Clinical Stage Drugs: Likely Candidates for Delivery via Wearable Injectors
- Table 16.7 Clinical Stage Drugs: Less Likely Candidates for Delivery via Wearable Injectors
- Table 16.8 Clinical Stage Drugs: Least Likely Candidates for Delivery via Wearable Injectors
- Table 18.1 List of Funding Instances: Information on Company, Year of Funding, Type, Amount Invested and Investors
- Table 20.1 List of Contract Manufacturing Organizations
- Table 20.2 List of Medical Device Product Design and Development Companies
- Table 21.1 General Guidelines for Market Authorization and Reimbursement for Medical Devices
- Table 21.2 Device Classification: US
- Table 21.3 Device Classification: Canada
- Table 21.4 Data Requirements and Characteristics of Province-wide HTA Processes in Canada
- Table 21.5 Device Classification: Mexico
- Table 21.6 Device Classification: Europe
- Table 21.7 List of CE Directives in Europe
- Table 21.8 Conformity Assessment Modules in Europe
- Table 21.9 Device Classification: Australia
- Table 21.10 Medical Devices Reimbursement and Pricing Approval Process: Australia
- Table 21.11 Device Classification: Brazil
- Table 21.12 Device Classification: China
- Table 21.13 Device Classification: India
- Table 21.14 Device Classification: Japan
- Table 21.15 Medical Devices Reimbursement Categories
- Table 21.16 Device Classification: Medsafe
- Table 21.17 Device Classification: Singapore
- Table 21.18 Device Classification: South Korea
- Table 21.19 Device Classification: South Africa
- Table 21.20 Device Classification: Thailand
- Table 21.21 Medical Devices Regulatory Landscape Summary
- Table 21.22 Medical Devices Reimbursement Landscape Summary
- Table 25.1 Company Snapshot: Company A
- Table 25.2 Company Snapshot: Company B
- Table 25.3 Company Snapshot: Company C
- Table 25.4 Company Snapshot: Company D
- Table 25.5 Company Snapshot: Company E
- Table 25.6 Company Snapshot: Company F
- Table 25.7 Company Snapshot: Company G
- Table 25.8 Company Snapshot: Company H
- Table 25.9 Company Snapshot: Company I
- Table 25.10 Company Snapshot: Company J
- Table 34.1 Wearable Injectors for Non-Insulin Drugs: Distribution by Type of Device
- Table 34.2 Wearable Injectors for Non-Insulin Drugs: Distribution by Status of Development
- Table 34.3 Wearable Injectors for Non-Insulin Drugs: Distribution by Mode of Drug Filling
- Table 34.4 Wearable Injectors for Non-Insulin Drugs: Distribution by Type of Drug Delivery
- Table 34.5 Wearable Injectors for Non-Insulin Drugs: Distribution by Usability
- Table 34.6 Wearable Injectors for Non-Insulin Drugs: Distribution by Drug Reservoir Volume
- Table 34.7 Wearable Injectors for Non-Insulin Drugs: Distribution by Type of Drug Molecule
- Table 34.8 Wearable Injectors for Non-Insulin Drugs: Distribution by Type of Dose
- Table 34.9 Wearable Injectors for Non-Insulin Drugs: Distribution by Dose of Drug
- Table 34.10 Wearable Injectors for Non-Insulin Drugs: Distribution by Mode of Injection
- Table 34.11 Wearable Injectors for Non-Insulin Drugs: Distribution by Therapeutic Area
- Table 34.12 Wearable Injectors for Non-Insulin Drugs: Distribution by Type of Drug Container
- Table 34.13 Wearable Injectors for Non-Insulin Drugs: Distribution by Mode of Drug Filling
- Table 34.14 Wearable Injectors for Non-Insulin Drug Developers: Distribution by Year of Establishment
- Table 34.15 Wearable Injectors for Non-Insulin Drug Developers: Distribution by Company Size
- Table 34.16 Wearable Injectors for Non-Insulin Drug Developers: Distribution by Location of Headquarters
- Table 34.17 Leading Players: Distribution by Number of Wearable Injectors Developed for Non-Insulin
- Table 34.18 Drug Device Combinations for Non-Insulin Drugs: Distribution by Type of Device
- Table 34.19 Drug Device Combinations for Non-Insulin Drugs: Distribution by Status of Development
- Table 34.20 Drug Device Combinations for Non-Insulin Drugs: Distribution by Type of Drug Delivery
- Table 34.21 Drug Device Combinations for Non-Insulin Drugs: Distribution by Usability
- Table 34.22 Drug Device Combinations for Non-Insulin Drugs: Distribution by Drug Reservoir Volume
- Table 34.23 Drug Device Combinations for Non-Insulin Drugs: Distribution by Type of Drug Molecule
- Table 34.24 Drug Device Combinations for Non-Insulin Drugs: Distribution by Type of Dose
- Table 34.25 Drug Device Combinations for Non-Insulin Drugs: Distribution by Dose of Drug
- Table 34.26 Drug Device Combinations for Non-Insulin Drugs: Distribution by Mode of Injection
- Table 34.27 Drug Device Combinations for Non-Insulin Drugs: Distribution by Therapeutic Area
- Table 34.28 Drug Device Combinations for Non-Insulin Drugs: Distribution by Type of Drug Container
- Table 34.29 Drug Device Combinations for Non-Insulin Drugs: Distribution by Mode of Drug Filling
- Table 34.30 Drug Device Combinations for Non-Insulin Drug Developers: Distribution by Year of Establishment
- Table 34.31 Drug Device Combinations for Non-Insulin Drug Developers: Distribution by Company Size
- Table 34.32 Drug Device Combinations for Non-Insulin Drug Developers: Distribution by Location of Headquarters
- Table 34.33 Device Developers: Distribution by Number of Drug Device Combination Developed
- Table 34.34 Wearable Injectors for Insulin: Distribution by Type of Device
- Table 34.35 Wearable Injectors for Insulin: Distribution by Status of Development
- Table 34.36 Wearable Injectors for Insulin: Distribution by Type of Insulin Delivery
- Table 34.37 Wearable Injectors for Insulin: Distribution by Type of Automated Insulin Delivery
- Table 34.38 Wearable Injectors for Insulin: Distribution by Type of Connectivity Feature
- Table 34.39 Wearable Injectors for Insulin: Distribution by Waterproof Capability
- Table 34.40 Wearable Injectors for Insulin: Distribution by Usability
- Table 34.41 Wearable Injectors for Insulin: Distribution by Period of Use
- Table 34.42 Wearable Injectors for Insulin: Distribution by Type of Advanced Feature
- Table 34.43 Wearable Injectors for Insulin: Distribution by Type of Drug Container
- Table 34.44 Wearable Injectors for Insulin: Distribution by Mode of Drug Filling
- Table 34.45 Wearable Injectors for Insulin: Distribution by Type of Dose
- Table 34.46 Wearable Injectors for Insulin: Distribution by Type of Diabetes
- Table 34.47 Wearable Injectors for Insulin: Distribution by Availability of Connectivity Feature
- Table 34.48 Wearable Injectors for Insulin Drug Developers: Distribution by Year of Establishment
- Table 34.49 Wearable Injectors for Insulin Drug Developers: Distribution by Company Size
- Table 34.50 Wearable Injectors for Insulin Drug Developers: Distribution by Location of Headquarters
- Table 34.51 Leading Players: Distribution by Number of Wearable Injectors for Insulin
- Table 34.52 Product Competitiveness Analysis: Wearable Injectors for Non-Insulin Drugs
- Table 34.53 Product Competitiveness Analysis: Drug Device Combinations for Non-Insulin Drugs
- Table 34.54 Product Competitiveness Analysis: Wearable Injectors for Insulin
- Table 34.55 Gerresheimer: Annual Revenues, FY 2022 Onwards (EUR Million)
- Table 34.56 West Pharmaceuticals: Annual Revenues, FY 2022 Onwards (USD Billion)
- Table 34.57 Eli Lilly: Annual Revenues, FY 2022 Onwards (USD Billion)
- Table 34.58 Insulet: Annual Revenues, FY 2022 Onwards (USD Million)
- Table 34.59 Medtronic: Annual Revenues, FY 2022 Onwards (USD Billion)
- Table 34.60 Roche: Annual Revenues, FY 2022 Onwards (CHF Billion)
- Table 34.61 Partnerships and Collaborations: Cumulative Year-wise Trend, Since 2015
- Table 34.62 Partnerships and Collaborations: Distribution by Type of Partnership
- Table 34.63 Partnerships and Collaborations: Distribution by Year and Type of Partnership, Since 2015
- Table 34.64 Partnerships and Collaborations: Distribution by Partner
- Table 34.65 Partnerships and Collaborations: Distribution by Year of Partnership and Type of Partner
- Table 34.66 Partnerships and Collaborations: Distribution by Type of Device
- Table 34.67 Most Active Players: Distribution by Number of Partnerships
- Table 34.68 Most Active Players: Distribution by Type of Partnership
- Table 34.69 Partnerships and Collaborations: Local and International Agreements
- Table 34.70 Partnerships and Collaborations: Intercontinental and Intracontinental Agreements
- Table 34.71 Patent Analysis: Distribution by Type of Patent
- Table 34.72 Patent Analysis: Distribution by Patent Publication Year
- Table 34.73 Patent Analysis: Distribution by Patent Application Year
- Table 34.74 Patent Analysis: Distribution by Granted Patents and Patent Applications by Publication Year
- Table 34.75 Patent Analysis: Distribution by Jurisdiction
- Table 34.76 Patent Analysis: Distribution by Type of Applicant
- Table 34.77 Leading Industry Players: Distribution by Number of Patents
- Table 34.78 Leading Non-Industry Players: Distribution by Number of Patents
- Table 34.79 Leading Individual Assignees: Distribution by Number of Patents
- Table 34.80 Patent Analysis: Distribution by Patent Age
- Table 34.81 Wearable Injectors: Patent Valuation
- Table 34.82 Clinical Trial Analysis: Distribution by Trial Recruitment Status
- Table 34.83 Clinical Trial Analysis: Cumulative Distribution by Trial Registration Year
- Table 34.84 Clinical Trial Analysis: Distribution of Enrolled Patient Population by Trial Registration Year
- Table 34.85 Clinical Trial Analysis: Distribution by Trial Phase
- Table 34.86 Clinical Trial Analysis: Distribution of Enrolled Patient Population by Trial Phase
- Table 34.87 Clinical Trial Analysis: Cumulative Distribution by Trial Registration Year and Trial Recruitment Status
- Table 34.88 Clinical Trial Analysis: Distribution by Study Design
- Table 34.89 Clinical Trial Analysis: Distribution by Type of Sponsor / Collaborator
- Table 34.90 Clinical Trial Analysis: Distribution by Therapeutic Area
- Table 34.91 Most Active Players: Distribution by Number of Registered Trials
- Table 34.92 Most Popular Wearable Injectors: Distribution by Number of Registered Trials
- Table 34.93 Clinical Trial Analysis: Geographical Distribution by Number of Clinical Trials
- Table 34.94 Clinical Trial Analysis: Distribution of Enrolled Patient Population by Trial Recruitment Status and Geography
- Table 34.95 Funding and Investment Analysis: Distribution of Year of Funding, Since 2014
- Table 34.96 Funding and Investment Analysis: Distribution of Amount Invested by Year, Since 2014 (USD Million)
- Table 34.97 Funding and Investment Analysis: Distribution by Type of Funding
- Table 34.98 Funding and Investment Analysis: Distribution by Type of Device
- Table 34.99 Funding and Investment Analysis: Year-wise Distribution by Type of Funding and Amount Raised (USD Million)
- Table 34.100 Funding and Investment Analysis: Distribution by Target Disease Indication
- Table 34.101 Most Active Players: Distribution by Number of Funding Instances
- Table 34.102 Most Active Players: Distribution by Amount Invested
- Table 34.103 Leading Investors: Distribution by Number of Funding Instances
- Table 34.104 Funding and Investments: Distribution by Geography
- Table 34.105 Global Wearable Injectors Market for Non-Insulin Drugs, Historical Trends (Since 2022) and Forecasted Estimates (Till 2035) (By Value)
- Table 34.106 Global Wearable Injectors Market for Non-Insulin Drugs, Historical Trends (Since 2022) and Forecasted Estimates (Till 2035) (By Volume)
- Table 34.107 Wearable Injectors Market for Non-Insulin Drugs: Distribution by Type of Device (By Value)
- Table 34.108 Wearable Patch Pump Market for Non-Insulin Drugs, Historical Trends (Since 2022) and Forecasted Estimates (Till 2035) (By Value)
- Table 34.109 Wearable Infusion Pump Market for Non-Insulin Drugs, Historical Trends (Since 2022) and Forecasted Estimates (Till 2035) (By Value)
- Table 34.110 Wearable Injectors Market for Non-Insulin Drugs: Distribution by Type of Device (By Volume)
- Table 34.111 Wearable Patch Pump Market for Non-Insulin Drugs, Historical Trends (Since 2022) and Forecasted Estimates (Till 2035) (By Volume)
- Table 34.112 Wearable Infusion Pump Market for Non-Insulin Drugs, Historical Trends (Since 2022) and Forecasted Estimates (Till 2035) (By Volume)
- Table 34.113 Wearable Injectors Market for Non-Insulin Drugs: Distribution by Usability (By Value)
- Table 34.114 Disposable Wearable Injectors Market for Non-Insulin Drugs, Historical Trends (Since 2022) and Forecasted Estimates (Till 2035) (By Value)
- Table 34.115 Reusable / Disposable Components Wearable Injectors Market for Non-Insulin Drugs, Historical Trends (Since 2022) and Forecasted Estimates (Till 2035) (By Value)
- Table 34.116 Wearable Injectors Market for Non-Insulin Drugs: Distribution by Usability (By Volume)
- Table 34.117 Disposable Wearable Injectors Market for Non-Insulin Drugs, Historical Trends (Since 2022) and Forecasted Estimates (Till 2035) (By Volume)
- Table 34.118 Reusable / Disposable Components Wearable Injectors Market for Non-Insulin Drugs, Historical Trends (Since 2022) and Forecasted Estimates (Till 2035) (By Volume)
- Table 34.119 Wearable Injectors Market for Non-Insulin Drugs: Distribution by Therapeutic Area (By Value)
- Table 34.120 Wearable Injectors Market for Non-Insulin Drugs Targeting Oncological Disorders, Historical Trends (Since 2022) and Forecasted Estimates (Till 2035) (By Value)
- Table 34.121 Wearable Injectors Market for Non-Insulin Drugs Targeting Cardiovascular Disorders, Historical Trends (Since 2022) and Forecasted Estimates (Till 2035) (By Value)
- Table 34.122 Wearable Injectors Market for Non-Insulin Drugs Targeting Autoimmune Disorders, Historical Trends (Since 2022) and Forecasted Estimates (Till 2035) (By Value)
- Table 34.123 Wearable Injectors Market for Non-Insulin Drugs Targeting Neurological Disorders, Historical Trends (Since 2022) and Forecasted Estimates (Till 2035) (By Value)
- Table 34.124 Wearable Injectors Market for Non-Insulin Drugs Targeting Other Disorders, Historical Trends (Since 2022) and Forecasted Estimates (Till 2035) (By Value)
- Table 34.125 Wearable Injectors Market for Non-Insulin Drugs: Distribution by Therapeutic Area (By Volume)
- Table 34.126 Wearable Injectors Market for Non-Insulin Drugs Targeting Oncological Disorders, Historical Trends (Since 2022) and Forecasted Estimates (Till 2035) (By Volume)
- Table 34.127 Wearable Injectors Market for Non-Insulin Drugs Targeting Cardiovascular Disorders, Historical Trends (Since 2022) and Forecasted Estimates (Till 2035) (By Volume)
- Table 34.128 Wearable Injectors Market for Non-Insulin Drugs Targeting Autoimmune Disorders, Historical Trends (Since 2022) and Forecasted Estimates (Till 2035) (By Volume)
- Table 34.129 Wearable Injectors Market for Non-Insulin Drugs Targeting Neurological Disorders, Historical Trends (Since 2022) and Forecasted Estimates (Till 2035) (By Volume)
- Table 34.130 Wearable Injectors Market for Non-Insulin Drugs Targeting Other Disorders, Historical Trends (Since 2022) and Forecasted Estimates (Till 2035) (By Volume)
- Table 34.131 Wearable Injectors Market for Non-Insulin Drugs: Distribution by Geographical Regions (By Value)
- Table 34.132 Wearable Injectors Market for Non-Insulin Drugs in North America, Historical Trends (Since 2022) and Forecasted Estimates (Till 2035) (By Value)
- Table 34.133 Wearable Injectors Market for Non-Insulin Drugs in Europe, Historical Trends (Since 2022) and Forecasted Estimates (Till 2035) (By Value)
- Table 34.134 Wearable Injectors Market for Non-Insulin Drugs in Asia, Historical Trends (Since 2022) and Forecasted Estimates (Till 2035) (By Value)
- Table 34.135 Wearable Injectors Market for Non-Insulin Drugs in Latin America, Historical Trends (Since 2022) and Forecasted Estimates (Till 2035) (By Value)
- Table 34.136 Wearable Injectors Market for Non-Insulin Drugs in Middle East and North Africa, Historical Trends (Since 2022) and Forecasted Estimates (Till 2035) (By Value)
- Table 34.137 Wearable Injectors Market for Non-Insulin Drugs: Distribution by Geographical Regions (By Volume)
- Table 34.138 Wearable Injectors Market for Non-Insulin Drugs in North America, Historical Trends (Since 2022) and Forecasted Estimates (Till 2035) (By Volume)
- Table 34.139 Wearable Injectors Market for Non-Insulin Drugs in Europe, Historical Trends (Since 2022) and Forecasted Estimates (Till 2035) (By Volume)
- Table 34.140 Wearable Injectors Market for Non-Insulin Drugs in Asia, Historical Trends (Since 2022) and Forecasted Estimates (Till 2035) (By Volume)
- Table 34.141 Wearable Injectors Market for Non-Insulin Drugs in Latin America, Historical Trends (Since 2022) and Forecasted Estimates (Till 2035) (By Volume)
- Table 34.142 Wearable Injectors Market for Non-Insulin Drugs in Middle East and North Africa, Historical Trends (Since 2022) and Forecasted Estimates (Till 2035) (By Volume)
- Table 34.143 Global Wearable Injectors Market for Insulin, Historical Trends (Since 2022) and Forecasted Estimates (Till 2035) (By Value)
- Table 34.144 Global Wearable Injectors Market for Insulin, Historical Trends (Since 2022) and Forecasted Estimates (Till 2035) (By Volume)
- Table 34.145 Wearable Injectors Market for Insulin: Distribution by Type of Device (By Value)
- Table 34.146 Wearable Patch Pump Market for Insulin, Historical Trends (Since 2022) and Forecasted Estimates (Till 2035) (By Value)
- Table 34.147 Wearable Infusion Pump Market for Insulin, Historical Trends (Since 2022) and Forecasted Estimates (Till 2035) (By Value)
- Table 34.148 Wearable Injectors Market for Insulin: Distribution by Type of Device (By Volume)
- Table 34.149 Wearable Patch Pump Market for Insulin, Historical Trends (Since 2022) and Forecasted Estimates (Till 2035) (By Volume)
- Table 34.150 Wearable Infusion Pump Market for Insulin, Historical Trends (Since 2022) and Forecasted Estimates (Till 2035) (By Volume)
- Table 34.151 Wearable Injectors Market for Insulin: Distribution by Degree of Automation (By Value)
- Table 34.152 Automated / Smart Wearable Injectors Market for Insulin, Historical Trends (Since 2022) and Forecasted Estimates (Till 2035) (By Value)
- Table 34.153 Manual Wearable Injectors Market for Insulin, Historical Trends (Since 2022) and Forecasted Estimates (Till 2035) (By Value)
- Table 34.154 Wearable Injectors Market for Insulin: Distribution by Degree of Automation (By Volume)
- Table 34.155 Automated / Smart Wearable Injectors Market for Insulin, Historical Trends (Since 2022) and Forecasted Estimates (Till 2035) (By Volume)
- Table 34.156 Manual Wearable Injectors Market for Insulin, Historical Trends (Since 2022) and Forecasted Estimates (Till 2035) (By Volume)
- Table 34.157 Wearable Injectors Market for Insulin: Distribution by Geographical Regions (By Value)
- Table 34.158 Wearable Injectors Market for Insulin in North America, Historical Trends (Since 2022) and Forecasted Estimates (Till 2035) (By Value)
- Table 34.159 Wearable Injectors Market for Insulin in the US, Historical Trends (Since 2022) and Forecasted Estimates (Till 2035) (By Value)
- Table 34.160 Wearable Injectors Market for Insulin in Canada, Historical Trends (Since 2022) and Forecasted Estimates (Till 2035) (By Value)
- Table 34.161 Wearable Injectors Market for Insulin in Europe, Historical Trends (Since 2022) and Forecasted Estimates (Till 2035) (By Value)
- Table 34.162 Wearable Injectors Market for Insulin in Germany, Historical Trends (Since 2022) and Forecasted Estimates (Till 2035) (By Value)
- Table 34.163 Wearable Injectors Market for Insulin in the UK, Historical Trends (Since 2022) and Forecasted Estimates (Till 2035) (By Value)
- Table 34.164 Wearable Injectors Market for Insulin in Spain, Historical Trends (Since 2022) and Forecasted Estimates (Till 2035) (By Value)
- Table 34.165 Wearable Injectors Market for Insulin in France, Historical Trends (Since 2022) and Forecasted Estimates (Till 2035) (By Value)
- Table 34.166 Wearable Injectors Market for Insulin in Italy, Historical Trends (Since 2022) and Forecasted Estimates (Till 2035) (By Value)
- Table 34.167 Wearable Injectors Market for Insulin in Rest of Europe, Historical Trends (Since 2022) and Forecasted Estimates (Till 2035) (By Value)
- Table 34.168 Wearable Injectors Market for Insulin in Asia, Historical Trends (Since 2022) and Forecasted Estimates (Till 2035) (By Value)
- Table 34.169 Wearable Injectors Market for Insulin in China, Historical Trends (Since 2022) and Forecasted Estimates (Till 2035) (By Value)
- Table 34.170 Wearable Injectors Market for Insulin in India, Historical Trends (Since 2022) and Forecasted Estimates (Till 2035) (By Value)
- Table 34.171 Wearable Injectors Market for Insulin in Japan, Historical Trends (Since 2022) and Forecasted Estimates (Till 2035) (By Value)
- Table 34.172 Wearable Injectors Market for Insulin in Pakistan, Historical Trends (Since 2022) and Forecasted Estimates (Till 2035) (By Value)
- Table 34.173 Wearable Injectors Market for Insulin in Rest of Asia, Historical Trends (Since 2022) and Forecasted Estimates (Till 2035) (By Value)
- Table 34.174 Wearable Injectors Market for Insulin in Latin America, Historical Trends (Since 2022) and Forecasted Estimates (Till 2035) (By Value)
- Table 34.175 Wearable Injectors Market for Insulin in Brazil, Historical Trends (Since 2022) and Forecasted Estimates (Till 2035) (By Value)
- Table 34.176 Wearable Injectors Market for Insulin in Mexico, Historical Trends (Since 2022) and Forecasted Estimates (Till 2035) (By Value)
- Table 34.177 Wearable Injectors Market for Insulin in Argentina, Historical Trends (Since 2022) and Forecasted Estimates (Till 2035) (By Value)
- Table 34.178 Wearable Injectors Market for Insulin in Middle East and North Africa, Historical Trends (Since 2022) and Forecasted Estimates (Till 2035) (By Value)
- Table 34.179 Wearable Injectors Market for Insulin in Saudi Arabia, Historical Trends (Since 2022) and Forecasted Estimates (Till 2035) (By Value)
- Table 34.180 Wearable Injectors Market for Insulin in Israel, Historical Trends (Since 2022) and Forecasted Estimates (Till 2035) (By Value)
- Table 34.181 Wearable Injectors Market for Insulin in Egypt, Historical Trends (Since 2022) and Forecasted Estimates (Till 2035) (By Value)
- Table 34.182 Wearable Injectors Market for Insulin: Distribution by Geographical Regions (By Volume)
- Table 34.183 Wearable Injectors Market for Insulin in North America, Historical Trends (Since 2022) and Forecasted Estimates (Till 2035) (By Volume)
- Table 34.184 Wearable Injectors Market for Insulin in the US, Historical Trends (Since 2022) and Forecasted Estimates (Till 2035) (By Volume)
- Table 34.185 Wearable Injectors Market for Insulin in Canada, Historical Trends (Since 2022) and Forecasted Estimates (Till 2035) (By Volume)
- Table 34.186 Wearable Injectors Market for Insulin in Europe, Historical Trends (Since 2022) and Forecasted Estimates (Till 2035) (By Volume)
- Table 34.187 Wearable Injectors Market for Insulin in Germany, Historical Trends (Since 2022) and Forecasted Estimates (Till 2035) (By Volume)
- Table 34.188 Wearable Injectors Market for Insulin in the UK, Historical Trends (Since 2022) and Forecasted Estimates (Till 2035) (By Volume)
- Table 34.189 Wearable Injectors Market for Insulin in Spain, Historical Trends (Since 2022) and Forecasted Estimates (Till 2035) (By Volume)
- Table 34.190 Wearable Injectors Market for Insulin in France, Historical Trends (Since 2022) and Forecasted Estimates (Till 2035) (By Volume)
- Table 34.191 Wearable Injectors Market for Insulin in Italy, Historical Trends (Since 2022) and Forecasted Estimates (Till 2035) (By Volume)
- Table 34.192 Wearable Injectors Market for Insulin in Rest of Europe, Historical Trends (Since 2022) and Forecasted Estimates (Till 2035) (By Volume)
- Table 34.193 Wearable Injectors Market for Insulin in Asia, Historical Trends (Since 2022) and Forecasted Estimates (Till 2035) (By Volume)
- Table 34.194 Wearable Injectors Market for Insulin in China, Historical Trends (Since 2022) and Forecasted Estimates (Till 2035) (By Volume)
- Table 34.195 Wearable Injectors Market for Insulin in India, Historical Trends (Since 2022) and Forecasted Estimates (Till 2035) (By Volume)
- Table 34.196 Wearable Injectors Market for Insulin in Japan, Historical Trends (Since 2022) and Forecasted Estimates (Till 2035) (By Volume)
- Table 34.197 Wearable Injectors Market for Insulin in Pakistan, Historical Trends (Since 2022) and Forecasted Estimates (Till 2035) (By Volume)
- Table 34.198 Wearable Injectors Market for Insulin in Rest of Asia, Historical Trends (Since 2022) and Forecasted Estimates (Till 2035) (By Volume)
- Table 34.199 Wearable Injectors Market for Insulin in Latin America, Historical Trends (Since 2022) and Forecasted Estimates (Till 2035) (By Volume)
- Table 34.200 Wearable Injectors Market for Insulin in Brazil, Historical Trends (Since 2022) and Forecasted Estimates (Till 2035) (By Volume)
- Table 34.201 Wearable Injectors Market for Insulin in Mexico, Historical Trends (Since 2022) and Forecasted Estimates (Till 2035) (By Volume)
- Table 34.202 Wearable Injectors Market for Insulin in Argentina, Historical Trends (Since 2022) and Forecasted Estimates (Till 2035) (By Volume)
- Table 34.203 Wearable Injectors Market for Insulin in Middle East and North Africa, Historical Trends (Since 2022) and Forecasted Estimates (Till 2035) (By Volume)
- Table 34.204 Wearable Injectors Market for Insulin in Saudi Arabia, Historical Trends (Since 2022) and Forecasted Estimates (Till 2035) (By Volume)
- Table 34.205 Wearable Injectors Market for Insulin in Israel, Historical Trends (Since 2022) and Forecasted Estimates (Till 2035) (By Volume)
- Table 34.206 Wearable Injectors Market for Insulin in Egypt, Historical Trends (Since 2022) and Forecasted Estimates (Till 2035) (By Volume)
List of Figures
- Figure 2.1 Research Methodology: Project Methodology
- Figure 2.2 Research Methodology: Data Sources for Secondary Research
- Figure 2.3 Research Methodology: Robust Quality Control
- Figure 3.1 Market Dynamics: Forecast Methodology
- Figure 3.2 Market Dynamics: Market Assessment Framework
- Figure 4.1 Lessons Learnt from Past Recessions
- Figure 5.1 Executive Summary: Market Landscape
- Figure 5.2 Executive Summary: Market Trends
- Figure 5.3 Executive Summary: Market Forecast and Opportunity Analysis
- Figure 6.1 Drug Delivery Systems
- Figure 6.2 Evolution of Healthcare Safety Legislations
- Figure 6.3 Wearable Injectors Market: Key Driving Factors
- Figure 6.4 Types of Self-Injection Devices
- Figure 7.1 Wearable Injectors for Non-Insulin Drugs: Distribution by Type of Device
- Figure 7.2 Wearable Injectors for Non-Insulin Drugs: Distribution by Status of Development
- Figure 7.3 Wearable Injectors for Non-Insulin Drugs: Distribution by Mode of Drug Filling
- Figure 7.4 Wearable Injectors for Non-Insulin Drugs: Distribution by Type of Drug Delivery
- Figure 7.5 Wearable Injectors for Non-Insulin Drugs: Distribution by Usability
- Figure 7.6 Wearable Injectors for Non-Insulin Drugs: Distribution by Drug Reservoir Volume
- Figure 7.7 Wearable Injectors for Non-Insulin Drugs: Distribution by Type of Drug Molecule
- Figure 7.8 Wearable Injectors for Non-Insulin Drugs: Distribution by Type of Dose
- Figure 7.9 Wearable Injectors for Non-Insulin Drugs: Distribution by Dose of Drug
- Figure 7.10 Wearable Injectors for Non-Insulin Drugs: Distribution by Mode of Injection
- Figure 7.11 Wearable Injectors for Non-Insulin Drugs: Distribution by Therapeutic Area
- Figure 7.12 Wearable Injectors for Non-Insulin Drugs: Distribution by Type of Drug Container
- Figure 7.13 Wearable Injectors for Non-Insulin Drugs: Distribution by Mode of Drug Filling
- Figure 7.14 Wearable Injectors for Non-Insulin Drug Developers: Distribution by Year of Establishment
- Figure 7.15 Wearable Injectors for Non-Insulin Drug Developers: Distribution by Company Size
- Figure 7.16 Wearable Injectors for Non-Insulin Drug Developers: Distribution by Location of Headquarters
- Figure 7.17 Leading Players: Distribution by Number of Wearable Injectors Developed for Non-Insulin
- Figure 8.1 Drug Device Combinations for Non-Insulin Drugs: Distribution by Type of Device
- Figure 8.2 Drug Device Combinations for Non-Insulin Drugs: Distribution by Status of Development
- Figure 8.3 Drug Device Combinations for Non-Insulin Drugs: Distribution by Type of Drug Delivery
- Figure 8.4 Drug Device Combinations for Non-Insulin Drugs: Distribution by Usability
- Figure 8.5 Drug Device Combinations for Non-Insulin Drugs: Distribution by Drug Reservoir Volume
- Figure 8.6 Drug Device Combinations for Non-Insulin Drugs: Distribution by Type of Drug Molecule
- Figure 8.7 Drug Device Combinations for Non-Insulin Drugs: Distribution by Type of Dose
- Figure 8.8 Drug Device Combinations for Non-Insulin Drugs: Distribution by Dose of Drug
- Figure 8.9 Drug Device Combinations for Non-Insulin Drugs: Distribution by Mode of Injection
- Figure 8.10 Drug Device Combinations for Non-Insulin Drugs: Distribution by Therapeutic Area
- Figure 8.11 Drug Device Combinations for Non-Insulin Drugs: Distribution by Type of Drug Container
- Figure 8.12 Drug Device Combinations for Non-Insulin Drugs: Distribution by Mode of Drug Filling
- Figure 8.13 Drug Device Combinations for Non-Insulin Drug Developers: Distribution by Year of Establishment
- Figure 8.14 Drug Device Combinations for Non-Insulin Drug Developers: Distribution by Company Size
- Figure 8.15 Drug Device Combinations for Non-Insulin Drug Developers: Distribution by Location of Headquarters
- Figure 8.16 Device Developers: Distribution by Number of Drug Device Combination Developed
- Figure 9.1 Wearable Injectors for Insulin: Distribution by Type of Device
- Figure 9.2 Wearable Injectors for Insulin: Distribution by Status of Development
- Figure 9.3 Wearable Injectors for Insulin: Distribution by Type of Insulin Delivery
- Figure 9.4 Wearable Injectors for Insulin: Distribution by Type of Automated Insulin Delivery
- Figure 9.5 Wearable Injectors for Insulin: Distribution by Type of Connectivity Feature
- Figure 9.6 Wearable Injectors for Insulin: Distribution by Waterproof Capability
- Figure 9.7 Wearable Injectors for Insulin: Distribution by Usability
- Figure 9.8 Wearable Injectors for Insulin: Distribution by Period of Use
- Figure 9.9 Wearable Injectors for Insulin: Distribution by Type of Advanced Feature
- Figure 9.10 Wearable Injectors for Insulin: Distribution by Type of Drug Container
- Figure 9.11 Wearable Injectors for Insulin: Distribution by Mode of Drug Filling
- Figure 9.12 Wearable Injectors for Insulin: Distribution by Type of Dose
- Figure 9.13 Wearable Injectors for Insulin: Distribution by Type of Diabetes
- Figure 9.14 Wearable Injectors for Insulin: Distribution by Availability of Connectivity Feature
- Figure 9.15 Wearable Injectors for Insulin Drug Developers: Distribution by Year of Establishment
- Figure 9.16 Wearable Injectors for Insulin Drug Developers: Distribution by Company Size
- Figure 9.17 Wearable Injectors for Insulin Drug Developers: Distribution by Location of Headquarters
- Figure 9.18 Leading Players: Distribution by Number of Wearable Injectors for Insulin
- Figure 10.1 Product Competitiveness Analysis: Wearable Injectors for Non-Insulin Drugs
- Figure 10.2 Product Competitiveness Analysis: Drug Device Combinations for Non-Insulin Drugs
- Figure 10.3 Product Competitiveness Analysis: Wearable Injectors for Insulin
- Figure 11.1 Gerresheimer: Annual Revenues, FY 2022 Onwards (EUR Million)
- Figure 11.2 West Pharmaceuticals: Annual Revenues, FY 2022 Onwards (USD Billion)
- Figure 11.3 Eli Lilly: Annual Revenues, FY 2022 Onwards (USD Billion)
- Figure 11.4 Insulet: Annual Revenues, FY 2022 Onwards (USD Million)
- Figure 11.5 Medtronic: Annual Revenues, FY 2022 Onwards (USD Billion)
- Figure 11.6 Roche: Annual Revenues, FY 2022 Onwards (CHF Billion)
- Figure 13.1 Partnerships and Collaborations: Cumulative Year-wise Trend, Since 2015
- Figure 13.2 Partnerships and Collaborations: Distribution by Type of Partnership
- Figure 13.3 Partnerships and Collaborations: Distribution by Year and Type of Partnership, Since 2015
- Figure 13.4 Partnerships and Collaborations: Distribution by Partner
- Figure 13.5 Partnerships and Collaborations: Distribution by Year of Partnership and Type of Partner
- Figure 13.6 Partnerships and Collaborations: Distribution by Type of Device
- Figure 13.7 Most Active Players: Distribution by Number of Partnerships
- Figure 13.8 Most Active Players: Distribution by Type of Partnership
- Figure 13.9 Partnerships and Collaborations: Local and International Agreements
- Figure 13.10 Partnerships and Collaborations: Intercontinental and Intracontinental Agreements
- Figure 15.1 Patent Analysis: Distribution by Type of Patent
- Figure 15.2 Patent Analysis: Distribution by Patent Publication Year
- Figure 15.3 Patent Analysis: Distribution by Patent Application Year
- Figure 15.4 Patent Analysis: Distribution by Granted Patents and Patent Applications by Publication Year
- Figure 15.5 Patent Analysis: Distribution by Jurisdiction
- Figure 15.6 Patent Analysis: Distribution by Type of Applicant
- Figure 15.7 Patent Analysis: Distribution by CPC Symbols
- Figure 15.8 Leading Industry Players: Distribution by Number of Patents
- Figure 15.9 Leading Non-Industry Players: Distribution by Number of Patents
- Figure 15.10 Leading Individual Assignees: Distribution by Number of Patents
- Figure 15.11 Patent Benchmarking: Distribution by Patent Characteristics (CPC Symbols)
- Figure 15.12 Patent Analysis: Distribution by Patent Age
- Figure 15.13 Wearable Injectors: Patent Valuation
- Figure 17.1 Clinical Trial Analysis: Distribution by Trial Recruitment Status
- Figure 17.2 Clinical Trial Analysis: Cumulative Distribution by Trial Registration Year
- Figure 17.3 Clinical Trial Analysis: Distribution of Enrolled Patient Population by Trial Registration Year
- Figure 17.4 Clinical Trial Analysis: Distribution by Trial Phase
- Figure 17.5 Clinical Trial Analysis: Distribution of Enrolled Patient Population by Trial Phase
- Figure 17.6 Clinical Trial Analysis: Cumulative Distribution by Trial Registration Year and Trial Recruitment Status
- Figure 17.7 Clinical Trial Analysis: Distribution by Study Design
- Figure 17.8 Clinical Trial Analysis: Distribution by Type of Sponsor / Collaborator
- Figure 17.9 Clinical Trial Analysis: Distribution by Therapeutic Area
- Figure 17.10 Most Active Players: Distribution by Number of Registered Trials
- Figure 17.11 Most Popular Wearable Injectors: Distribution by Number of Registered Trials
- Figure 17.12 Clinical Trial Analysis: Geographical Distribution by Number of Clinical Trials
- Figure 17.13 Clinical Trial Analysis: Distribution of Enrolled Patient Population by Trial Recruitment Status and Geography
- Figure 18.1 Funding and Investment Analysis: Distribution of Year of Funding, Since 2014
- Figure 18.2 Funding and Investment Analysis: Distribution of Amount Invested by Year, Since 2014 (USD Million)
- Figure 18.3 Funding and Investment Analysis: Distribution by Type of Funding
- Figure 18.4 Funding and Investment Analysis: Distribution by Type of Device
- Figure 18.5 Funding and Investment Analysis: Year-wise Distribution by Type of Funding and Amount Raised (USD Million)
- Figure 18.6 Funding and Investment Analysis: Distribution by Target Disease Indication
- Figure 18.7 Most Active Players: Distribution by Number of Funding Instances
- Figure 18.8 Most Active Players: Distribution by Amount Invested
- Figure 18.9 Leading Investors: Distribution by Number of Funding Instances
- Figure 18.10 Funding and Investments: Distribution by Geography
- Figure 19.1 SWOT Factors: Harvey Ball Analysis
- Figure 20.1 CMOs: Distribution by Geography
- Figure 21.1 Key Regulatory Authorities for Medical Devices
- Figure 21.2 Medical Devices Review / Approval Process in the US
- Figure 21.3 Healthcare Insurance Coverage in the US: Distribution by Type of Coverage
- Figure 21.4 Medical Devices National Coverage Determination Process: US
- Figure 21.5 Medical Devices Review / Approval Process in Canada
- Figure 21.6 Healthcare Insurance Coverage in Canada: Distribution by Type of Coverage
- Figure 21.7 Medical Devices Review / Approval Process in Mexico
- Figure 21.8 Regulatory Bodies in EU5 Countries
- Figure 21.9 Steps involved in CE Marking Process
- Figure 21.10 Medical Devices Review / Approval Process in Europe
- Figure 21.11 Medical Devices Review / Approval Process in the UK
- Figure 21.12 Healthcare Insurance Coverage in the UK: Distribution by Type of Coverage
- Figure 21.13 Medical Devices Reimbursement Process: UK
- Figure 21.14 Healthcare Insurance Coverage in France: Distribution by Type of Coverage
- Figure 21.15 Medical Devices Reimbursement Process: France
- Figure 21.16 Healthcare Insurance Coverage in Germany: Distribution by Type of Coverage
- Figure 21.17 Medical Devices Reimbursement Process for In-Patient Setting: Germany
- Figure 21.18 Medical Devices Reimbursement Process for Out-Patient Care: Germany
- Figure 21.19 Healthcare Insurance Coverage in Italy: Distribution by Type of Coverage
- Figure 21.20 Medical Devices Reimbursement Process: Italy
- Figure 21.21 Healthcare Insurance Coverage in Spain: Distribution by Type of Coverage
- Figure 21.22 Medical Devices Reimbursement Process: Spain
- Figure 21.23 Medical Devices Review / Approval Process in Australia
- Figure 21.24 Healthcare Insurance Coverage in Australia: Distribution by Type of Coverage
- Figure 21.25 Medical Devices Review / Approval Process in Brazil
- Figure 21.26 Medical Devices Reimbursement Process: Brazil
- Figure 21.27 Medical Devices Review / Approval Process in China
- Figure 21.28 Healthcare Insurance Coverage in China: Distribution by Type of Coverage
- Figure 21.29 Medical Devices Reimbursement Process: Shanghai
- Figure 21.30 Medical Devices Review / Approval Process in India
- Figure 21.31 Healthcare Insurance Coverage in Israel: Distribution by Type of Coverage
- Figure 21.32 Medical Devices Review / Approval Process in Japan
- Figure 21.33 Medical Devices Reimbursement Process: Japan
- Figure 21.34 Healthcare Insurance Coverage in Japan: Distribution by Type of Coverage
- Figure 21.35 New Medical Devices Reimbursement Process: Japan
- Figure 21.36 Medical Devices Review / Approval Process in New Zealand
- Figure 21.37 Healthcare Insurance Coverage in New Zealand: Distribution by Type of Coverage
- Figure 21.38 Medical Devices Review / Approval Process in Singapore
- Figure 21.39 Medical Devices Review / Approval Process in South Korea
- Figure 21.40 Healthcare Insurance Coverage in South Korea: Distribution by Type of Coverage
- Figure 21.41 Medical Devices Review / Approval Process in South Africa
- Figure 21.42 Medical Devices Review / Approval Process in Taiwan
- Figure 21.43 Healthcare Insurance Coverage in Taiwan: Distribution by Type of Coverage
- Figure 21.44 Medical Devices Review / Approval Process in Thailand
- Figure 21.45 Heat Map Analysis: Comparison of Regional Regulatory Guidelines for Medical Devices
- Figure 21.46 Regulatory Control for Medical Devices: Regional Analysis by Device Risk Category
- Figure 23.1 Global Wearable Injectors Market for Non-Insulin Drugs, Historical Trends (Since 2022) and Forecasted Estimates (Till 2035) (By Value)
- Figure 23.2 Global Wearable Injectors Market for Non-Insulin Drugs, Historical Trends (Since 2022) and Forecasted Estimates (Till 2035) (By Volume)
- Figure 24.1 Wearable Injectors Market for Non-Insulin Drugs: Distribution by Type of Device (By Value)
- Figure 24.2 Wearable Patch Pump Market for Non-Insulin Drugs, Historical Trends (Since 2022) and Forecasted Estimates (Till 2035) (By Value)
- Figure 24.3 Wearable Infusion Pump Market for Non-Insulin Drugs, Historical Trends (Since 2022) and Forecasted Estimates (Till 2035) (By Value)
- Figure 24.4 Wearable Injectors Market for Non-Insulin Drugs: Distribution by Type of Device (By Volume)
- Figure 24.5 Wearable Patch Pump Market for Non-Insulin Drugs, Historical Trends (Since 2022) and Forecasted Estimates (Till 2035) (By Volume)
- Figure 24.6 Wearable Infusion Pump Market for Non-Insulin Drugs, Historical Trends (Since 2022) and Forecasted Estimates (Till 2035) (By Volume)
- Figure 25.1 Wearable Injectors Market for Non-Insulin Drugs: Distribution by Usability (By Value)
- Figure 25.2 Disposable Wearable Injectors Market for Non-Insulin Drugs, Historical Trends (Since 2022) and Forecasted Estimates (Till 2035) (By Value)
- Figure 25.3 Reusable / Disposable Components Wearable Injectors Market for Non-Insulin Drugs, Historical Trends (Since 2022) and Forecasted Estimates (Till 2035) (By Value)
- Figure 25.4 Wearable Injectors Market for Non-Insulin Drugs: Distribution by Usability (By Volume)
- Figure 25.5 Disposable Wearable Injectors Market for Non-Insulin Drugs, Historical Trends (Since 2022) and Forecasted Estimates (Till 2035) (By Volume)
- Figure 25.6 Reusable / Disposable Components Wearable Injectors Market for Non-Insulin Drugs, Historical Trends (Since 2022) and Forecasted Estimates (Till 2035) (By Volume)
- Figure 26.1 Wearable Injectors Market for Non-Insulin Drugs: Distribution by Therapeutic Area (By Value)
- Figure 26.2 Wearable Injectors Market for Non-Insulin Drugs Targeting Oncological Disorders, Historical Trends (Since 2022) and Forecasted Estimates (Till 2035) (By Value)
- Figure 26.3 Wearable Injectors Market for Non-Insulin Drugs Targeting Cardiovascular Disorders, Historical Trends (Since 2022) and Forecasted Estimates (Till 2035) (By Value)
- Figure 26.4 Wearable Injectors Market for Non-Insulin Drugs Targeting Autoimmune Disorders, Historical Trends (Since 2022) and Forecasted Estimates (Till 2035) (By Value)
- Figure 26.5 Wearable Injectors Market for Non-Insulin Drugs Targeting Neurological Disorders, Historical Trends (Since 2022) and Forecasted Estimates (Till 2035) (By Value)
- Figure 26.6 Wearable Injectors Market for Non-Insulin Drugs Targeting Other Disorders, Historical Trends (Since 2022) and Forecasted Estimates (Till 2035) (By Value)
- Figure 26.7 Wearable Injectors Market for Non-Insulin Drugs: Distribution by Therapeutic Area (By Volume)
- Figure 26.8 Wearable Injectors Market for Non-Insulin Drugs Targeting Oncological Disorders, Historical Trends (Since 2022) and Forecasted Estimates (Till 2035) (By Volume)
- Figure 26.9 Wearable Injectors Market for Non-Insulin Drugs Targeting Cardiovascular Disorders, Historical Trends (Since 2022) and Forecasted Estimates (Till 2035) (By Volume)
- Figure 26.10 Wearable Injectors Market for Non-Insulin Drugs Targeting Autoimmune Disorders, Historical Trends (Since 2022) and Forecasted Estimates (Till 2035) (By Volume)
- Figure 26.11 Wearable Injectors Market for Non-Insulin Drugs Targeting Neurological Disorders, Historical Trends (Since 2022) and Forecasted Estimates (Till 2035) (By Volume)
- Figure 26.12 Wearable Injectors Market for Non-Insulin Drugs Targeting Other Disorders, Historical Trends (Since 2022) and Forecasted Estimates (Till 2035) (By Volume)
- Figure 27.1 Wearable Injectors Market for Non-Insulin Drugs: Distribution by Geographical Regions (By Value)
- Figure 27.2 Wearable Injectors Market for Non-Insulin Drugs in North America, Historical Trends (Since 2022) and Forecasted Estimates (Till 2035) (By Value)
- Figure 27.3 Wearable Injectors Market for Non-Insulin Drugs in Europe, Historical Trends (Since 2022) and Forecasted Estimates (Till 2035) (By Value)
- Figure 27.4 Wearable Injectors Market for Non-Insulin Drugs in Asia, Historical Trends (Since 2022) and Forecasted Estimates (Till 2035) (By Value)
- Figure 27.5 Wearable Injectors Market for Non-Insulin Drugs in Latin America, Historical Trends (Since 2022) and Forecasted Estimates (Till 2035) (By Value)
- Figure 27.6 Wearable Injectors Market for Non-Insulin Drugs in Middle East and North Africa, Historical Trends (Since 2022) and Forecasted Estimates (Till 2035) (By Value)
- Figure 27.7 Wearable Injectors Market for Non-Insulin Drugs: Distribution by Geographical Regions (By Volume)
- Figure 27.8 Wearable Injectors Market for Non-Insulin Drugs in North America, Historical Trends (Since 2022) and Forecasted Estimates (Till 2035) (By Volume)
- Figure 27.9 Wearable Injectors Market for Non-Insulin Drugs in Europe, Historical Trends (Since 2022) and Forecasted Estimates (Till 2035) (By Volume)
- Figure 27.10 Wearable Injectors Market for Non-Insulin Drugs in Asia, Historical Trends (Since 2022) and Forecasted Estimates (Till 2035) (By Volume)
- Figure 27.11 Wearable Injectors Market for Non-Insulin Drugs in Latin America, Historical Trends (Since 2022) and Forecasted Estimates (Till 2035) (By Volume)
- Figure 27.12 Wearable Injectors Market for Non-Insulin Drugs in Middle East and North Africa, Historical Trends (Since 2022) and Forecasted Estimates (Till 2035) (By Volume)
- Figure 27.13 Penetration Growth (P-G) Matrix: Geographical Regions
- Figure 27.14 Market Movement Analysis: Geographical Regions
- Figure 28.1 Global Wearable Injectors Market for Insulin, Historical Trends (Since 2022) and Forecasted Estimates (Till 2035) (By Value)
- Figure 28.2 Global Wearable Injectors Market for Insulin, Historical Trends (Since 2022) and Forecasted Estimates (Till 2035) (By Volume)
- Figure 29.1 Wearable Injectors Market for Insulin: Distribution by Type of Device (By Value)
- Figure 29.2 Wearable Patch Pump Market for Insulin, Historical Trends (Since 2022) and Forecasted Estimates (Till 2035) (By Value)
- Figure 29.3 Wearable Infusion Pump Market for Insulin, Historical Trends (Since 2022) and Forecasted Estimates (Till 2035) (By Value)
- Figure 29.4 Wearable Injectors Market for Insulin: Distribution by Type of Device (By Volume)
- Figure 29.5 Wearable Patch Pump Market for Insulin, Historical Trends (Since 2022) and Forecasted Estimates (Till 2035) (By Volume)
- Figure 29.6 Wearable Infusion Pump Market for Insulin, Historical Trends (Since 2022) and Forecasted Estimates (Till 2035) (By Volume)
- Figure 30.1 Wearable Injectors Market for Insulin: Distribution by Degree of Automation (By Value)
- Figure 30.2 Automated / Smart Wearable Injectors Market for Insulin, Historical Trends (Since 2022) and Forecasted Estimates (Till 2035) (By Value)
- Figure 30.3 Manual Wearable Injectors Market for Insulin, Historical Trends (Since 2022) and Forecasted Estimates (Till 2035) (By Value)
- Figure 30.4 Wearable Injectors Market for Insulin: Distribution by Degree of Automation (By Volume)
- Figure 30.5 Automated / Smart Wearable Injectors Market for Insulin, Historical Trends (Since 2022) and Forecasted Estimates (Till 2035) (By Volume)
- Figure 30.6 Manual Wearable Injectors Market for Insulin, Historical Trends (Since 2022) and Forecasted Estimates (Till 2035) (By Volume)
- Figure 31.1 Wearable Injectors Market for Insulin: Distribution by Geographical Regions (By Value)
- Figure 31.2 Wearable Injectors Market for Insulin in North America, Historical Trends (Since 2022) and Forecasted Estimates (Till 2035) (By Value)
- Figure 31.3 Wearable Injectors Market for Insulin in the US, Historical Trends (Since 2022) and Forecasted Estimates (Till 2035) (By Value)
- Figure 31.4 Wearable Injectors Market for Insulin in Canada, Historical Trends (Since 2022) and Forecasted Estimates (Till 2035) (By Value)
- Figure 31.5 Wearable Injectors Market for Insulin in Europe, Historical Trends (Since 2022) and Forecasted Estimates (Till 2035) (By Value)
- Figure 31.6 Wearable Injectors Market for Insulin in Germany, Historical Trends (Since 2022) and Forecasted Estimates (Till 2035) (By Value)
- Figure 31.7 Wearable Injectors Market for Insulin in the UK, Historical Trends (Since 2022) and Forecasted Estimates (Till 2035) (By Value)
- Figure 31.8 Wearable Injectors Market for Insulin in Spain, Historical Trends (Since 2022) and Forecasted Estimates (Till 2035) (By Value)
- Figure 31.9 Wearable Injectors Market for Insulin in France, Historical Trends (Since 2022) and Forecasted Estimates (Till 2035) (By Value)
- Figure 31.10 Wearable Injectors Market for Insulin in Italy, Historical Trends (Since 2022) and Forecasted Estimates (Till 2035) (By Value)
- Figure 31.11 Wearable Injectors Market for Insulin in Rest of Europe, Historical Trends (Since 2022) and Forecasted Estimates (Till 2035) (By Value)
- Figure 31.12 Wearable Injectors Market for Insulin in Asia, Historical Trends (Since 2022) and Forecasted Estimates (Till 2035) (By Value)
- Figure 31.13 Wearable Injectors Market for Insulin in China, Historical Trends (Since 2022) and Forecasted Estimates (Till 2035) (By Value)
- Figure 31.14 Wearable Injectors Market for Insulin in India, Historical Trends (Since 2022) and Forecasted Estimates (Till 2035) (By Value)
- Figure 31.15 Wearable Injectors Market for Insulin in Japan, Historical Trends (Since 2022) and Forecasted Estimates (Till 2035) (By Value)
- Figure 31.16 Wearable Injectors Market for Insulin in Pakistan, Historical Trends (Since 2022) and Forecasted Estimates (Till 2035) (By Value)
- Figure 31.17 Wearable Injectors Market for Insulin in Rest of Asia, Historical Trends (Since 2022) and Forecasted Estimates (Till 2035) (By Value)
- Figure 31.18 Wearable Injectors Market for Insulin in Latin America, Historical Trends (Since 2022) and Forecasted Estimates (Till 2035) (By Value)
- Figure 31.19 Wearable Injectors Market for Insulin in Brazil, Historical Trends (Since 2022) and Forecasted Estimates (Till 2035) (By Value)
- Figure 31.20 Wearable Injectors Market for Insulin in Mexico, Historical Trends (Since 2022) and Forecasted Estimates (Till 2035) (By Value)
- Figure 31.21 Wearable Injectors Market for Insulin in Argentina, Historical Trends (Since 2022) and Forecasted Estimates (Till 2035) (By Value)
- Figure 31.22 Wearable Injectors Market for Insulin in Middle East and North Africa, Historical Trends (Since 2022) and Forecasted Estimates (Till 2035) (By Value)
- Figure 31.23 Wearable Injectors Market for Insulin in Saudi Arabia, Historical Trends (Since 2022) and Forecasted Estimates (Till 2035) (By Value)
- Figure 31.24 Wearable Injectors Market for Insulin in Israel, Historical Trends (Since 2022) and Forecasted Estimates (Till 2035) (By Value)
- Figure 31.25 Wearable Injectors Market for Insulin in Egypt, Historical Trends (Since 2022) and Forecasted Estimates (Till 2035) (By Value)
- Figure 31.26 Wearable Injectors Market for Insulin: Distribution by Geographical Regions (By Volume)
- Figure 31.27 Wearable Injectors Market for Insulin in North America, Historical Trends (Since 2022) and Forecasted Estimates (Till 2035) (By Volume)
- Figure 31.28 Wearable Injectors Market for Insulin in the US, Historical Trends (Since 2022) and Forecasted Estimates (Till 2035) (By Volume)
- Figure 31.29 Wearable Injectors Market for Insulin in Canada, Historical Trends (Since 2022) and Forecasted Estimates (Till 2035) (By Volume)
- Figure 31.30 Wearable Injectors Market for Insulin in Europe, Historical Trends (Since 2022) and Forecasted Estimates (Till 2035) (By Volume)
- Figure 31.31 Wearable Injectors Market for Insulin in Germany, Historical Trends (Since 2022) and Forecasted Estimates (Till 2035) (By Volume)
- Figure 31.32 Wearable Injectors Market for Insulin in the UK, Historical Trends (Since 2022) and Forecasted Estimates (Till 2035) (By Volume)
- Figure 31.33 Wearable Injectors Market for Insulin in Spain, Historical Trends (Since 2022) and Forecasted Estimates (Till 2035) (By Volume)
- Figure 31.34 Wearable Injectors Market for Insulin in France, Historical Trends (Since 2022) and Forecasted Estimates (Till 2035) (By Volume)
- Figure 31.35 Wearable Injectors Market for Insulin in Italy, Historical Trends (Since 2022) and Forecasted Estimates (Till 2035) (By Volume)
- Figure 31.36 Wearable Injectors Market for Insulin in Rest of Europe, Historical Trends (Since 2022) and Forecasted Estimates (Till 2035) (By Volume)
- Figure 31.37 Wearable Injectors Market for Insulin in Asia, Historical Trends (Since 2022) and Forecasted Estimates (Till 2035) (By Volume)
- Figure 31.38 Wearable Injectors Market for Insulin in China, Historical Trends (Since 2022) and Forecasted Estimates (Till 2035) (By Volume)
- Figure 31.39 Wearable Injectors Market for Insulin in India, Historical Trends (Since 2022) and Forecasted Estimates (Till 2035) (By Volume)
- Figure 31.40 Wearable Injectors Market for Insulin in Japan, Historical Trends (Since 2022) and Forecasted Estimates (Till 2035) (By Volume)
- Figure 31.41 Wearable Injectors Market for Insulin in Pakistan, Historical Trends (Since 2022) and Forecasted Estimates (Till 2035) (By Volume)
- Figure 31.42 Wearable Injectors Market for Insulin in Rest of Asia, Historical Trends (Since 2022) and Forecasted Estimates (Till 2035) (By Volume)
- Figure 31.43 Wearable Injectors Market for Insulin in Latin America, Historical Trends (Since 2022) and Forecasted Estimates (Till 2035) (By Volume)
- Figure 31.44 Wearable Injectors Market for Insulin in Brazil, Historical Trends (Since 2022) and Forecasted Estimates (Till 2035) (By Volume)
- Figure 31.45 Wearable Injectors Market for Insulin in Mexico, Historical Trends (Since 2022) and Forecasted Estimates (Till 2035) (By Volume)
- Figure 31.46 Wearable Injectors Market for Insulin in Argentina, Historical Trends (Since 2022) and Forecasted Estimates (Till 2035) (By Volume)
- Figure 31.47 Wearable Injectors Market for Insulin in Middle East and North Africa, Historical Trends (Since 2022) and Forecasted Estimates (Till 2035) (By Volume)
- Figure 31.48 Wearable Injectors Market for Insulin in Saudi Arabia, Historical Trends (Since 2022) and Forecasted Estimates (Till 2035) (By Volume)
- Figure 31.49 Wearable Injectors Market for Insulin in Israel, Historical Trends (Since 2022) and Forecasted Estimates (Till 2035) (By Volume)
- Figure 31.50 Wearable Injectors Market for Insulin in Egypt, Historical Trends (Since 2022) and Forecasted Estimates (Till 2035) (By Volume)
- Figure 31.51 Penetration Growth (P-G) Matrix: Geographical Regions
- Figure 31.52 Market Movement Analysis: Geographical Regions
- Figure 32.1 Concluding Remarks: Market Landscape of Wearable Injectors for Non-Insulin
- Figure 32.2 Concluding Remarks: Market Landscape of Drug Device Combinations
- Figure 32.3 Concluding Remarks: Market Landscape of Wearable Injectors for Insulin
- Figure 32.4 Concluding Remarks: Partnerships and Collaborations
- Figure 32.5 Concluding Remarks: Key Acquisition Targets
- Figure 32.6 Concluding Remarks: Patent Analysis
- Figure 32.7 Concluding Remarks: Likely Drug Candidates
- Figure 32.8 Concluding Remarks: Clinical Trial Analysis
- Figure 32.9 Concluding Remarks: Funding and Investment Analysis
- Figure 32.10 Concluding Remarks: Market Sizing and Opportunity Analysis for Wearable Injectors for Non-Insulin
- Figure 32.11 Concluding Remarks: Market Sizing and Opportunity Analysis for Wearable Injectors for Insulin

