
PUBLISHER: Roots Analysis | PRODUCT CODE: 1993595

PUBLISHER: Roots Analysis | PRODUCT CODE: 1993595
Japan Cell and Gene Therapy Manufacturing Market: Industry Trends and Future Forecast, Till 2035 - Distribution by Type of Therapy, Type of Scale, Type of Mode, Type of Workflow, Type of Process, Type of Technology, End User and Leading Players
Japan Cell and Gene Therapy Manufacturing Market: Overview
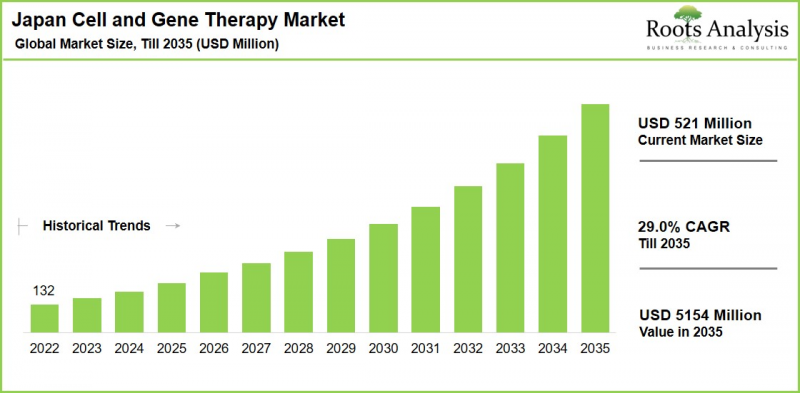
As per Roots Analysis, the Japan cell and gene therapy market is estimated to grow from USD 521 million in the current year to USD 5,154 million by 2035 at a CAGR of 29.0% during the forecast period, till 2035.
Japan Cell and Gene Therapy Manufacturing Market: Growth and Trends
Innovative treatments, including cell and gene therapies, have shown incredible promise in addressing chronic illnesses, cancer-related conditions, and rare diseases. These therapies are intricately developed to precisely target diseases at the cellular level and minimize the risk of off-target effects. Cell and gene therapy provide various benefits, including targeted responses, restoration of damaged tissues, halting or slowing inherited diseases, and enabling the treatment of specific genes that are either defective or altered.
Japan's cell and gene therapy market is experiencing robust growth, fueled by regulatory support, an aging population, and rising chronic disease prevalence. Further, Japan's regulatory framework accelerates approvals for breakthrough therapies. An aging population boosts demand for treatments targeting cancer, genetic disorders, and cardiovascular diseases, while R&D investments from government and industry propel innovation. Owing to the abovementioned developments, the Japan cell and gene therapy market is poised for notable future growth, with projections showing sustained CAGRs during the forecast period.
Growth Drivers: Strategic Enablers of Market Expansion
The market drivers for cell and gene therapy manufacturing market in Japan include advancements in biotechnology like CRISPR and CAR-T therapies enabling precise, curative treatments for previously untreatable diseases, bolstered by personalized medicine trends. In addition, the aging population in Japan heightens demand for solutions targeting cancer, degenerative disorders, and rare genetic conditions, while government initiatives accelerate approvals and R&D investments. Further, strong industry-academia collaborations enhance iPS cell workflows and clinical translation of cell and gene therapies.
Market Challenges: Critical Barriers Impeding Progress
Despite the expanding clinical pipeline, the production of cell and gene therapies encounters numerous challenges. Elevated development and manufacturing costs, coupled with complex scalability for autologous therapies, limit accessibility despite regulatory speed. Reimbursement hurdles persist for high-price therapies amid Japan's universal healthcare system, alongside needs for skilled personnel and robust infrastructure. Stringent safety requirements under Pharmaceuticals and Medical Devices Agency (PMDA) and global standardization gaps slow international pipeline adoption.
Cell Therapies: Leading Market Segment
Our estimates suggest that the production of cell therapies represents the largest market share. This dominance stems from an increasing focus on developing cell-based therapies such as CAR-T cell therapy to tackle different diseases, especially cancer. Consequently, the increasing demand for groundbreaking cell therapies is driving the most significant growth share of this sector. It is important to highlight that the gene therapies sector will demonstrate considerable growth potential and is expected to attain a greater CAGR during the forecast period. Gene therapies have shown significant results in curing and stopping disease progression, coupled with growing research on gene mutations and the evaluation of gene therapies for treating diseases
Pre-commercial / R&D Scale Manufacturing: Dominating Market Segment
Currently, the market is mainly driven by pre-commercial / R&D scale production, which accounts for almost 70% of the share. Various factors, such as an expanding pipeline of cell and gene therapies and increased investment in R&D for large-scale manufacturing, play a role in this share. It is anticipated that commercial-scale manufacturing will grow at the highest CAGR during the entire forecasting period. This is primarily due to the growing approval of cell and gene therapy products by the USFDA. With the increasing approval and accessibility of major viral vector and plasmid DNA production, a substantial rise in demand for commercial scale manufacturing is expected.
Japan Cell and Gene Therapy Manufacturing Market: Key Segments
Type of Therapy
- Cell Therapies (Stem Cell Therapy and Non-Stem Cell Therapy)
- Gene Therapies
Type of Scale
- Precommercial / R&D Scale Manufacturing
- Commercial Scale Manufacturing
Type of Mode
- Contract Manufacturing
- In-House Manufacturing
Type of Workflow
- C Cell Processing
- Cell Banking
- Process Development
- Fill & Finish Operations
- Analytical & Quality Testing
- Raw Material Testing
- Vector Production
- Other Workflow
Type of Process
- Upstream Processes
- Downstream Processes
Type of Technology
- Fluorescence-Activated Cell Sorting (FACS)
- Enzyme-Linked Immunosorbent Assay (ELISA)
- Chromatography
- Next-Generation Sequencing (NGS)
- Polymerase Chain Reaction (PCR)
- Other Technologies
End User
- Pharmaceutical Companies
- Biopharmaceutical / Biotechnological Companies
- Contract Manufacturing Organizations
Example Players in the Japan Cell and Gene Therapy Manufacturing Market
- AGC
- Astellas Pharma
- Catalent
- Charles River Laboratories
- Cytiva
- Fujifilm Cellular Dynamics
- OmniAb
- Rentschler Biopharma
- Takeda Pharmaceutical
- Thermo Fisher Scientific
- Wuxi AppTec
Key Questions Answered in this Report
- How many Japan cell and gene therapy manufacturers are currently engaged in this market?
- Which are the leading companies in this market?
- Which country dominates the Japan cell and gene therapy market?
- What are the key trends observed in the Japan cell and gene therapy market?
- What factors are likely to influence the evolution of this market?
- What are the primary challenges faced by Japan cell and gene therapy manufacturers?
- What is the current and future Japan cell and gene therapy market size?
- What is the CAGR of Japan cell and gene therapy market?
- How is the current and future market opportunity likely to be distributed across key market segments?
Reasons to Buy this Report
- The report provides a comprehensive market analysis, offering detailed revenue projections of the overall market and its specific sub-segments. This information is valuable to both established market leaders and emerging entrants.
- The report offers stakeholders a comprehensive overview of the market, including key drivers, barriers, opportunities, and challenges. This information empowers stakeholders to stay abreast of market trends and make data-driven decisions to capitalize on growth prospects.
- The report can aid businesses in identifying future opportunities in any sector. It also helps in understanding if those opportunities are worth pursuing.
- The report helps in identifying customer demand by understanding the needs, preferences, and behavior of the target audience in order to tailor products or services effectively.
- The report equips new entrants with requisite information regarding a particular market to help them build successful business strategies.
- The report allows for more effective communication with the audience and in building strong business relations.
Complementary Benefits
- Complimentary Excel Data Packs for all Analytical Modules in the Report
- 15% Free Content Customization
- Detailed Report Walkthrough Session with Research Team
- Free Updated report if the report is 6-12 months old or older
TABLE OF CONTENTS
1. PREFACE
- 1.1. Introduction
- 1.2. Market Share Insights
- 1.3. Key Market Insights
- 1.4. Report Coverage
- 1.5. Key Questions Answered
- 1.6. Chapter Outlines
2. RESEARCH METHODOLOGY
- 2.1. Chapter Overview
- 2.2. Research Assumptions
- 2.2.1. Market Landscape and Market Trends
- 2.2.2. Market Forecast and Opportunity Analysis
- 2.2.3. Comparative Analysis
- 2.3. Database Building
- 2.3.1. Data Collection
- 2.3.2. Data Validation
- 2.3.3. Data Analysis
- 2.4. Project Methodology
- 2.4.1. Secondary Research
- 2.4.1.1. Annual Reports
- 2.4.1.2. Academic Research Papers
- 2.4.1.3. Company Websites
- 2.4.1.4. Investor Presentations
- 2.4.1.5. Regulatory Filings
- 2.4.1.6. White Papers
- 2.4.1.7. Industry Publications
- 2.4.1.8. Conferences and Seminars
- 2.4.1.9. Government Portals
- 2.4.1.10. Media and Press Releases
- 2.4.1.11. Newsletters
- 2.4.1.12. Industry Databases
- 2.4.1.13. Roots Proprietary Databases
- 2.4.1.14. Paid Databases and Sources
- 2.4.1.15. Social Media Portals
- 2.4.1.16. Other Secondary Sources
- 2.4.2. Primary Research
- 2.4.2.1. Types of Primary Research
- 2.4.2.1.1. Qualitative Research
- 2.4.2.1.2. Quantitative Research
- 2.4.2.1.3. Hybrid Approach
- 2.4.2.2. Advantages of Primary Research
- 2.4.2.3. Techniques for Primary Research
- 2.4.2.3.1. Interviews
- 2.4.2.3.2. Surveys
- 2.4.2.3.3. Focus Groups
- 2.4.2.3.4. Observational Research
- 2.4.2.3.5. Social Media Interactions
- 2.4.2.4. Key Opinion Leaders Considered in Primary Research
- 2.4.2.4.1. Company Executives (CXOs)
- 2.4.2.4.2. Board of Directors
- 2.4.2.4.3. Company Presidents and Vice Presidents
- 2.4.2.4.4. Research and Development Heads
- 2.4.2.4.5. Technical Experts
- 2.4.2.4.6. Subject Matter Experts
- 2.4.2.4.7. Scientists
- 2.4.2.4.8. Doctors and Other Healthcare Providers
- 2.4.2.5. Ethics and Integrity
- 2.4.2.5.1. Research Ethics
- 2.4.2.5.2. Data Integrity
- 2.4.2.1. Types of Primary Research
- 2.4.3. Analytical Tools and Databases
- 2.4.1. Secondary Research
- 2.5. Robust Quality Control
3. MARKET DYNAMICS
- 3.1. Chapter Overview
- 3.2. Forecast Methodology
- 3.2.1. Top-down Approach
- 3.2.2. Bottom-up Approach
- 3.2.3. Hybrid Approach
- 3.3. Market Assessment Framework
- 3.3.1. Total Addressable Market (TAM)
- 3.3.2. Serviceable Addressable Market (SAM)
- 3.3.3. Serviceable Obtainable Market (SOM)
- 3.3.4. Currently Acquired Market (CAM)
- 3.4. Forecasting Tools and Techniques
- 3.4.1. Qualitative Forecasting
- 3.4.2. Correlation
- 3.4.3. Regression
- 3.4.4. Extrapolation
- 3.4.5. Convergence
- 3.4.6. Sensitivity Analysis
- 3.4.7. Scenario Planning
- 3.4.8. Data Visualization
- 3.4.9. Time Series Analysis
- 3.4.10. Forecast Error Analysis
- 3.5. Key Considerations
- 3.5.1. Demographics
- 3.5.2. Government Regulations
- 3.5.3. Reimbursement Scenarios
- 3.5.4. Market Access
- 3.5.5. Supply Chain
- 3.5.6. Industry Consolidation
- 3.5.7. Pandemic / Unforeseen Disruptions Impact
- 3.6. Limitations
4. MACRO-ECONOMIC INDICATORS
- 4.1. Chapter Overview
- 4.2. Market Dynamics
- 4.2.1. Time Period
- 4.2.1.1. Historical Trends
- 4.2.1.2. Current and Forecasted Estimates
- 4.2.2. Currency Coverage
- 4.2.2.1. Major Currencies Affecting the Market
- 4.2.2.2. Factors Affecting Currency Fluctuations on the Industry
- 4.2.2.3. Impact of Currency Fluctuations on the Industry
- 4.2.3. Foreign Currency Exchange Rate
- 4.2.3.1. Impact of Foreign Exchange Rate Volatility on the Market
- 4.2.3.2. Strategies for Mitigating Foreign Exchange Risk
- 4.2.4. Recession
- 4.2.4.1. Assessment of Current Economic Conditions and Potential Impact on the Market
- 4.2.4.2. Historical Analysis of Past Recessions and Lessons Learnt
- 4.2.5. Inflation
- 4.2.5.1. Measurement and Analysis of Inflationary Pressures in the Economy
- 4.2.5.2. Potential Impact of Inflation on the Market Evolution
- 4.2.6. Interest Rates
- 4.2.6.1. Interest Rates and Their Impact on the Market
- 4.2.6.2. Strategies for Managing Interest Rate Risk
- 4.2.7. Commodity Flow Analysis
- 4.2.7.1. Type of Commodity
- 4.2.7.2. Origins and Destinations
- 4.2.7.3. Value and Weights
- 4.2.7.4. Modes of Transportation
- 4.2.8. Global Trade Dynamics
- 4.2.8.1. Import Scenario
- 4.2.8.2. Export Scenario
- 4.2.8.3. Trade Policies
- 4.2.8.4. Strategies for Mitigating the Risks Associated with Trade Barriers
- 4.2.8.5. Impact of Trade Barriers on the Market
- 4.2.9. War Impact Analysis
- 4.2.9.1. Russian-Ukraine War
- 4.2.9.2. Israel-Hamas War
- 4.2.10. COVID Impact / Related Factors
- 4.2.10.1. Global Economic Impact
- 4.2.10.2. Industry-specific Impact
- 4.2.10.3. Government Response and Stimulus Measures
- 4.2.10.4. Future Outlook and Adaptation Strategies
- 4.2.11. Other Indicators
- 4.2.11.1. Fiscal Policy
- 4.2.11.2. Consumer Spending
- 4.2.11.3. Gross Domestic Product (GDP)
- 4.2.11.4. Employment
- 4.2.11.5. Taxes
- 4.2.11.6. Stock Market Performance
- 4.2.11.7. Cross-Border Dynamics
- 4.2.1. Time Period
- 4.3. Conclusion
5. EXECUTIVE SUMMARY
6. INTRODUCTION
- 6.1. Chapter Overview
- 6.2. Overview of Cell and Gene Therapies
- 6.3. Classification of Cell and Gene Therapies
- 6.4. Therapeutic Areas Targeted by Cell and Gene Therapies
- 6.5. Challenges in the Cell and Gene Therapy Domain
- 6.6. Recent Developments in the Cell and Gene Therapy Domain
7. MARKET LANDSCAPE
- 7.1. Chapter Overview
- 7.2. Japan Cell and Gene Therapy Manufacturing Market: Overall Market Landscape
- 7.2.1. Analysis by Year of Establishment
- 7.2.2. Analysis by Company Size
- 7.2.3. Analysis by Location of Headquarters
- 7.2.4. Analysis by Location of Manufacturing Facility
- 7.2.5. Analysis by Source of Cells
- 7.2.6. Analysis by Scale of Operation
- 7.2.6.1. Analysis by Type of Additional Service Offered
8. COMPANY PROFILES: JAPAN CELL AND GENE THERAPY MANUFACTURING MARKET
- 8.1. Chapter Overview
- 8.2. Takeda Pharmaceutical
- 8.2.1. Company Overview
- 8.2.2. Product Portfolio
- 8.2.3. Financial Information
- 8.2.4. Recent Developments and Future Outlook
- 8.3. Astellas Pharma
- 8.4. Fujifilm Cellular Dynamics
- 8.5. Cytiva
- 8.6. Rentschler Biopharma
- 8.7. Catalent
- 8.8. AGC
- 8.9. Wuxi AppTec
- 8.10. OmniAb
- 8.11. Charles River Laboratories
- 8.12. Thermo Fisher Scientific
9. PARTNERSHIPS AND COLLABORATIONS
- 9.1. Chapter Overview
- 9.2. Partnership Models
- 9.3. Japan Cell and Gene Therapy Manufacturers: Partnerships and Collaborations
- 9.3.1. Analysis by Year of Partnership
- 9.3.2. Analysis by Type of Partnership
- 9.3.3. Most Active Players: Analysis by Number of Partnerships
- 9.3.4. Analysis by Geography
- 9.3.4.1. Intercontinental and Intracontinental Agreements
- 9.3.4.2. Local and International Agreements
10. MARKET IMPACT ANALYSIS
- 10.1. Chapter Overview
- 10.2. Market Drivers
- 10.3. Market Restraints
- 10.4. Market Opportunities
- 10.5. Market Challenges
- 10.6. Conclusion
11. JAPAN CELL AND GENE THERAPY MANUFACTURING MARKET
- 11.1. Chapter Overview
- 11.2. Key Assumptions and Methodology
- 11.3. Japan Cell and Gene Therapy Manufacturing Market: Historical Trends (Since 2022) and Forecasted Estimates (Till 2035)
- 11.4. Roots Analysis Perspective on Market Growth
- 11.5 Scenario Analysis
- 11.5.1. Conservative Scenario
- 11.5.2. Optimistic Scenario
- 11.6. Key Market Segmentations
12. JAPAN CELL AND GENE THERAPY MANUFACTURING MARKET, BY TYPE OF THERAPY
- 12.1. Chapter Overview
- 12.2. Key Assumptions and Methodology
- 12.3. Japan Cell and Gene Therapy: Distribution by Type of Therapy
- 12.3.1. Cell Therapies, Historical Trends (Since 2022) and Forecasted (Till 2035)
- 12.3.2. Gene Therapies, Historical Trends (Since 2022) and Forecasted Estimates (Till 2035)
- 12.4. Data Triangulation and Validation
13. JAPAN CELL AND GENE THERAPY MANUFACTURING MARKET, BY TYPE OF SCALE
- 13.1. Chapter Overview
- 13.2. Assumptions and Methodology
- 13.3. Japan Cell and Gene Therapy Manufacturing Market: Distribution by Type of Scale
- 13.3.1. Precommercial / R&D Scale Manufacturing: Historical Trends (Since 2022) and Forecasted Estimates (Till 2035)
- 13.3.2. Commercial Scale Manufacturing: Historical Trends (Since 2022) and Forecasted Estimates (Till 2035)
- 13.4. Data Triangulation and Validation
14. JAPAN CELL AND GENE THERAPY MANUFACTURING MARKET, BY TYPE OF WORKFLOW
- 14.1. Chapter Overview
- 14.2. Assumptions and Methodology
- 14.3. Japan Cell and Gene Therapy Manufacturing Market: Distribution by Type of Offering
- 14.3.1. C Cell Processing: Historical Trends (Since 2022) and Forecasted Estimates (Till 2035)
- 14.3.2. Cell Banking: Historical Trends (Since 2022) and Forecasted Estimates (Till 2035)
- 14.3.3. Process Development: Historical Trends (Since 2022) and Forecasted Estimates (Till 2035)
- 14.3.4. Fill & Finish Operations: Historical Trends (Since 2022) and Forecasted Estimates (Till 2035)
- 14.3.5. Analytical & Quality Testing: Historical Trends (Since 2022) and Forecasted Estimates (Till 2035)
- 14.3.6. Raw Material Testing: Historical Trends (Since 2022) and Forecasted Estimates (Till 2035)
- 14.3.7. Vector Production: Historical Trends (Since 2022) and Forecasted Estimates (Till 2035)
- 14.3.8. Other Workflow: Historical Trends (Since 2022) and Forecasted Estimates (Till 2035)
- 14.4. Data Triangulation and Validation
15. JAPAN CELL AND GENE THERAPY MANUFACTURING MARKET, BY TYPE OF PROCESS
- 15.1. Chapter Overview
- 15.2. Assumptions and Methodology
- 15.3. Japan Cell and Gene Therapy Manufacturing Market: Distribution by Type of Process
- 15.3.1. Upstream Process: Historical Trends (Since 2022) and Forecasted Estimates (Till 2035)
- 15.3.2. Downstream Process: Historical Trends (Since 2022) and Forecasted Estimates (Till 2035)
- 15.4. Data Triangulation and Validation
16. JAPAN CELL AND GENE THERAPY MANUFACTURING MARKET, BY TYPE OF TECHNOLOGY
- 16.1. Chapter Overview
- 16.2. Assumptions and Methodology
- 16.3. Japan Cell and Gene Therapy Manufacturing Market: Distribution by Type of Technology
- 16.3.1. Fluorescence-Activated Cell Sorting (FACS): Historical Trends (Since 2022) and Forecasted Estimates (Till 2035)
- 16.3.2. Enzyme-Linked Immunosorbent Assay (ELISA): Historical Trends (Since 2022) and Forecasted Estimates (Till 2035)
- 16.3.3. Chromatography: Historical Trends (Since 2022) and Forecasted Estimates (Till 2035)
- 16.3.4. Next-Generation Sequencing (NGS): Historical Trends (Since 2022) and Forecasted Estimates (Till 2035)
- 16.3.5. Polymerase Chain Reaction (PCR): Historical Trends (Since 2022) and Forecasted Estimates (Till 2035)
- 16.3.6. Other Technologies: Historical Trends (Since 2022) and Forecasted Estimates (Till 2035)
- 16.4. Data Triangulation and Validation
17. JAPAN CELL AND GENE THERAPY MANUFACTURING MARKET, BY END USER
- 17.1. Chapter Overview
- 17.2. Assumptions and Methodology
- 17.3. Japan Cell and Gene Therapy Manufacturing Market: Distribution by End User
- 17.3.1. Pharmaceutical Companies: Historical Trends (Since 2022) and Forecasted Estimates (Till 2035)
- 17.3.2. Biopharmaceutical / Biotechnological Companies: Historical Trends (Since 2022) and Forecasted Estimates (Till 2035)
- 17.3.3. Contract Manufacturing Organizations: Historical Trends (Since 2022) and Forecasted Estimates (Till 2035)
- 17.4. Data Triangulation and Validation
18. CONCLUDING REMARKS
19. APPENDIX I: TABULATED DATA
20. APPENDIX II: LIST OF COMPANIES AND ORGANIZATIONS

