
PUBLISHER: Roots Analysis | PRODUCT CODE: 2029021

PUBLISHER: Roots Analysis | PRODUCT CODE: 2029021
Quantum Sensors Market, Till 2035: Distribution Type of Product, Type of Industry Served, Type of Enterprise, and Geographical Regions: Industry Trends and Global Forecasts
Quantum Sensors Market Outlook
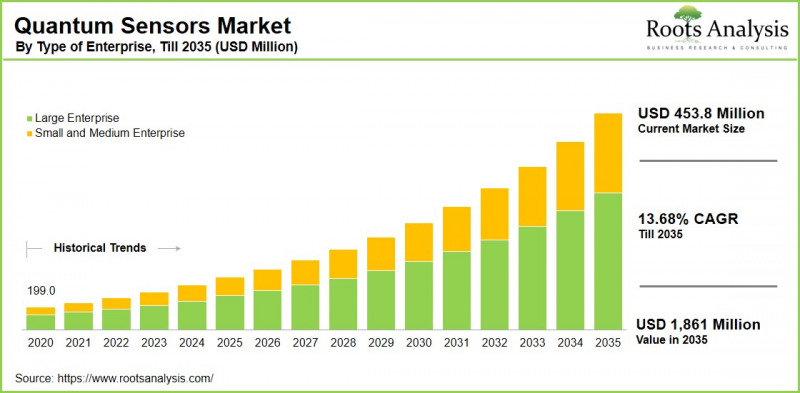
As per Roots Analysis, the global quantum sensors market size is estimated to grow from USD 453.8 million in the current year to USD 1,861 million by 2035, at a CAGR of 13.68% during the forecast period, till 2035.
Quantum sensors leverage the fundamental principles of quantum mechanics to achieve superior measurement precision and sensitivity across a wide range of applications. By utilizing different phenomena such as superposition and entanglement, these sensors can detect extremely subtle variations in physical parameters (including temperature, pressure, and magnetic fields), with remarkable accuracy. Their enhanced sensitivity and ability to function effectively in complex and demanding environments make them highly valuable across sectors such as defense, healthcare, automotive, and environmental monitoring.
The global quantum sensors market is poised for substantial growth over the forecast period, driven by rapid industrialization in emerging economies such as China and India. Moreover, the increasing integration of quantum sensors with advanced technologies, including the Internet of Things (IoT) and artificial intelligence (AI), is creating new avenues for application and innovation, thereby strengthening overall market dynamics. Complementary precision-enhancing technologies, such as adaptive optics, are further contributing to improvements in the resolution and performance of next-generation quantum sensors. The growing demand for ultra-sensitive detection systems in scientific research and secure communication applications is further expected to drive sustained market expansion.
Strategic Insights for Senior Leaders
Key Drivers Propelling Growth of Quantum Sensors Market
The quantum sensors market is being propelled by a combination of key growth drivers, including the rising demand for advanced technologies that enhance sensor performance and accuracy, as well as the expanding range of applications across sectors (such as healthcare, defense, and environmental monitoring). Increased investment in research and development, alongside growing awareness of the advantages offered by quantum sensing technologies, is further accelerating market demand. Additionally, supportive government initiatives, heightened investments, and rising disposable incomes in developing economies, are contributing significantly to the overall expansion of the market.
Quantum Sensors Market: Competitive Landscape of Companies in this Industry
The quantum sensors market is characterized by the presence of both large multinational corporations and smaller specialized manufacturers, resulting in intense competition and evolving market dynamics. Leading enterprises currently command a significant share of the market, leveraging their extensive resources and global reach to maintain a competitive advantage. Meanwhile, smaller players are focusing on product enhancement and targeting niche segments through specialized offerings and tailored solutions. Across the industry, companies are increasingly adopting strategic initiatives such as developing innovative technologies, forming alliances and partnerships to expand their portfolios, and investing in new product developments, to strengthen their competitive positioning in the market.
Role of Quantum Sensors in Advancing Environmental Monitoring
Quantum sensors are emerging as transformative technology in environmental monitoring, offering unprecedented precision and sensitivity compared to conventional sensing methods. By leveraging quantum mechanical phenomena, these sensors can detect extremely subtle environmental changes, including trace pollutants and minute variations in physical parameters. This enhanced capability enables more accurate, real-time, and non-invasive monitoring across air, water, and climate systems, supporting proactive environmental management rather than reactive responses.
Furthermore, advancements such as miniaturization and integration with technologies like artificial intelligence are enabling the development of distributed, high-resolution monitoring networks that can generate actionable insights for sustainability. However, despite their significant potential, challenges related to cost, scalability, technological maturity, and ethical considerations must be addressed to ensure widespread adoption of quantum sensing solutions.
Emerging Trends in Quantum Sensors Market
Emerging trends in the quantum sensors market include the growing emphasis on miniaturization and cost optimization, which is driving the development of chip-scale quantum sensors and significantly reducing device size and manufacturing expenses. This trend is particularly evident in technologies such as atomic clocks and magnetometers, enhancing their commercial viability and enabling broader adoption across industrial applications. Among the dominant technologies, atomic clocks and interferometers account for a substantial share of market revenue, owing to their critical role in delivering high-precision positioning, navigation, and timing (PNT) solutions for defense and telecommunications sectors.
Meanwhile, nitrogen-vacancy (NV) diamond sensors are gaining increasing traction, particularly in magnetometry applications within medical diagnostics (such as early detection of neurological disorders including Alzheimer's disease) and in material science, driven by their exceptional sensitivity and capability to operate efficiently at room temperature.
Asia Holds the Largest Share in the Quantum Sensors Market
According to our analysis, in the current year, Asia captures the highest share of the global quantum sensors market. This is driven by substantial investments in quantum technologies across multiple industries. This regional leadership is further supported by countries such as China and Taiwan, which benefit from strong research and development ecosystems, proactive government initiatives, and ongoing infrastructure development that collectively promote innovation and commercialization. Moreover, the expanding application of quantum sensors across key sectors, including healthcare and automotive, serves as a major factor contributing to the region's sustained market growth.
Key Challenges in the Quantum Sensors Market
Despite strong growth projections, the quantum sensors market faces several challenges. Key constraints include the technical complexity associated with controlling highly sensitive quantum states, elevated production costs, and competition from well-established classical sensing technologies. Furthermore, regulatory barriers and the need for effective interdisciplinary collaboration across physics, engineering, and data science domains may impede the pace of commercialization.
Quantum Sensors Market: Key Market Segmentation
By Type of Product
- Atomic Clocks
- Gravity Sensors
- Magnetic Sensors
- Photosynthetically Active Radiation (PAR)
- Quantum Sensors
By Type of Industry Served
- Agriculture
- Automotive
- Healthcare
- Military & Defense
- Oil & Gas
By Type of Enterprise
- Large Enterprise
- Small and Medium Enterprise
By Geographical Regions
- North America
- US
- Canada
- Mexico
- Other North American countries
- Europe
- Austria
- Belgium
- Denmark
- France
- Germany
- Ireland
- Italy
- Netherlands
- Norway
- Russia
- Spain
- Sweden
- Switzerland
- UK
- Other European countries
- Asia
- China
- India
- Japan
- Singapore
- South Korea
- Other Asian countries
- Latin America
- Brazil
- Chile
- Colombia
- Venezuela
- Other Latin American countries
- Middle East and North Africa Egypt
- Iran
- Iraq
- Israel
- Kuwait
- Saudi Arabia
- UAE
- Other MENA countries
- Rest of the World
- Australia
- New Zealand
- Other countries
Example Players in Quantum Sensors Market
- AOSense
- Apogee Instrument
- Biospherical Instruments
- Campbell Scientific
- GWR Instruments
- Impedance
- LI-COR
- M Squared Lasers
- Microchip Technology
- Muquans SAS
- Radix
- Robert Bosch
- Skye Instruments
- Spectrum Technologies
- Thomas Industrial Network
Quantum Sensors Market: Report Coverage
The report on the quantum sensors market features insights on various sections, including:
- Market Sizing and Opportunity Analysis: An in-depth analysis of the quantum sensors market, focusing on key market segments, including [A] type of product, [B] type of industry served, [C] type of enterprise, and [D] geographical regions.
- Competitive Landscape: A comprehensive analysis of the companies engaged in the quantum sensors market, based on several relevant parameters, such as [A] year of establishment, [B] company size, [C] location of headquarters and [D] ownership structure.
- Company Profiles: Elaborate profiles of prominent players engaged in the quantum sensors market, providing details on [A] location of headquarters, [B] company size, [C] company mission, [D] company footprint, [E] management team, [F] contact details, [G] financial information, [H] operating business segments, [I] product / technology portfolio, [J] recent developments, and an informed future outlook.
- Megatrends: An evaluation of ongoing megatrends in the quantum sensors industry.
- Patent Analysis: An insightful analysis of patents filed / granted in the quantum sensors domain, based on relevant parameters, including [A] type of patent, [B] patent publication year, [C] patent age and [D] leading players.
- Recent Developments: An overview of the recent developments made in the quantum sensors market, along with analysis based on relevant parameters, including [A] year of initiative, [B] type of initiative, [C] geographical distribution and [D] most active players.
- Porter's Five Forces Analysis: An analysis of five competitive forces prevailing in the quantum sensors market, including threats of new entrants, bargaining power of buyers, bargaining power of suppliers, threats of substitute products and rivalry among existing competitors.
- SWOT Analysis: An insightful SWOT framework, highlighting the strengths, weaknesses, opportunities and threats in the domain. Additionally, it provides Harvey ball analysis, highlighting the relative impact of each SWOT parameter.
Key Questions Answered in this Report
- What is the current and future market size?
- Who are the leading companies in this market?
- What are the growth drivers that are likely to influence the evolution of this market?
- What are the key partnership and funding trends shaping this industry?
- Which region is likely to grow at higher CAGR till 2035?
- How is the current and future market opportunity likely to be distributed across key market segments?
Reasons to Buy this Report
- Detailed Market Analysis: The report provides a comprehensive market analysis, offering detailed revenue projections of the overall market and its specific sub-segments. This information is valuable to both established market leaders and emerging entrants.
- In-depth Analysis of Trends: Stakeholders can leverage the report to gain a deeper understanding of the competitive dynamics within the market. Each report maps ecosystem activity across partnerships, funding, and patent landscapes to reveal growth hotspots and white spaces in the industry.
- Opinion of Industry Experts: The report features extensive interviews and surveys with key opinion leaders and industry experts to validate market trends mentioned in the report.
- Decision-ready Deliverables: The report offers stakeholders with strategic frameworks (Porter's Five Forces, value chain, SWOT), and complimentary Excel / slide packs with customization support.
Additional Benefits
- Complimentary Dynamic Excel Dashboards for Analytical Modules
- Exclusive 15% Free Content Customization
- Personalized Interactive Report Walkthrough with Our Expert Research Team
- Free Report Updates for Versions Older than 6-12 Months
TABLE OF CONTENTS
SECTION I: REPORT OVERVIEW
1. PREFACE
- 1.1. Introduction
- 1.2. Market Share Insights
- 1.3. Key Market Insights
- 1.4. Report Coverage
- 1.5. Key Questions Answered
- 1.6. Chapter Outlines
2. RESEARCH METHODOLOGY
- 2.1. Chapter Overview
- 2.2. Research Assumptions
- 2.3. Database Building
- 2.3.1. Data Collection
- 2.3.2. Data Validation
- 2.3.3. Data Analysis
- 2.4. Project Methodology
- 2.4.1. Secondary Research
- 2.4.1.1. Annual Reports
- 2.4.1.2. Academic Research Papers
- 2.4.1.3. Company Websites
- 2.4.1.4. Investor Presentations
- 2.4.1.5. Regulatory Filings
- 2.4.1.6. White Papers
- 2.4.1.7. Industry Publications
- 2.4.1.8. Conferences and Seminars
- 2.4.1.9. Government Portals
- 2.4.1.10. Media and Press Releases
- 2.4.1.11. Newsletters
- 2.4.1.12. Industry Databases
- 2.4.1.13. Roots Proprietary Databases
- 2.4.1.14. Paid Databases and Sources
- 2.4.1.15. Social Media Portals
- 2.4.1.16. Other Secondary Sources
- 2.4.2. Primary Research
- 2.4.2.1. Introduction
- 2.4.2.2. Types
- 2.4.2.2.1. Qualitative
- 2.4.2.2.2. Quantitative
- 2.4.2.3. Advantages
- 2.4.2.4. Techniques
- 2.4.2.4.1. Interviews
- 2.4.2.4.2. Surveys
- 2.4.2.4.3. Focus Groups
- 2.4.2.4.4. Observational Research
- 2.4.2.4.5. Social Media Interactions
- 2.4.2.5. Stakeholders
- 2.4.2.5.1. Company Executives (CXOs)
- 2.4.2.5.2. Board of Directors
- 2.4.2.5.3. Company Presidents and Vice Presidents
- 2.4.2.5.4. Key Opinion Leaders
- 2.4.2.5.5. Research and Development Heads
- 2.4.2.5.6. Technical Experts
- 2.4.2.5.7. Subject Matter Experts
- 2.4.2.5.8. Scientists
- 2.4.2.5.9. Doctors and Other Healthcare Providers
- 2.4.2.6. Ethics and Integrity
- 2.4.2.6.1. Research Ethics
- 2.4.2.6.2. Data Integrity
- 2.4.3. Analytical Tools and Databases
- 2.4.1. Secondary Research
3. MARKET DYNAMICS
- 3.1. Forecast Methodology
- 3.1.1. Top-Down Approach
- 3.1.2. Bottom-Up Approach
- 3.1.3. Hybrid Approach
- 3.2. Market Assessment Framework
- 3.2.1. Total Addressable Market (TAM)
- 3.2.2. Serviceable Addressable Market (SAM)
- 3.2.3. Serviceable Obtainable Market (SOM)
- 3.2.4. Currently Acquired Market (CAM)
- 3.3. Forecasting Tools and Techniques
- 3.3.1. Qualitative Forecasting
- 3.3.2. Correlation
- 3.3.3. Regression
- 3.3.4. Time Series Analysis
- 3.3.5. Extrapolation
- 3.3.6. Convergence
- 3.3.7. Forecast Error Analysis
- 3.3.8. Data Visualization
- 3.3.9. Scenario Planning
- 3.3.10. Sensitivity Analysis
- 3.4. Key Considerations
- 3.4.1. Demographics
- 3.4.2. Market Access
- 3.4.3. Reimbursement Scenarios
- 3.4.4. Industry Consolidation
- 3.5. Robust Quality Control
- 3.6. Key Market Segmentations
- 3.7. Limitations
4. MACRO-ECONOMIC INDICATORS
- 4.1. Chapter Overview
- 4.2. Market Dynamics
- 4.2.1. Time Period
- 4.2.1.1. Historical Trends
- 4.2.1.2. Current and Forecasted Estimates
- 4.2.2. Currency Coverage
- 4.2.2.1. Overview of Major Currencies Affecting the Market
- 4.2.2.2. Impact of Currency Fluctuations on the Industry
- 4.2.3. Foreign Exchange Impact
- 4.2.3.1. Evaluation of Foreign Exchange Rates and Their Impact on Market
- 4.2.3.2. Strategies for Mitigating Foreign Exchange Risk
- 4.2.4. Recession
- 4.2.4.1. Historical Analysis of Past Recessions and Lessons Learnt
- 4.2.4.2. Assessment of Current Economic Conditions and Potential Impact on the Market
- 4.2.5. Inflation
- 4.2.5.1. Measurement and Analysis of Inflationary Pressures in the Economy
- 4.2.5.2. Potential Impact of Inflation on the Market Evolution
- 4.2.6. Interest Rates
- 4.2.6.1. Overview of Interest Rates and Their Impact on the Market
- 4.2.6.2. Strategies for Managing Interest Rate Risk
- 4.2.7. Commodity Flow Analysis
- 4.2.7.1. Type of Commodity
- 4.2.7.2. Origins and Destinations
- 4.2.7.3. Values and Weights
- 4.2.7.4. Modes of Transportation
- 4.2.8. Global Trade Dynamics
- 4.2.8.1. Import Scenario
- 4.2.8.2. Export Scenario
- 4.2.9. War Impact Analysis
- 4.2.9.1. Russian-Ukraine War
- 4.2.9.2. Israel-Hamas War
- 4.2.10. COVID Impact / Related Factors
- 4.2.10.1. Global Economic Impact
- 4.2.10.2. Industry-specific Impact
- 4.2.10.3. Government Response and Stimulus Measures
- 4.2.10.4. Future Outlook and Adaptation Strategies
- 4.2.11. Other Indicators
- 4.2.11.1. Fiscal Policy
- 4.2.11.2. Consumer Spending
- 4.2.11.3. Gross Domestic Product (GDP)
- 4.2.11.4. Employment
- 4.2.11.5. Taxes
- 4.2.11.6. R&D Innovation
- 4.2.11.7. Stock Market Performance
- 4.2.11.8. Supply Chain
- 4.2.11.9. Cross-Border Dynamics
- 4.2.1. Time Period
SECTION II: QUALITATIVE INSIGHTS
5. EXECUTIVE SUMMARY
6. INTRODUCTION
- 6.1. Chapter Overview
- 6.2. Overview of Quantum Sensors Market
- 6.2.1. Type of Product
- 6.2.2. Type of Industry
- 6.2.3. Type of Enterprise
- 6.3. Future Perspective
7. REGULATORY SCENARIO
SECTION III: MARKET OVERVIEW
8. COMPREHENSIVE DATABASE OF LEADING PLAYERS
9. COMPETITIVE LANDSCAPE
- 9.1. Chapter Overview
- 9.2. Quantum Sensors: Overall Market Landscape
- 9.2.1. Analysis by Year of Establishment
- 9.2.2. Analysis by Company Size
- 9.2.3. Analysis by Location of Headquarters
- 9.2.4. Analysis by Ownership Structure
10. WHITE SPACE ANALYSIS
11. COMPANY COMPETITIVENESS ANALYSIS
12. STARTUP ECOSYSTEM IN THE QUANTUM SENSORS MARKET
- 12.1. Quantum Sensors Market: Market Landscape of Startups
- 12.1.1. Analysis by Year of Establishment
- 12.1.2. Analysis by Company Size
- 12.1.3. Analysis by Company Size and Year of Establishment
- 12.1.4. Analysis by Location of Headquarters
- 12.1.5. Analysis by Company Size and Location of Headquarters
- 12.1.6. Analysis by Ownership Structure
- 12.2. Key Findings
SECTION IV: COMPANY PROFILES
13. COMPANY PROFILES
- 13.1. Chapter Overview
- 13.2. AOSense*
- 13.2.1. Company Overview
- 13.2.2. Company Mission
- 13.2.3. Company Footprint
- 13.2.4. Management Team
- 13.2.5. Contact Details
- 13.2.6. Financial Performance
- 13.2.7. Operating Business Segments
- 13.2.8. Service / Product Portfolio (project specific)
- 13.2.9. MOAT Analysis
- 13.2.10. Recent Developments and Future Outlook
- 13.3. Apogee Instrument
- 13.4. Biospherical Instruments
- 13.5. Campbell Scientific
- 13.6. GWR Instruments
- 13.7. Impedance
- 13.8. LI-COR
- 13.9. M Squared Lasers
- 13.10. Microchip Technology
- 13.11. Muquans SAS
- 13.12. Radix
- 13.13. Robert Bosch
- 13.14. Skye Instruments
- 13.15. Spectrum Technologies
- 13.16. Thomas Industrial Network
SECTION V: MARKET TRENDS
14. MEGA TRENDS ANALYSIS
15. UNMET NEED ANALYSIS
16. PATENT ANALYSIS
17. RECENT DEVELOPMENTS
- 17.1. Chapter Overview
- 17.2. Recent Funding
- 17.3. Recent Partnerships
- 17.4. Other Recent Initiatives
SECTION VI: MARKET OPPORTUNITY ANALYSIS
18. GLOBAL QUANTUM SENSORS MARKET
- 18.1. Chapter Overview
- 18.2. Key Assumptions and Methodology
- 18.3. Trends Disruption Impacting Market
- 18.4. Demand Side Trends
- 18.5. Supply Side Trends
- 18.6. Global Quantum Sensors Market, Historical Trends (Since 2020) and Forecasted Estimates (Till 2035)
- 18.7. Multivariate Scenario Analysis
- 18.7.1. Conservative Scenario
- 18.7.2. Optimistic Scenario
- 18.8. Investment Feasibility Index
- 18.9. Key Market Segmentations
19. MARKET OPPORTUNITIES BASED ON TYPE OF PRODUCT
- 19.1. Chapter Overview
- 19.2. Key Assumptions and Methodology
- 19.3. Revenue Shift Analysis
- 19.4. Market Movement Analysis
- 19.5. Penetration-Growth (P-G) Matrix
- 19.6. Quantum Sensors Market for Atomic Clocks: Historical Trends (Since 2020) and Forecasted Estimates (Till 2035)
- 19.7. Quantum Sensors Market for Non-Gravity Sensors: Historical Trends (Since 2020) and Forecasted Estimates (Till 2035)
- 19.8. Quantum Sensors Market for Magnetic Sensors: Historical Trends (Since 2020) and Forecasted Estimates (Till 2035)
- 19.9. Quantum Sensors Market for Photosynthetically Active Radiation (PAR): Historical Trends (Since 2020) and Forecasted Estimates (Till 2035)
- 19.10. Quantum Sensors Market for Quantum Sensors: Historical Trends (Since 2020) and Forecasted Estimates (Till 2035)
- 19.11. Data Triangulation and Validation
- 19.11.1. Secondary Sources
- 19.11.2. Primary Sources
- 19.11.3. Statistical Modeling
20. MARKET OPPORTUNITIES BASED ON TYPE OF INDUSTRY SERVED
- 20.1. Chapter Overview
- 20.2. Key Assumptions and Methodology
- 20.3. Revenue Shift Analysis
- 20.4. Market Movement Analysis
- 20.5. Penetration-Growth (P-G) Matrix
- 20.6. Quantum Sensors Market for Active Agriculture: Historical Trends (Since 2020) and Forecasted Estimates (Till 2035)
- 20.7. Quantum Sensors Market for Automotive: Historical Trends (Since 2020) and Forecasted Estimates (Till 2035)
- 20.8. Quantum Sensors Market for Healthcare: Historical Trends (Since 2020) and Forecasted Estimates (Till 2035)
- 20.9. Quantum Sensors Market for Military & Defense: Historical Trends (Since 2020) and Forecasted Estimates (Till 2035)
- 20.10. Quantum Sensors Market for Oil & Gas: Historical Trends (Since 2020) and Forecasted Estimates (Till 2035)
- 20.11. Data Triangulation and Validation
- 20.11.1. Secondary Sources
- 20.11.2. Primary Sources
- 20.11.3. Statistical Modeling
21. MARKET OPPORTUNITIES BASED ON TYPE OF ENTERPRISE
- 21.1. Chapter Overview
- 21.2. Key Assumptions and Methodology
- 21.3. Revenue Shift Analysis
- 21.4. Market Movement Analysis
- 21.5. Penetration-Growth (P-G) Matrix
- 21.6. Quantum Sensors Market for Large Enterprise: Historical Trends (Since 2020) and Forecasted Estimates (Till 2035)
- 21.7. Quantum Sensors Market for Small and Medium Enterprise: Historical Trends (Since 2020) and Forecasted Estimates (Till 2035)
- 21.8. Data Triangulation and Validation
- 21.8.1. Secondary Sources
- 21.8.2. Primary Sources
- 21.8.3. Statistical Modeling
22. MARKET OPPORTUNITIES QUANTUM SENSORS IN NORTH AMERICA
- 22.1. Chapter Overview
- 22.2. Key Assumptions and Methodology
- 22.3. Revenue Shift Analysis
- 22.4. Market Movement Analysis
- 22.5. Penetration-Growth (P-G) Matrix
- 22.6. Quantum Sensors Market in North America: Historical Trends (Since 2020) and Forecasted Estimates (Till 2035)
- 22.6.1. Quantum Sensors Market in the US: Historical Trends (Since 2020) and Forecasted Estimates (Till 2035)
- 22.6.2. Quantum Sensors Market in Canada: Historical Trends (Since 2020) and Forecasted Estimates (Till 2035)
- 22.6.3. Quantum Sensors Market in Mexico: Historical Trends (Since 2020) and Forecasted Estimates (Till 2035)
- 22.6.4. Quantum Sensors Market in Other North American Countries: Historical Trends (Since 2020) and Forecasted Estimates (Till 2035)
- 22.7. Data Triangulation and Validation
23. MARKET OPPORTUNITIES FOR QUANTUM SENSORS IN EUROPE
- 23.1. Chapter Overview
- 23.2. Key Assumptions and Methodology
- 23.3. Revenue Shift Analysis
- 23.4. Market Movement Analysis
- 23.5. Penetration-Growth (P-G) Matrix
- 23.6. Quantum Sensors Market in Europe: Historical Trends (Since 2020) and Forecasted Estimates (Till 2035)
- 23.6.1. Quantum Sensors Market in Austria: Historical Trends (Since 2020) and Forecasted Estimates (Till 2035)
- 23.6.2. Quantum Sensors Market in Belgium: Historical Trends (Since 2020) and Forecasted Estimates (Till 2035)
- 23.6.3. Quantum Sensors Market in Denmark: Historical Trends (Since 2020) and Forecasted Estimates (Till 2035)
- 23.6.4. Quantum Sensors Market in France: Historical Trends (Since 2020) and Forecasted Estimates (Till 2035)
- 23.6.5. Quantum Sensors Market in Germany: Historical Trends (Since 2020) and Forecasted Estimates (Till 2035)
- 23.6.6. Quantum Sensors Market in Ireland: Historical Trends (Since 2020) and Forecasted Estimates (Till 2035)
- 23.6.7. Quantum Sensors Market in Italy: Historical Trends (Since 2020) and Forecasted Estimates (Till 2035)
- 23.6.8. Quantum Sensors Market in Netherlands: Historical Trends (Since 2020) and Forecasted Estimates (Till 2035)
- 23.6.9. Quantum Sensors Market in Norway: Historical Trends (Since 2020) and Forecasted Estimates (Till 2035)
- 23.6.10. Quantum Sensors Market in Russia: Historical Trends (Since 2020) and Forecasted Estimates (Till 2035)
- 23.6.11. Quantum Sensors Market in Spain: Historical Trends (Since 2020) and Forecasted Estimates (Till 2035)
- 23.6.12. Quantum Sensors Market in Sweden: Historical Trends (Since 2020) and Forecasted Estimates (Till 2035)
- 23.6.13. Quantum Sensors Market in Switzerland: Historical Trends (Since 2020) and Forecasted Estimates (Till 2035)
- 23.6.14. Quantum Sensors Market in the UK: Historical Trends (Since 2020) and Forecasted Estimates (Till 2035)
- 23.6.15. Quantum Sensors Market in Other European Countries: Historical Trends (Since 2020) and Forecasted Estimates (Till 2035)
- 23.7. Data Triangulation and Validation
24. MARKET OPPORTUNITIES FOR QUANTUM SENSORS IN ASIA
- 24.1. Chapter Overview
- 24.2. Key Assumptions and Methodology
- 24.3. Revenue Shift Analysis
- 24.4. Market Movement Analysis
- 24.5. Penetration-Growth (P-G) Matrix
- 24.6. Quantum Sensors Market in Asia: Historical Trends (Since 2020) and Forecasted Estimates (Till 2035)
- 24.6.1. Quantum Sensors Market in China: Historical Trends (Since 2020) and Forecasted Estimates (Till 2035)
- 24.6.2. Quantum Sensors Market in India: Historical Trends (Since 2020) and Forecasted Estimates (Till 2035)
- 24.6.3. Quantum Sensors Market in Japan: Historical Trends (Since 2020) and Forecasted Estimates (Till 2035)
- 24.6.4. Quantum Sensors Market in Singapore: Historical Trends (Since 2020) and Forecasted Estimates (Till 2035)
- 24.6.5. Quantum Sensors Market in South Korea: Historical Trends (Since 2020) and Forecasted Estimates (Till 2035)
- 24.6.6. Quantum Sensors Market in Other Asian Countries: Historical Trends (Since 2020) and Forecasted Estimates (Till 2035)
- 24.7. Data Triangulation and Validation
25. MARKET OPPORTUNITIES FOR QUANTUM SENSORS IN MIDDLE EAST AND NORTH AFRICA (MENA)
- 25.1. Chapter Overview
- 25.2. Key Assumptions and Methodology
- 25.3. Revenue Shift Analysis
- 25.4. Market Movement Analysis
- 25.5. Penetration-Growth (P-G) Matrix
- 25.6. Quantum Sensors Market in Middle East and North Africa (MENA): Historical Trends (Since 2020) and Forecasted Estimates (Till 2035)
- 25.6.1. Quantum Sensors Market in Egypt: Historical Trends (Since 2020) and Forecasted Estimates (Till 205)
- 25.6.2. Quantum Sensors Market in Iran: Historical Trends (Since 2020) and Forecasted Estimates (Till 2035)
- 25.6.3. Quantum Sensors Market in Iraq: Historical Trends (Since 2020) and Forecasted Estimates (Till 2035)
- 25.6.4. Quantum Sensors Market in Israel: Historical Trends (Since 2020) and Forecasted Estimates (Till 2035)
- 25.6.5. Quantum Sensors Market in Kuwait: Historical Trends (Since 2020) and Forecasted Estimates (Till 2035)
- 25.6.6. Quantum Sensors Market in Saudi Arabia: Historical Trends (Since 2020) and Forecasted Estimates (Till 2035)
- 25.6.7. Quantum Sensors Market in United Arab Emirates (UAE): Historical Trends (Since 2020) and Forecasted Estimates (Till 2035)
- 25.6.8. Quantum Sensors Market in Other MENA Countries: Historical Trends (Since 2020) and Forecasted Estimates (Till 2035)
- 25.7. Data Triangulation and Validation
26. MARKET OPPORTUNITIES FOR QUANTUM SENSORS IN LATIN AMERICA
- 26.1. Chapter Overview
- 26.2. Key Assumptions and Methodology
- 26.3. Revenue Shift Analysis
- 26.4. Market Movement Analysis
- 26.5. Penetration-Growth (P-G) Matrix
- 26.6. Quantum Sensors Market in Latin America: Historical Trends (Since 2020) and Forecasted Estimates (Till 2035)
- 26.6.1. Quantum Sensors Market in Argentina: Historical Trends (Since 2020) and Forecasted Estimates (Till 2035)
- 26.6.2. Quantum Sensors Market in Brazil: Historical Trends (Since 2020) and Forecasted Estimates (Till 2035)
- 26.6.3. Quantum Sensors Market in Chile: Historical Trends (Since 2020) and Forecasted Estimates (Till 2035)
- 26.6.4. Quantum Sensors Market in Colombia Historical Trends (Since 2020) and Forecasted Estimates (Till 2035)
- 26.6.5. Quantum Sensors Market in Venezuela: Historical Trends (Since 2020) and Forecasted Estimates (Till 2035)
- 26.6.6. Quantum Sensors Market in Other Latin American Countries: Historical Trends (Since 2020) and Forecasted Estimates (Till 2035)
- 26.7. Data Triangulation and Validation
27. MARKET OPPORTUNITIES FOR QUANTUM SENSORS IN REST OF THE WORLD
- 27.1. Chapter Overview
- 27.2. Key Assumptions and Methodology
- 27.3. Revenue Shift Analysis
- 27.4. Market Movement Analysis
- 27.5. Penetration-Growth (P-G) Matrix
- 27.6. Quantum Sensors Market in Rest of the World: Historical Trends (Since 2020) and Forecasted Estimates (Till 2035)
- 27.6.1. Quantum Sensors Market in Australia: Historical Trends (Since 2020) and Forecasted Estimates (Till 2035)
- 27.6.2. Quantum Sensors Market in New Zealand: Historical Trends (Since 2020) and Forecasted Estimates (Till 2035)
- 27.6.3. Quantum Sensors Market in Other Countries
- 27.7. Data Triangulation and Validation
28. MARKET CONCENTRATION ANALYSIS: DISTRIBUTION BY LEADING PLAYERS
29. ADJACENT MARKET ANALYSIS
SECTION VII: STRATEGIC TOOLS
30. KEY WINNING STRATEGIES
31. PORTER'S FIVE FORCES ANALYSIS
32. SWOT ANALYSIS
33. VALUE CHAIN ANALYSIS
34. ROOTS STRATEGIC RECOMMENDATIONS
- 34.1. Chapter Overview
- 34.2. Key Business-related Strategies
- 34.2.1. Research & Development
- 34.2.2. Product Manufacturing
- 34.2.3. Commercialization / Go-to-Market
- 34.2.4. Sales and Marketing
- 34.3. Key Operations-related Strategies
- 34.3.1. Risk Management
- 34.3.2. Workforce
- 34.3.3. Finance
- 34.3.4. Others
SECTION VIII: OTHER EXCLUSIVE INSIGHTS
35. INSIGHTS FROM PRIMARY RESEARCH
36. REPORT CONCLUSION
SECTION IX: APPENDIX
37. TABULATED DATA
38. LIST OF COMPANIES AND ORGANIZATIONS
39. CUSTOMIZATION OPPORTUNITIES
40. ROOTS SUBSCRIPTION SERVICES
41. AUTHOR DETAILS

