
PUBLISHER: Roots Analysis | PRODUCT CODE: 2037812

PUBLISHER: Roots Analysis | PRODUCT CODE: 2037812
mRNA Vaccine and Therapeutics Market (4th Edition) by Application Area, Target Disease Indication and Geographical Regions - Trends and Forecast, Till 2035
mRNA Vaccines and Therapeutics Market: Overview
As per Roots Analysis, the mRNA vaccines and therapeutics market is estimated to grow from USD 9 million in the current year to USD 17,036 million by 2035, at a high CAGR during the forecast period, till 2035.
mRNA Vaccines and Therapeutics Market: Growth and Trends
Messenger ribonucleic acid (mRNA) technology has transformed protein synthesis by enabling the delivery of genetic instructions from DNA to ribosomes in the form of single-stranded RNA. The adoption of mRNA-based platforms has significantly reshaped the global biomedical landscape, unlocking new therapeutic possibilities for previously untreatable conditions. Consequently, mRNA therapeutics and vaccines have emerged as a compelling alternative to traditional treatment modalities.
Following the COVID-19 pandemic, the global mRNA vaccines and therapeutics market experienced substantial growth, driven by the rapid development and successful deployment of mRNA-based vaccines. This milestone demonstrated the scalability and adaptability of mRNA technology, accelerating research activities and investment across multiple therapeutic areas. Although the market has experienced a temporary slowdown with the decline of COVID-19-related demand, it is projected to witness strong recovery post-2029, supported by expanding applications in oncology, rare diseases, and other infectious diseases.
Within this evolving landscape, the mRNA cancer vaccines and therapeutics segment has demonstrated significant progress, with an increasing number of oncology patients receiving targeted, immune-based therapies enabled by mRNA platforms. Currently, oncological applications account for approximately 25% of the overall market share, reflecting a broader industry shift toward precision-driven, immune-centric cancer treatments.
At present, five mRNA vaccine developers have achieved regulatory approval for their products, representing a key milestone in the commercialization of mRNA-based solutions across multiple disease indications. This progress is further reinforced by a robust clinical pipeline, with several mRNA vaccine and therapeutic candidates advancing into Phase III trials, supported by strong patient enrollment and comprehensive clinical evaluation.
Additionally, the expanding pipeline of mRNA developers is driving growth in the mRNA synthesis and manufacturing market, as companies increasingly seek contract development and manufacturing services to scale up production and support the commercialization of mRNA-based vaccines and therapeutics.
Growth Drivers: Strategic Enablers of Market Expansion
The mRNA vaccines and therapeutics market is undergoing dynamic expansion, propelled by the transformative success of COVID-19 vaccines developed by pioneers such as Pfizer-BioNTech and Moderna. This success highlights the platform's unparalleled advantages, including rapid design and production timelines measured in weeks rather than years, exceptional potency with fewer side effects, and remarkable adaptability to evolving pathogens or patient-specific needs.
This proof-of-concept has sparked substantial R&D investments and strategic partnerships, including government-backed initiatives, increased venture capital funding, and expanded collaborations. These developments are fueling a robust pipeline that extends beyond infectious diseases into personalized oncology, rare genetic disorders such as cystic fibrosis, autoimmune conditions, and proactive pandemic preparedness for threats like influenza, RSV, tuberculosis, and mpox. Further, advancements in delivery technologies like lipid nanoparticles (LNPs) and supportive regulatory fast-tracks further amplify growth by enabling scalable, flexible production and precision medicine applications.
Market Challenges: Critical Barriers Impeding Progress
Despite the strong growth potential in the mRNA vaccines and therapeutics market, several significant challenges continue to limit broader adoption and scalability. High manufacturing costs remain a primary barrier, driven by the complexity of production processes, the need for specialized raw materials, and intricate purification steps that require advanced facilities and skilled personnel. Additionally, the inherent instability of mRNA molecules necessitates stringent cold-chain logistics, often involving ultra-low temperature storage and transportation, which increases expenses and complicates distribution particularly in low and middle-income countries with limited infrastructure. Further, regulatory hurdles further impede progress, as evolving guidelines demand rigorous quality control, extended clinical trials, and careful evaluation of potential safety concerns, including immunogenicity and long-term effects. Public skepticism and vaccine hesitancy, fueled by misinformation regarding safety profiles and lipid nanoparticle components, can reduce uptake and slow market penetration. Together, these factors combined with occasional supply chain vulnerabilities and intellectual property issues require sustained innovation in cost reduction, formulation stability, and stakeholder engagement to fully realize the platform's therapeutic promise.
mRNA Vaccines and Therapeutics Market: Key Insights
The report delves into the current state of the mRNA vaccines and therapeutics market and identifies potential growth opportunities within industry. Some key findings from the report include:
- The current market landscape is fragmented, featuring the presence of both established players and new entrants; of these, around 40% of mRNA vaccines and therapeutics are being developed by small companies.
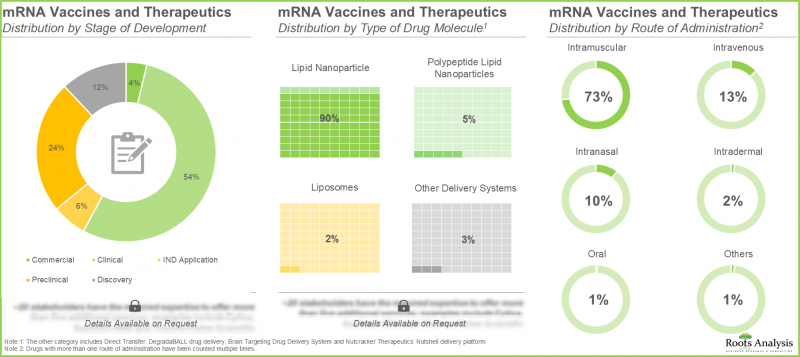
- Majority of the mRNA vaccines and therapeutics are currently evaluated under different stages of development; of these, around 55% of vaccines are in clinical phase, followed by preclinical phase (24%)
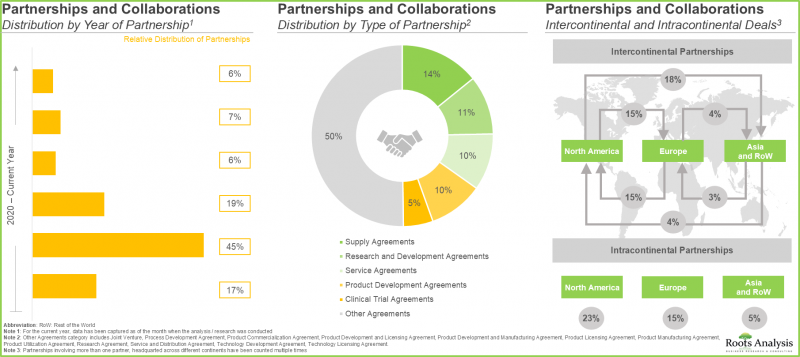
- The continuous interest of stakeholders in this domain is evident from the partnership activity; 50% of the total number of partnerships were supply agreements.
- A decent increase in the number of registered clinical trials has been observed in the recent years; majority (72%) of the trials evaluating mRNA vaccines and therapeutics have been sponsored by industry players.
- There has been a notable rise in funding and investments over the past few years; 65% of the investments assessing mRNA vaccines and therapeutics have been concentrated in North America.
- The intellectual capital is growing at a steady pace in the past few years; majority (92%) of the patents are applications, which are likely to get approval in the coming years.
- Over time, several start-ups have initiated various R&D initiatives in this domain; our proprietary start-up health indexing analysis reveals the most promising stakeholders in the industry.
- Big pharma players have undertaken several initiatives, ranging from proprietary product development to strategic investments, to tap the lucrative opportunity in this rapidly growing market.
- The mRNA vaccines and therapeutics market in North America currently captures the majority (75%) of the market owing to advanced healthcare infrastructure, rise in research activities and favorable regulatory guidelines.
mRNA Vaccines and Therapeutics Market
The market sizing and opportunity analysis has been segmented across the following parameters:
- By Application Area
- COVID-19
- Non-COVID
- By Type of Disease Indication
- RSV Infection
- Recurrent / Metastatic Head and Neck Cancer
- Influenza
- Non-Small Cell Lung Cancer
- Melanoma
- Muscle-Invasive Urothelial Carcinoma
- Norovirus Acute Gastroenteritis
- Propionic Acidemia
- Mononucleosis
- Cystic Fibrosis
- By Geographical Regions
- North America
- US
- Canada
- Europe
- UK
- Germany
- Spain
- Italy
- France
- Rest of Europe
- Asia-Pacific
- China
- Australia
- South Korea
- Japan
mRNA Vaccines and Therapeutics Market: Key Segments
The future of the mRNA vaccine and therapeutics market is expected to be dominated by non-COVID applications
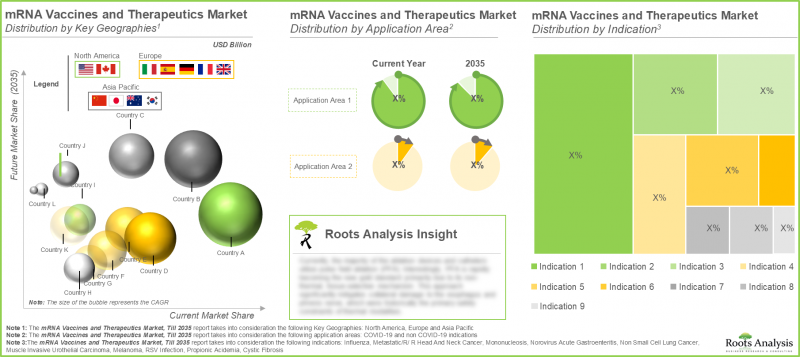
The global market is segmented into COVID-19 and non-COVID based on the application area. The COVID-19 sector holds the largest market share for the current year, according to the mRNA vaccine and therapeutics research. The enormous worldwide demand, growing approvals, growing regulatory compliance requirements, and extensive use of mRNA-based COVID-19 vaccines are the primary reasons for the market expansion. Due to increased R&D expenditures, clinical developments, and regulatory approvals for a variety of applications, including cancer immunotherapies, rare diseases, influenza, RSV, and genetic disorders, the non-COVID mRNA segment is anticipated to dominate the market in the upcoming years.
The Market Is Dominated by North America
With 75% of the total market value, North America leads the mRNA vaccines and therapies industry. This is due to strong government funding, favorable regulatory approvals, significant R&D investments by top biotech companies, and sophisticated healthcare infrastructure.
Market Trends in US for mRNA Cancer Vaccines and Therapies
Due to its advanced healthcare infrastructure, significant R&D investments by top biotech companies, strong government support from NIH grants, favorable FDA regulatory approvals, and well-established bio-manufacturing capabilities, the US leads the industry.
Primary Research Overview
Discussions with multiple stakeholders in this domain influenced the opinions and insights presented in this study. The market report includes detailed transcripts of interviews conducted with the following individuals:
- Business Development Manager, Mid-sized Organization, Australia
- Senior Director Business Development, Large Organization, Belgium
- Team Leader, Large Organization, South Korea
In addition, the market report includes transcripts of the following other third-party discussions:
- Chief Executive Officer, Large Organization, US
- President, Mid-sized Organization, Switzerland
- Medical Professional, Large-sized Organization, Germany
- Chief Executive Officer, Large-sized Organization, Italy
- Director of Advanced Drug Delivery, Mid-sized Organization, UK
- Co-founder, Large-sized Organization, Germany
- Chief Executive Officer, Mid-sized Organization, US
- Chief Executive Officer, Large Organization, US
- Deputy Director, Mid-sized Organization, US
- Co-founder and Chief Executive Officer, Mid-sized Organization, Germany
Example Players in mRNA Vaccines and Therapeutics Market
- Moderna
- BioNTech
- Providence Therapeutics
- Suzhou Abogen Biosciences
- CureVac
- RNAimmune (Subsidiary of Sirnaomics)
- Turn Biotechnologies
- Arcturus Therapeutics
- Walvax
mRNA Vaccines and Therapeutics Market: Research Coverage
- Market Sizing and Opportunity Analysis: The report features an in-depth analysis of the mRNA vaccines and therapeutics market, focusing on key market segments, including [A] application area [B] target disease indication, and [C] geographical regions.
- mRNA Vaccines and Therapeutics Market Landscape: A detailed assessment of the overall mRNA vaccine and therapeutics market landscape, along with information on several relevant parameters, such as [A] as status of development, [B] type of drug candidate, [C] type of program, [D] type of delivery system, [E] type of molecule encoded, [F] route of administration, [G] therapeutic area, [H] year of establishment, [I] company size and [J] location of headquarters.
- Company Profiles: In-depth profiles of leading players engaged in mRNA vaccine and therapeutics market based on several parameters such as [A] year of establishment, [B] location of headquarters, [C] drug portfolio, [D] recent developments and [E] an informed future outlook.
- Competitiveness Analysis: An in-depth competitiveness analysis of vaccines and therapeutics offered by mRNA developers based on their [A] developer strength, [B] product competitiveness and [C] phase of development.
- Big Pharma Initiatives: A comprehensive review of the various mRNA-focused initiatives undertaken by big pharma players, highlights mRNA vaccine and therapeutics under development along with information on [A] funding amount raised, [B] partnership activity, and [C] diversity of product portfolio.
- Start-up Health Indexing: A detailed analysis of start-ups in this domain, based on several relevant parameters, such as [A] company strength, [B] pipeline maturity, [C] pipeline strength, [D] financial support, [E] investor strength and [F] partnership activity.
- Clinical Trial Analysis: An insightful clinical trial analysis of completed / ongoing clinical trials related to mRNA vaccines and therapeutics, based on various relevant parameters, such as [A] trial registration year, [B] trial status, [C] patient gender recruited, [D] target patient population, [E] study design, [F] type of sponsor, [G] most active sponsor / collaborator and [H] geography.
- Partnerships and Collaborations: A detailed analysis of recent collaborations and partnerships within the mRNA vaccine and therapeutics industry, based on several relevant parameters, such as [A] year of partnership, [B] type of partnership, [C] therapeutic area, [D] most active players (in terms of number of deals inked) and [E] regional distribution of partnership activity that have been undertaken in this domain.
- Funding and Investment Analysis: A detailed analysis of various investments made by players in this domain based on several relevant parameters, such as [A] year of funding, [B] type of funding, [C] amount invested, [D] therapeutic area, [E] most active players (in terms of number of funding instances and amount invested) and [F] key investors (in terms of number of funding instances).
- Patent Analysis: An in-depth analysis of the various patents that have been filed / granted related to mRNA vaccine and therapeutics domain, based on several relevant parameters, such as [A] type of patent (granted patents, patent applications and others), [B] publication year, [C] geographical region, [D] CPC symbols, [E] leading industry players (in terms of the number of patents filed / granted) and [F] patent valuation.
- Case Study 1 - FDA Approval Strategies: A proprietary analysis on various competitive strategies that can be implemented by vaccine developers engaged in mRNA vaccines and therapeutics market, to expedite the FDA approval process for their proprietary vaccines. The section also includes information on several relevant parameters, such as clinical evidence, awards / grants, partnerships, intellectual properties and others.
- Case Study 2 - Outsourcing: Go / No-Go Framework: An insightful go / no-go framework analysis, highlighting various factors that needs to be considered by mRNA vaccine and therapeutics while deciding whether to manufacture their respective products in-house or engage the services of a CMO. Further, the analysis highlights all the key parameters that must be considered by players based on company size, while taking the aforementioned decision
- Market Impact Analysis: An in-depth analysis of the factors that can impact the growth of the market. It also features identification and analysis of key drivers, potential restraints, emerging opportunities, and existing challenges in this domain.
Key Questions Answered in this Report
- Which are the leading companies in the mRNA vaccines and therapeutics market?
- Which region dominates the mRNA vaccines and therapeutics market?
- What are the key trends observed in the mRNA vaccines and therapeutics market?
- What factors are likely to influence the evolution of this market?
- What are the primary challenges faced by mRNA vaccines and therapeutics developers?
- What is the current and future market size?
- What is the CAGR of this market?
- How is the current and future market opportunity likely to be distributed across key market segments?
Reasons to Buy this Report
- The report provides a comprehensive market analysis, offering detailed revenue projections of the overall market and its specific sub-segments. This information is valuable to both established market leaders and emerging entrants.
- The report offers stakeholders a comprehensive overview of the market, including key drivers, barriers, opportunities, and challenges. This information empowers stakeholders to stay abreast of market trends and make data-driven decisions to capitalize on growth prospects.
- The report can aid businesses in identifying future opportunities in any sector. It also helps in understanding if those opportunities are worth pursuing.
- The report helps in identifying customer demand by understanding the needs, preferences, and behavior of the target audience in order to tailor products or services effectively.
- The report equips new entrants with requisite information regarding a particular market to help them build successful business strategies.
- The report allows for more effective communication with the audience and in building strong business relations.
Additional Benefits
- Complimentary Excel Data Packs for all Analytical Modules in the Report
- 15% Free Content Customization
- Detailed Report Walkthrough Session with Research Team
- Free Updated report if the report is 6-12 months old or older
TABLE OF CONTENTS
1. PREFACE
- 1.1. Introduction
- 1.2. Market Share Insights
- 1.3. Key Market Insights
- 1.4. Report Coverage
- 1.5. Key Questions Answered
- 1.6. Chapter Outlines
2. RESEARCH METHODOLOGY
- 2.1. Chapter Overview
- 2.2. Research Assumptions
- 2.2.1. Market Landscape and Market Trends
- 2.2.2. Market Forecast and Opportunity Analysis
- 2.2.3. Comparative Analysis
- 2.3. Database Building
- 2.3.1. Data Collection
- 2.3.2. Data Validation
- 2.3.3. Data Analysis
- 2.4. Project Methodology
- 2.4.1. Secondary Research
- 2.4.1.1. Annual Reports
- 2.4.1.2. Academic Research Papers
- 2.4.1.3. Company Websites
- 2.4.1.4. Investor Presentations
- 2.4.1.5. Regulatory Filings
- 2.4.1.6. White Papers
- 2.4.1.7. Industry Publications
- 2.4.1.8. Conferences and Seminars
- 2.4.1.9. Government Portals
- 2.4.1.10. Media and Press Releases
- 2.4.1.11. Newsletters
- 2.4.1.12. Industry Databases
- 2.4.1.13. Roots Proprietary Databases
- 2.4.1.14. Paid Databases and Sources
- 2.4.1.15. Social Media Portals
- 2.4.1.16. Other Secondary Sources
- 2.4.2. Primary Research
- 2.4.2.1. Types of Primary Research
- 2.4.2.1.1. Qualitative Research
- 2.4.2.1.2. Quantitative Research
- 2.4.2.1.3. Hybrid Approach
- 2.4.2.2. Advantages of Primary Research
- 2.4.2.3. Techniques for Primary Research
- 2.4.2.3.1. Interviews
- 2.4.2.3.2. Surveys
- 2.4.2.3.3. Focus Groups
- 2.4.2.3.4. Observational Research
- 2.4.2.3.5. Social Media Interactions
- 2.4.2.4. Key Opinion Leaders Considered in Primary Research
- 2.4.2.4.1. Company Executives (CXOs)
- 2.4.2.4.2. Board of Directors
- 2.4.2.4.3. Company Presidents and Vice Presidents
- 2.4.2.4.4. Research and Development Heads
- 2.4.2.4.5. Technical Experts
- 2.4.2.4.6. Subject Matter Experts
- 2.4.2.4.7. Scientists
- 2.4.2.4.8. Doctors and Other Healthcare Providers
- 2.4.2.5. Ethics and Integrity
- 2.4.2.5.1. Research Ethics
- 2.4.2.5.2. Data Integrity
- 2.4.2.1. Types of Primary Research
- 2.4.3. Analytical Tools and Databases
- 2.4.1. Secondary Research
- 2.5. Robust Quality Control
3. MARKET DYNAMICS
- 3.1. Chapter Overview
- 3.2. Forecast Methodology
- 3.2.1. Top-down Approach
- 3.2.2. Bottom-up Approach
- 3.2.3. Hybrid Approach
- 3.3. Market Assessment Framework
- 3.3.1. Total Addressable Market (TAM)
- 3.3.2. Serviceable Addressable Market (SAM)
- 3.3.3. Serviceable Obtainable Market (SOM)
- 3.3.4. Currently Acquired Market (CAM)
- 3.4. Forecasting Tools and Techniques
- 3.4.1. Qualitative Forecasting
- 3.4.2. Correlation
- 3.4.3. Regression
- 3.4.4. Extrapolation
- 3.4.5. Convergence
- 3.4.6. Sensitivity Analysis
- 3.4.7. Scenario Planning
- 3.4.8. Data Visualization
- 3.4.9. Time Series Analysis
- 3.4.10. Forecast Error Analysis
- 3.5. Key Considerations
- 3.5.1. Demographics
- 3.5.2. Government Regulations
- 3.5.3. Reimbursement Scenarios
- 3.5.4. Market Access
- 3.5.5. Supply Chain
- 3.5.6. Industry Consolidation
- 3.5.7. Pandemic / Unforeseen Disruptions Impact
- 3.6. Limitations
4. MACRO-ECONOMIC INDICATORS
- 4.1. Chapter Overview
- 4.2. Market Dynamics
- 4.2.1. Time Period
- 4.2.1.1. Historical Trends
- 4.2.1.2. Current and Forecasted Estimates
- 4.2.2. Currency Coverage
- 4.2.2.1. Major Currencies Affecting the Market
- 4.2.2.2. Factors Affecting Currency Fluctuations on the Industry
- 4.2.2.3. Impact of Currency Fluctuations on the Industry
- 4.2.3. Foreign Currency Exchange Rate
- 4.2.3.1. Impact of Foreign Exchange Rate Volatility on the Market
- 4.2.3.2. Strategies for Mitigating Foreign Exchange Risk
- 4.2.4. Recession
- 4.2.4.1. Assessment of Current Economic Conditions and Potential Impact on the Market
- 4.2.4.2. Historical Analysis of Past Recessions and Lessons Learnt
- 4.2.5. Inflation
- 4.2.5.1. Measurement and Analysis of Inflationary Pressures in the Economy
- 4.2.5.2. Potential Impact of Inflation on Market Evolution
- 4.2.6. Interest Rates
- 4.2.6.1. Interest Rates and Their Impact on the Market
- 4.2.6.2. Strategies for Managing Interest Rate Risk
- 4.2.7. Commodity Flow Analysis
- 4.2.7.1. Type of Commodity
- 4.2.7.2. Origins and Destinations
- 4.2.7.3. Values and Weights
- 4.2.7.4. Modes of Transportation
- 4.2.8. Global Trade Dynamics
- 4.2.8.1. Import Scenario
- 4.2.8.2. Export Scenario
- 4.2.8.3. Trade Policies
- 4.2.8.4. Strategies for Mitigating the Risks Associated with Trade Barriers
- 4.2.8.5. Impact of Trade Barriers on the Market
- 4.2.9. War Impact Analysis
- 4.2.9.1. Russian-Ukraine War
- 4.2.9.2. Israel-Hamas War
- 4.2.10. COVID Impact / Related Factors
- 4.2.10.1. Global Economic Impact
- 4.2.10.2. Industry-specific Impact
- 4.2.10.3. Government Response and Stimulus Measures
- 4.2.10.4. Future Outlook and Adaptation Strategies
- 4.2.11. Other Indicators
- 4.2.11.1. Fiscal Policy
- 4.2.11.2. Consumer Spending
- 4.2.11.3. Gross Domestic Product
- 4.2.11.4. Employment
- 4.2.11.5. Taxes
- 4.2.11.6. Stock Market Performance
- 4.2.11.7. Cross Border Dynamics
- 4.2.1. Time Period
- 4.3. Conclusion
5. EXECUTIVE SUMMARY
- 5.1. Executive Summary: Market Landscape
- 5.2. Executive Summary: Market Trends
- 5.3. Executive Summary: Market Forecast and Opportunity Analysis
6. INTRODUCTION
- 6.1. Chapter Overview
- 6.2. mRNA Therapeutics
- 6.2.1. Advantages of mRNA Therapeutics
- 6.2.2. Key Applications of mRNA Therapeutics
- 6.3. mRNA Vaccines
- 6.3.1. Advantages of mRNA Vaccines
- 6.3.2. Key Applications of mRNA Vaccines
- 6.4. mRNA Delivery Routes
- 6.5. mRNA Delivery Strategies
- 6.6. Key Challenges Associated with mRNA Vaccines and Therapeutics
- 6.7. Future Perspectives
7. MARKET LANDSCAPE
- 7.1. Chapter Overview
- 7.2. mRNA Vaccines and Therapeutics: Overall Market Landscape
- 7.2.1. Analysis by Status of Development
- 7.2.2. Analysis by Type of Drug Candidate
- 7.2.3. Analysis by Type of Program
- 7.2.4. Analysis by Type of Delivery System
- 7.2.5. Analysis by Type of Molecule Encoded
- 7.2.6. Analysis by Route of Administration
- 7.3.7. Analysis by Therapeutic Area
- 7.3. mRNA Vaccines and Therapeutics: Developer Landscape
- 7.3.1. Analysis by Year of Establishment
- 7.3.2. Analysis by Company Size
- 7.3.3. Analysis by Location of Headquarters
- 7.3.4. Most Active Developers: Analysis by Number of Drugs Developed
8. PRODUCT COMPETITIVENESS ANALYSIS
- 8.1. Chapter Overview
- 8.2. Assumptions and Key Parameters
- 8.3. Methodology
- 8.4. mRNA Vaccines and Therapeutics: Product Competitiveness Analysis
- 8.4.1. mRNA Vaccines and Therapeutics Developed by Players based in North America
- 8.4.2. mRNA Vaccines and Therapeutics Developed by Players based in Europe
- 8.4.3. mRNA Vaccines and Therapeutics Developed by Players based in Asia-Pacific and Rest of the World
9. SMALL MOLECULES ASEPTIC FILL FINISH SERVICE PROVIDERS LANDSCAPE
9. COMPANY PROFILES: mRNA VACCINES AND THERAPEUTICS DEVELOPERS BASED IN NORTH AMERICA
- 9.1. Chapter Overview
- 9.2. Leading Developers in mRNA Vaccines and Therapeutics Market based in North America
- 9.2.1. Arcturus Therapeutics
- 9.2.1.1. Company Overview
- 9.2.1.2 Financial Information
- 9.2.1.3. mRNA Vaccines and Therapeutics Portfolio
- 9.2.1.4. Recent Developments and Future Outlook
- 9.2.2. Immorna
- 9.2.2.1. Company Overview
- 9.2.2.2. mRNA Vaccines and Therapeutics Portfolio
- 9.2.2.3. Recent Developments and Future Outlook
- 9.2.3. Moderna
- 9.2.3.1. Company Overview
- 9.2.3.2 Financial Information
- 9.2.3.3. mRNA Vaccines and Therapeutics Portfolio
- 9.2.3.4. Recent Developments and Future Outlook
- 9.2.4. Providence Therapeutics
- 9.2.4.1. Company Overview
- 9.2.4.2 Financial Information
- 9.2.4.3. mRNA Vaccines and Therapeutics Portfolio
- 9.2.4.4. Recent Developments and Future Outlook
- 9.2.5. Innovac Therapeutics
- 9.2.5.1. Company Overview
- 9.2.5.2. mRNA Vaccines and Therapeutics Portfolio
- 9.2.5.3. Recent Developments and Future Outlook
- 9.2.6. Kernal Biologics
- 9.2.6.1. Company Overview
- 9.2.6.2. Financial Information
- 9.2.6.3. mRNA Vaccines and Therapeutics Portfolio
- 9.2.6.4. Recent Developments and Future Outlook
- 9.2.7. Recode Therapeutics
- 9.2.7.1. Company Overview
- 9.2.7.2. Financial Information
- 9.2.7.3. mRNA Vaccines and Therapeutics Portfolio
- 9.2.7.4. Recent Developments and Future Outlook
- 9.2.8. Rejuvenation Technologies
- 9.2.8.1. Company Overview
- 9.2.8.2. Financial Information
- 9.2.8.3. mRNA Vaccines and Therapeutics Portfolio
- 9.2.8.4. Recent Developments and Future Outlook
- 9.2.9. RNAimmune
- 9.2.9.1. Company Overview
- 9.2.9.2. Financial Information
- 9.2.9.3. mRNA Vaccines and Therapeutics Portfolio
- 9.2.9.4. Recent Developments and Future Outlook
- 9.2.10. Turn Biotechnologies
- 9.2.10.1. Company Overview
- 9.2.10.2. Financial Information
- 9.2.10.3. mRNA Vaccines and Therapeutics Portfolio
- 9.2.10.4. Recent Developments and Future Outlook
- 9.2.11. Strand Therapeutics
- 9.2.11.1. Company Overview
- 9.2.11.2. Financial Information
- 9.2.11.3. mRNA Vaccines and Therapeutics Portfolio
- 9.2.11.4. Recent Developments and Future Outlook
- 9.2.1. Arcturus Therapeutics
10. COMPANY PROFILES: mRNA VACCINES AND THERAPEUTICS DEVELOPERS BASED IN EUROPE
- 10.1. Chapter Overview
- 10.2. Leading Developers in mRNA Vaccines and Therapeutics Market based in North America
- 10.2.1. BioNTech
- 10.2.1.1. Company Overview
- 10.2.1.2. Financial Information
- 10.2.1.3. mRNA Vaccines and Therapeutics Portfolio
- 10.2.1.4. Recent Developments and Future Outlook
- 10.2.2. CureVac
- 10.2.2.1. Company Overview
- 10.2.2.2. Financial Information
- 10.2.2.3. mRNA Vaccines and Therapeutics Portfolio
- 10.2.2.4. Recent Developments and Future Outlook
- 10.2.3. Ethris
- 10.2.3.1. Company Overview
- 10.2.3.2. mRNA Vaccines and Therapeutics Portfolio
- 10.2.3.3. Recent Developments and Future Outlook
- 10.2.1. BioNTech
11. COMPANY PROFILES: mRNA VACCINES AND THERAPEUTICS DEVELOPERS BASED IN ASIA PACIFIC
- 11.1. Chapter Overview
- 11.2. Leading Developers in mRNA Vaccines and Therapeutics Market based in North America
- 11.2.1. Suzhou Abogen Biosciences
- 11.2.1.1. Company Overview
- 11.2.1.2. mRNA Vaccines and Therapeutics Portfolio
- 11.2.1.3. Recent Developments and Future Outlook
- 11.2.2. Gennova Biopharmaceuticals
- 11.2.2.1. Company Overview
- 11.2.2.2. Financial Information
- 11.2.2.3. mRNA Vaccines and Therapeutics Portfolio
- 11.2.2.4. Recent Developments and Future Outlook
- 11.2.3. RNACure
- 11.2.3.1. Company Overview
- 11.2.3.2. mRNA Vaccines and Therapeutics Portfolio
- 11.2.3.3. Recent Developments and Future Outlook
- 11.2.4. Walvax
- 11.2.4.1. Company Overview
- 11.2.4.2. Financial Information
- 11.2.4.3. mRNA Vaccines and Therapeutics Portfolio
- 11.2.4.4. Recent Developments and Future Outlook
- 11.2.1. Suzhou Abogen Biosciences
12. BIG PHARMA INITIATIVES
- 12.1. Chapter Overview
- 12.2. Scope and Methodology
- 12.3. mRNA Vaccines and Therapeutics Market: Big Player Initiatives
- 12.3.1. Analysis by Year of Initiative
- 12.3.2. Analysis by Type of Initiative
- 12.3.3. Analysis by Year and Type of Initiative
- 12.3.4. Analysis by Type of Partnership
- 12.3.5. Analysis by Type of Expansion
- 12.3.6. Analysis by Year of Initiative and Company
- 12.3.7. Big Pharma Players: Analysis by Number of Initiatives
- 12.4. Benchmarking Analysis: Big Pharma Players
- 12.4.1. Spider Web Analysis: Bayer
- 12.4.2. Spider Web Analysis: Pfizer
- 12.4.3. Spider Web Analysis: Sanofi
- 12.5. Concluding Remarks
13. START-UP HEALTH INDEXING
- 13.1. Chapter Overview
- 13.2. Start-ups focused on mRNA Vaccines and Therapeutics
- 13.3. Benchmarking of Start-ups
- 13.4. Startup-Health Indexing
- 13.4.1. Analysis by Location of Headquarters
- 13.4.2. Analysis by Company Strength
- 13.4.3. Analysis by Pipeline Maturity
- 13.4.4. Analysis by Pipeline Strength
- 13.4.5. Analysis by Financial Support
- 13.4.6. Analysis by Investor Strength
- 13.4.7. Analysis by Partnership Activity
- 13.4.8. Start-ups Health Indexing: Roots Analysis Perspective
14. CLINICAL TRIAL ANALYSIS
- 14.1. Chapter Overview
- 14.2. Scope and Methodology
- 14.3. mRNA Vaccines and Therapeutics: Clinical Trial Analysis
- 14.3.1. Analysis by Trial Registration Year
- 14.3.2. Analysis of Number of Patients Enrolled by Trial Registration Year
- 14.3.3. Analysis by Trial Phase
- 14.3.4. Analysis of Number of Patients Enrolled by Trial Phase
- 14.3.5. Analysis by Trial Status
- 14.3.6. Analysis by Trial Registration Year and Trial Status
- 14.3.7. Analysis by Patient Gender
- 14.3.8. Analysis by Study Design
- 14.3.8.1. Analysis by Type of Allocation
- 14.3.8.2. Analysis by Type of Intervention Model
- 14.3.8.3. Analysis by Type of Masking
- 14.3.8.4. Analysis by Trial Purpose
- 14.3.9. Analysis by Type of Sponsor / Collaborator
- 14.3.10. Analysis by Geography
- 14.3.10.1. Analysis of Clinical Trials by Geography
- 14.3.10.2. Analysis of Clinical Trials by Geography and Trial Status
- 14.3.10.3. Analysis of Patients Enrolled by Geography and Trial Status
15. PARTNERSHIPS AND COLLABORATIONS
- 15.1. Chapter Overview
- 15.2. Partnership Models
- 15.3. mRNA Vaccines and Therapeutics Market: Partnerships and Collaborations
- 15.3.1. Analysis by Year of Partnership
- 15.3.2. Analysis by Type of Partnership
- 15.3.3. Analysis by Year and Type of Partnership
- 15.3.4. Analysis by Therapeutic Area
- 15.3.5. Most Active Players: Analysis by Number of Partnerships
- 15.3.6. Analysis by Geography
- 15.3.6.1. Intercontinental and Intracontinental Agreements
- 15.3.6.2. Local and International Agreements
16. FUNDING AND INVESTMENTS
- 16.1. Chapter Overview
- 16.2. Funding Models
- 16.3. mRNA Vaccines and Therapeutics Market: Funding and Investment Analysis
- 16.3.1. Analysis by Year of Funding
- 16.3.1.1. Cumulative Year-wise Trend of Funding Instances
- 16.3.1.2. Cumulative Year-wise Trend of Amount Invested
- 16.3.2. Analysis by Type of Funding
- 16.3.2.1. Analysis of Funding Instances
- 16.3.2.2. Analysis of Amount Invested
- 16.3.3. Analysis by Year and Type of Funding
- 16.3.4. Analysis by Amount Raised by Year and Type of Funding
- 16.3.5. Analysis by Therapeutic Area
- 16.3.6. Most Active Players: Analysis by Number of Funding Instances
- 16.3.7. Most Active Players: Analysis by Amount Raised
- 16.3.8. Analysis by Geography
- 16.3.9. Most Active Players: Analysis by Number of Funding Instances
- 16.3.10. Most Active Players: Analysis by Amount Invested
- 16.3.1. Analysis by Year of Funding
- 16.4. Summary of Funding and Investments
17. PATENT ANALYSIS
- 17.1. Chapter Overview
- 17.2. Scope and Methodology
- 17.3. mRNA Vaccines and Therapeutics: Patent Analysis
- 17.3.1. Analysis by Type of Patent
- 17.3.2. Analysis by Patent Publication Year
- 17.3.3. Analysis by Type of Patent and Publication Year
- 17.3.4. Analysis by Patent Application Year
- 17.3.5. Analysis by Patent Jurisdiction
- 17.3.6. Analysis by CPC Symbols
- 17.3.7. Analysis by Type of Applicant
- 17.3.8. Leading Industry Players: Analysis by Number of Patents
- 17.3.9. Leading Non-Industry Players: Analysis by Number of Patents
- 17.3.10. Leading Inventors: Analysis by Number of Patents
- 17.4. Patent Benchmarking Analysis
- 17.4.1. Analysis of Patent Characteristics
- 17.5. Patent Valuation
- 17.6. Leading Patents by Number of Citations
18. FDA APPROVAL STRATEGIES
- 18.1. Chapter Overview
- 18.2. Methodology
- 18.3. Key Parameters
- 18.4. General Reasons for Failure of Trials Focused on mRNA Vaccines and Therapeutics
- 18.5. Benchmarking Analysis: Distribution of Key Strategies by mRNA Vaccines and Therapeutics
19. OUTSOURCING: GO / NO-GO FRAMEWORK
- 19.1. Chapter Overview
- 19.2. Outsourcing: Go / No-Go Framework
- 19.3. mRNA Vaccines and Therapeutics Outsourcing: Go / No-Go Framework
- 19.3.1. Key Parameters and Assumptions
- 19.3.2. Methodology
- 19.3.3. Results and Interpretations
- 19.3.3.1. Outsourcing: Go / No-Go Framework for Small Companies
- 19.3.3.2. Outsourcing: Go / No-Go Framework for Mid-Sized Companies
- 19.3.3.3. Outsourcing: Go / No-Go Framework for Large Companies
20. MARKET IMPACT ANALYSIS
- 20.1. Chapter Overview
- 20.2. Market Drivers
- 20.3. Market Restraints
- 20.4. Market Opportunities
- 20.5. Market Challenges
- 20.6. Conclusion
21. GLOBAL mRNA VACCINES AND THERAPEUTICS MARKET
- 21.1. Chapter Overview
- 21.2. Assumptions and Methodology
- 21.3. Global mRNA Vaccines and Therapeutics Market, Historical Trends (Since 2020) and Forecasted Estimates (Till 2035)
- 21.3.1. Scenario Analysis
- 21.3.1.1. Conservative Scenario
- 21.3.1.2. Optimistic Scenario
- 21.3.1. Scenario Analysis
- 21.4. Key Market Segmentations
22. mRNA VACCINES AND THERAPEUTICS MARKET, BY APPLICATION AREA
- 22.1. Chapter Overview
- 22.2. Key Assumptions and Methodology
- 22.3. mRNA Vaccines and Therapeutics Market: Distribution by Application Area
- 22.3.1. mRNA Vaccines and Therapeutics Market for COVID-19, Historical Trends (Since 2020) and Forecasted Estimates (Till 2035)
- 22.3.2. mRNA Vaccines and Therapeutics Market for Other Indications, Historical Trends (Since 2020) and Forecasted Estimates (Till 2035)
- 22.4. Data Triangulation and Validation
23. mRNA VACCINES AND THERAPEUTICS MARKET, BY TARGET DISEASE INDICATION
- 23.1. Chapter Overview
- 23.2. Key Assumptions and Methodology
- 23.3. mRNA Vaccines and Therapeutics Market: Distribution by Target Disease Indication
- 23.3.1. mRNA Vaccines and Therapeutics Market for Cystic Fibrosis, Historical Trends (Since 2020) and Forecasted Estimates (Till 2035)
- 23.3.2. mRNA Vaccines and Therapeutics Market for Influenza, Historical Trends (Since 2020) and Forecasted Estimates (Till 2035)
- 23.3.3. mRNA Vaccines and Therapeutics Market for Melanoma, Historical Trends (Since 2020) and Forecasted Estimates (Till 2035)
- 23.3.4. mRNA Vaccines and Therapeutics Market for Metastatic/ R/R Head and Neck cancer, Historical Trends (Since 2020) and Forecasted Estimates (Till 2035)
- 23.3.5. mRNA Vaccines and Therapeutics Market for Mononucleosis, Historical Trends (Since 2020) and Forecasted Estimates (Till 2035)
- 23.3.6. mRNA Vaccines and Therapeutics Market for Muscle-Invasive Urothelial Carcinoma, Historical Trends (Since 2020) and Forecasted Estimates (Till 2035)
- 23.3.7. mRNA Vaccines and Therapeutics Market for Non-Small Cell Lung Cancer, Historical Trends (Since 2020) and Forecasted Estimates (Till 2035)
- 23.3.8. mRNA Vaccines and Therapeutics Market for Norovirus Acute Gastroenteritis, Historical Trends (Since 2020) and Forecasted Estimates (Till 2035)
- 23.3.9. mRNA Vaccines and Therapeutics Market for Propionic Acidemia, Historical Trends (Since 2020) and Forecasted Estimates (Till 2035)
- 23.3.10. mRNA Vaccines and Therapeutics Market for RSV Infection, Historical Trends (Since 2020) and Forecasted Estimates (Till 2035)
- 23.4. Data Triangulation and Validation
24. mRNA VACCINES AND THERAPEUTICS MARKET, BY GEOGRAPHICAL REGIONS
- 24.1. Chapter Overview
- 24.2. Key Assumptions and Methodology
- 24.3. mRNA Vaccines and Therapeutics Market: Distribution by Geographical Regions
- 24.3.1. mRNA Vaccines and Therapeutics Market in North America, Historical Trends (Since 2020) and Forecasted Estimates (Till 2035)
- 24.3.1.1. mRNA Vaccines and Therapeutics Market in the US, Historical Trends (Since 2020) and Forecasted Estimates (Till 2035)
- 24.3.1.2. mRNA Vaccines and Therapeutics Market in Canada, Historical Trends (Since 2020) and Forecasted Estimates (Till 2035)
- 24.3.2. mRNA Vaccines and Therapeutics Market in Europe, Historical Trends (Since 2020) and Forecasted Estimates (Till 2035)
- 24.3.2.1. mRNA Vaccines and Therapeutics Market in UK, Historical Trends (Since 2020) and Forecasted Estimates (Till 2035)
- 24.3.2.2. mRNA Vaccines and Therapeutics Market in the Germany, Historical Trends (Since 2020) and Forecasted Estimates (Till 2035)
- 24.3.2.3. mRNA Vaccines and Therapeutics Market in Spain, Historical Trends (Since 2020) and Forecasted Estimates (Till 2035)
- 24.3.2.4. mRNA Vaccines and Therapeutics Market in Italy, Historical Trends (Since 2020) and Forecasted Estimates (Till 2035)
- 24.3.2.5. mRNA Vaccines and Therapeutics Market in France, Historical Trends (Since 2020) and Forecasted Estimates (Till 2035)
- 24.3.2.6. mRNA Vaccines and Therapeutics Market in Rest of Europe, Historical Trends (Since 2020) and Forecasted Estimates (Till 2035)
- 24.3.3. mRNA Vaccines and Therapeutics Market in Asia-Pacific, Historical Trends (Since 2020) and Forecasted Estimates (Till 2035)
- 24.3.3.1. mRNA Vaccines and Therapeutics Market in China, Historical Trends (Since 2020) and Forecasted Estimates (Till 2035)
- 24.3.3.2. mRNA Vaccines and Therapeutics Market in India, Historical Trends (Since 2020) and Forecasted Estimates (Till 2035)
- 24.3.3.3. mRNA Vaccines and Therapeutics Market in Japan, Historical Trends (Since 2020) and Forecasted Estimates (Till 2035)
- 24.3.3.4. mRNA Vaccines and Therapeutics Market in Australia, Historical Trends (Since 2020) and Forecasted Estimates (Till 2035)
- 24.3.6. Penetration Growth (P-G) Matrix
- 24.3.7. Market Movement Analysis
- 24.3.1. mRNA Vaccines and Therapeutics Market in North America, Historical Trends (Since 2020) and Forecasted Estimates (Till 2035)
- 24.4. Data Triangulation and Validation
25. MARKET OPPORTUNITY ANALYSIS: NORTH AMERICA
- 25.1. mRNA Vaccines and Therapeutics Market in North America: Distribution by Application Area
- 25.1.1 mRNA Vaccines and Therapeutics Market in North America for COVID-19, Historical Trends (Since 2020) and Forecasted Estimates (Till 2035)
- 25.1.2. mRNA Vaccines and Therapeutics Market in North America for Other Indications, Historical Trends (Since 2020) and Forecasted Estimates (Till 2035)
- 25.2. mRNA Vaccines and Therapeutics Market in North America: Distribution by Target Disease Indication
- 25.2.1. mRNA Vaccines and Therapeutics Market in North America for Cystic Fibrosis, Historical Trends (Since 2020) and Forecasted Estimates (Till 2035)
- 25.2.2. mRNA Vaccines and Therapeutics Market in North America for Influenza, Historical Trends (Since 2020) and Forecasted Estimates (Till 2035)
- 25.2.3. mRNA Vaccines and Therapeutics Market in North America for Melanoma, Historical Trends (Since 2020) and Forecasted Estimates (Till 2035)
- 25.2.4. mRNA Vaccines and Therapeutics Market in North America for Metastatic/ R/R Head and Neck cancer, Historical Trends (Since 2020) and Forecasted Estimates (Till 2035)
- 25.2.5. mRNA Vaccines and Therapeutics Market in North America for Mononucleosis, Historical Trends (Since 2020) and Forecasted Estimates (Till 2035)
- 25.2.6. mRNA Vaccines and Therapeutics Market in North America for Muscle-Invasive Urothelial Carcinoma, Historical Trends (Since 2020) and Forecasted Estimates (Till 2035)
- 25.2.7. mRNA Vaccines and Therapeutics Market in North America for Non-Small Cell Lung Cancer, Historical Trends (Since 2020) and Forecasted Estimates (Till 2035)
- 25.2.8. mRNA Vaccines and Therapeutics Market in North America for Norovirus Acute Gastroenteritis, Historical Trends (Since 2020) and Forecasted Estimates (Till 2035)
- 25.2.9. mRNA Vaccines and Therapeutics Market in North America for Propionic Acidemia, Historical Trends (Since 2020) and Forecasted Estimates (Till 2035)
- 25.2.10. mRNA Vaccines and Therapeutics Market in North America for RSV Infection, Historical Trends (Since 2020) and Forecasted Estimates (Till 2035)
26. MARKET OPPORTUNITY ANALYSIS: EUROPE
- 26.1. mRNA Vaccines and Therapeutics Market in Europe: Distribution by Application Area
- 26.1.1 mRNA Vaccines and Therapeutics Market in Europe for COVID-19, Historical Trends (Since 2020) and Forecasted Estimates (Till 2035)
- 26.1.2 mRNA Vaccines and Therapeutics Market in Europe for Other Indications, Historical Trends (Since 2020) and Forecasted Estimates (Till 2035)
- 26.2. mRNA Vaccines and Therapeutics Market in Europe: Distribution by Target Disease Indication
- 26.2.1. mRNA Vaccines and Therapeutics Market in Europe for Cystic Fibrosis, Historical Trends (Since 2020) and Forecasted Estimates (Till 2035)
- 26.2.2. mRNA Vaccines and Therapeutics Market in Europe for Influenza, Historical Trends (Since 2020) and Forecasted Estimates (Till 2035)
- 26.2.3. mRNA Vaccines and Therapeutics Market in Europe for Melanoma, Historical Trends (Since 2020) and Forecasted Estimates (Till 2035)
- 26.2.4. mRNA Vaccines and Therapeutics Market in Europe for Metastatic/ R/R Head and Neck cancer, Historical Trends (Since 2020) and Forecasted Estimates (Till 2035)
- 26.2.5. mRNA Vaccines and Therapeutics Market in Europe for Mononucleosis, Historical Trends (Since 2020) and Forecasted Estimates (Till 2035)
- 26.2.6. mRNA Vaccines and Therapeutics Market in Europe for Muscle-Invasive Urothelial Carcinoma, Historical Trends (Since 2020) and Forecasted Estimates (Till 2035)
- 26.2.7. mRNA Vaccines and Therapeutics Market in Europe for Non-Small Cell Lung Cancer, Historical Trends (Since 2020) and Forecasted Estimates (Till 2035)
- 26.2.8. mRNA Vaccines and Therapeutics Market in Europe for Norovirus Acute Gastroenteritis, Historical Trends (Since 2020) and Forecasted Estimates (Till 2035)
- 26.2.9. mRNA Vaccines and Therapeutics Market in Europe for Propionic Acidemia, Historical Trends (Since 2020) and Forecasted Estimates (Till 2035)
- 26.2.10. mRNA Vaccines and Therapeutics Market in Europe for RSV Infection, Historical Trends (Since 2020) and Forecasted Estimates (Till 2035)
27. MARKET OPPORTUNITY ANALYSIS: ASIA PACIFIC
- 27.1.mRNA Vaccines and Therapeutics Market in Asia Pacific: Distribution by Application Area
- 27.1.1 mRNA Vaccines and Therapeutics Market in Asia Pacific for COVID-19, Historical Trends (Since 2020) and Forecasted Estimates (Till 2035)
- 27.1.2. mRNA Vaccines and Therapeutics Market in Asia Pacific for Other Indications, Historical Trends (Since 2020) and Forecasted Estimates (Till 2035)
- 27.2. mRNA Vaccines and Therapeutics Market in Asia Pacific: Distribution by Target Disease Indication
- 27.2.1. mRNA Vaccines and Therapeutics Market in Asia Pacific for Cystic Fibrosis, Historical Trends (Since 2020) and Forecasted Estimates (Till 2035)
- 27.2.2. mRNA Vaccines and Therapeutics Market in Asia Pacific for Influenza, Historical Trends (Since 2020) and Forecasted Estimates (Till 2035)
- 27.2.3. mRNA Vaccines and Therapeutics Market in Asia Pacific for Melanoma, Historical Trends (Since 2020) and Forecasted Estimates (Till 2035)
- 27.2.4. mRNA Vaccines and Therapeutics Market in Asia Pacific for Metastatic/ R/R Head and Neck cancer, Historical Trends (Since 2020) and Forecasted Estimates (Till 2035)
- 27.2.5. mRNA Vaccines and Therapeutics Market in Asia Pacific for Mononucleosis, Historical Trends (Since 2020) and Forecasted Estimates (Till 2035)
- 27.2.6. mRNA Vaccines and Therapeutics Market in Asia Pacific for Muscle-Invasive Urothelial Carcinoma, Historical Trends (Since 2020) and Forecasted Estimates (Till 2035)
- 27.2.7. mRNA Vaccines and Therapeutics Market in Asia Pacific for Non-Small Cell Lung Cancer, Historical Trends (Since 2020) and Forecasted Estimates (Till 2035)
- 27.2.8. mRNA Vaccines and Therapeutics Market in Asia Pacific for Norovirus Acute Gastroenteritis, Historical Trends (Since 2020) and Forecasted Estimates (Till 2035)
- 27.2.9. mRNA Vaccines and Therapeutics Market in Asia Pacific for Propionic Acidemia, Historical Trends (Since 2020) and Forecasted Estimates (Till 2035)
- 27.2.10. mRNA Vaccines and Therapeutics Market in Asia Pacific for RSV Infection, Historical Trends (Since 2020) and Forecasted Estimates (Till 2035)
- CONCLUDING REMARKS
- EXECUTIVE INSIGHTS
- APPENDIX 1: TABULATED DATA
31. APPENDIX 2: LIST OF COMPANIES AND ORGANIZATIONS
List of Tables
- Table 7.1 mRNA Vaccines and Therapeutics: Overall Market Landscape
- Table 7.2 mRNA Vaccines and Therapeutics: Information on Type of Delivery System
- Table 7.3 mRNA Vaccines and Therapeutics: Information on Type of Molecule Encoded
- Table 7.4 mRNA Vaccines and Therapeutics: Information on Route of Administration
- Table 7.5 mRNA Vaccines and Therapeutics Developers: List of Companies
- Table 9.1 mRNA Vaccines and Therapeutics Developers: List of Companies Profiled
- Table 9.2 Arcturus Therapeutics: Company Overview
- Table 9.3 Arcturus Therapeutics: Pipeline Overview
- Table 9.4 Arcturus Therapeutics: Recent Developments and Future Outlook
- Table 9.5 Immorna: Company Overview
- Table 9.6 Immorna: Pipeline Overview
- Table 9.7 Immorna: Recent Developments and Future Outlook
- Table 9.8 Moderna: Company Overview
- Table 9.9 Moderna: Pipeline Overview
- Table 9.10 Moderna: Recent Developments and Future Outlook
- Table 9.11 Providence Therapeutics: Company Overview
- Table 9.12 Providence Therapeutics: Pipeline Overview
- Table 9.13 Providence Therapeutics: Recent Developments and Future Outlook
- Table 9.14 Innovac Therapeutics: Company Overview
- Table 9.15 Innovac Therapeutics: Pipeline Overview
- Table 9.16 Innovac Therapeutics: Recent Developments and Future Outlook
- Table 9.17 Kernal Biologics: Company Overview
- Table 9.18 Kernal Biologics: Pipeline Overview
- Table 9.19 Kernal Biologics: Recent Developments and Future Outlook
- Table 9.20 Recode Therapeutics: Company Overview
- Table 9.21 Recode Therapeutics: Pipeline Overview
- Table 9.22 Recode Therapeutics: Recent Developments and Future Outlook
- Table 9.23 Rejuvenation Technologies: Company Overview
- Table 9.24 Rejuvenation Technologies: Pipeline Overview
- Table 9.25 Rejuvenation Technologies: Recent Developments and Future Outlook
- Table 9.26 RNAimmune: Company Overview
- Table 9.27 RNAimmune: Pipeline Overview
- Table 9.28 RNAimmune: Recent Developments and Future Outlook
- Table 9.29 Turn Biotechnologies: Company Overview
- Table 9.30 Turn Biotechnologies: Pipeline Overview
- Table 9.31 Turn Biotechnologies: Recent Developments and Future Outlook
- Table 9.32 Strand Therapeutics: Company Overview
- Table 9.33 Strand Therapeutics: Pipeline Overview
- Table 9.34 Strand Therapeutics: Recent Developments and Future Outlook
- Table 10.1 BioNTech: Company Overview
- Table 10.2 BioNTech: Pipeline Overview
- Table 10.3 BioNTech: Recent Developments and Future Outlook
- Table 10.4 CureVac: Company Overview
- Table 10.5 CureVac: Pipeline Overview
- Table 10.6 CureVac: Recent Developments and Future Outlook
- Table 10.7 Ethris: Company Overview
- Table 10.8 Ethris: Pipeline Overview
- Table 10.9 Ethris: Recent Developments and Future Outlook
- Table 11.1 Suzhou Abogen Biosciences: Company Overview
- Table 11.2 Suzhou Abogen Biosciences: Pipeline Overview
- Table 11.3 Suzhou Abogen Biosciences: Recent Developments and Future Outlook
- Table 11.4 Gennova Biopharmaceuticals: Company Overview
- Table 11.5 Gennova Biopharmaceuticals: Pipeline Overview
- Table 11.6 Gennova Biopharmaceuticals: Recent Developments and Future Outlook
- Table 11.7 RNACure: Company Overview
- Table 11.8 RNACure: Pipeline Overview
- Table 11.9 RNACure: Recent Developments and Future Outlook
- Table 11.10 Walwax: Company Overview
- Table 11.11 Walwax: Pipeline Overview
- Table 11.12 Walwax: Recent Developments and Future Outlook
- Table 13.1 mRNA Vaccines and Therapeutics Start-ups: Information on Location of Headquarters
- Table 15.1 mRNA Vaccines and Therapeutics: List of Partnerships and Collaborations
- Table 15.2 mRNA Vaccines and Therapeutics: Information on Type of Agreement (Country and Region), since 2013
- Table 16.1 mRNA Vaccines and Therapeutics: List of Funding and Investments
- Table 17.1 Patent Analysis: Top CPC Sections
- Table 17.2 Patent Analysis: Top CPC Symbols
- Table 17.3 Patent Analysis: Top CPC
- Table 17.4 Patent Portfolio: Summary of Benchmarking Analysis
- Table 17.5 Patent Analysis: Categorization based on Weighted Valuation Scores
- Table 17.6 Patent Portfolio: List of Leading Patents (by Highest Relative Valuation)
- Table 21.1 mRNA Vaccines and Therapeutics: Expected Launch Year of Advance Stage Drug Candidates
- Table 32.1 mRNA Vaccines and Therapeutics: Distribution by Status of Development
- Table 32.2 mRNA Vaccines and Therapeutics: Distribution by Type of Drug Candidate
- Table 32.3 mRNA Vaccines and Therapeutics: Distribution by Type of Program
- Table 32.4 mRNA Vaccines and Therapeutics: Distribution by Type of Delivery System
- Table 32.5 mRNA Vaccines and Therapeutics: Distribution by Type of Molecule Encoded
- Table 32.6 mRNA Vaccines and Therapeutics: Distribution by Route of Administration
- Table 32.7 mRNA Vaccines and Therapeutics: Distribution by Therapeutic Area
- Table 32.8 mRNA Vaccines and Therapeutics Developers: Distribution by Year of Establishment
- Table 32.9 mRNA Vaccines and Therapeutics Developers: Distribution by Company Size
- Table 32.10 mRNA Vaccines and Therapeutics Developers: Distribution by Location of Headquarters
- Table 32.11 mRNA Vaccines and Therapeutics Developers: Distribution by Most Active Developers
- Table 32.12 Product Competitiveness Analysis: mRNA Vaccines and Therapeutics Developers based in North America
- Table 32.13 Product Competitiveness Analysis: mRNA Vaccines and Therapeutics Developers based in Europe
- Table 32.14 Product Competitiveness Analysis: mRNA Vaccines and Therapeutics Developers based in Asia-Pacific and Rest of the World
- Table 32.15 Arcturus Therapeutics: Annual Revenues, Since 2021 (USD Billion)
- Table 32.16 Moderna: Annual Revenues, Since 2021 (USD Billion)
- Table 32.17 Providence Therapeutics: Annual Revenues, Since 2021 (USD Billion)
- Table 32.18 Kernal Biologics: Annual Revenues, Since 2021 (USD Billion)
- Table 32.19 Recode Therapeutics: Annual Revenues, Since 2021 (USD Billion)
- Table 32.20 Rejuvenation Technologies: Annual Revenues, Since 2021 (USD Billion)
- Table 32.21 RNAimmune: Annual Revenues, Since 2021 (USD Billion)
- Table 32.22 Turn Biotechnologies: Annual Revenues, Since 2021 (USD Billion)
- Table 32.23 Strand Therapeutics: Annual Revenues, Since 2021 (USD Billion)
- Table 32.24 BioNTech: Annual Revenues, Since 2021 (USD Billion)
- Table 32.25 CureVac: Annual Revenues, Since 2021 (USD Billion)
- Table 32.26 Gennova Biopharmaceuticals: Annual Revenues, Since 2021 (USD Billion)
- Table 32.27 Walvax: Annual Revenues, Since 2021 (USD Billion)
- Table 32.28 Big Pharma Initiatives: Distribution by Year of Initiative
- Table 32.29 Big Pharma Initiatives: Distribution by Type of Initiative
- Table 32.30 Big Pharma Initiatives: Distribution by Year and Type of Initiative
- Table 32.31 Big Pharma Initiatives: Distribution by Type of Partnership
- Table 32.32 Big Pharma Initiatives: Distribution by Type of Expansion
- Table 32.33 Big Pharma Initiatives: Distribution by Year of Initiative and Company
- Table 32.34 Big Pharma Initiatives: Distribution by Number of Initiatives
- Table 32.35 Spider Web Analysis: Bayer
- Table 32.36 Spider Web Analysis: Pfizer
- Table 32.37 Spider Web Analysis: Sanofi
- Table 32.38 Startup-Health Indexing: Distribution by Location of Headquarters
- Table 32.39 Startup-Health Indexing: Distribution by Company Strength
- Table 32.40 Startup-Health Indexing: Distribution by Pipeline Maturity
- Table 32.41 Startup-Health Indexing: Distribution by Pipeline Strength
- Table 32.42 Startup-Health Indexing: Distribution by Financial Support
- Table 32.43 Startup-Health Indexing: Distribution by Investor Strength
- Table 32.44 Startup-Health Indexing: Distribution by Partnership Activity
- Table 32.45 Startup-Health Indexing: Roots Analysis Perspective
- Table 32.46 Start-up Health Indexing: Leading Companies
- Table 32.47 Clinical Trial Analysis: Distribution by Trial Status
- Table 32.48 Clinical Trial Analysis: Distribution by Trial Registration Year
- Table 32.49 Clinical Trial Analysis: Distribution by Trial Phase
- Table 32.50 Clinical Trial Analysis: Distribution by Number of Patients Enrolled by Trial Status
- Table 32.51 Clinical Trial Analysis: Distribution by Type of Sponsor / Collaborator
- Table 32.52 Clinical Trial Analysis: Distribution by Trial Registration Year and Trial Status
- Table 32.53 Clinical Trial Analysis: Distribution of Number of Patients Enrolled by Trial Registration Year
- Table 32.54 Clinical Trial Analysis: Distribution by Study Design
- Table 32.55 Clinical Trial Analysis: Distribution of Leading Industry Players: Analysis by Number of Clinical Trials
- Table 32.56 Clinical Trial Analysis: Distribution by Patient Gender
- Table 32.57 Clinical Trial Analysis: Distribution by Target Patient Population
- Table 32.58 Clinical Trial Analysis: Distribution of Clinical Trials by Geography
- Table 32.59 Clinical Trial Analysis: Distribution of Clinical Trials by Geography and Trial Status
- Table 32.60 Clinical Trial Analysis: Distribution of Patients Enrolled by Geography and Trial Status
- Table 32.61 Clinical Trial Analysis: Distribution by Number of Clinical Trials in Geography
- Table 32.62 Clinical Trial Analysis: Distribution by Number of Patients Enrolled by Geography
- Table 32.63 Partnerships and Collaborations: Distribution by Year of Partnership
- Table 32.64 Partnerships and Collaborations: Distribution by Type of Partnership
- Table 32.65 Partnerships and Collaborations: Distribution by Year and Type of Partnership
- Table 32.66 Partnerships and Collaborations: Distribution by Therapeutic Area
- Table 32.67 Partnerships and Collaborations: Most Active Players: Distribution by Number of Partnerships
- Table 32.68 Partnerships and Collaborations: Intercontinental and Intracontinental Agreements
- Table 32.69 Partnerships and Collaborations: Local and International Agreements
- Table 32.70 Funding and Investment Analysis: Cumulative Year-wise Trend, Pre-2020-2025
- Table 32.71 Funding and Investment Analysis: Cumulative Year-wise Trend of Amount Invested, Pre-2020-2025 (USD Million)
- Table 32.72 Funding and Investment Analysis: Distribution of Funding Instances by Type of Funding
- Table 32.73 Funding and Investment Analysis: Distribution by Year and Type of Funding
- Table 32.74 Funding and Investment Analysis: Distribution of Amount Raised by Year and Type of Funding
- Table 32.75 Funding and Investment Analysis: Distribution by Therapeutic Area
- Table 32.76 Funding and Investment Analysis: Most Active Players: Distribution by Number of Funding Instances
- Table 32.77 Funding and Investment Analysis: Most Active Players: Distribution by Amount Raised
- Table 32.78 Funding and Investment Analysis: Geographical Distribution by Number of Instances
- Table 32.79 Funding and Investment Analysis: Geographical Distribution by Number of Instances by Amount Raised
- Table 32.80 Patent Analysis: Distribution by Type of Patent
- Table 32.81 Patent Analysis: Distribution by Patent Publication Year
- Table 32.82 Patent Analysis: Distribution by Type of Patent and Publication Year
- Table 32.83 Patent Analysis: Distribution by Application Year
- Table 32.84 Patent Analysis: Distribution by Patent Jurisdiction
- Table 32.85 Patent Analysis: Distribution by Distribution by CPC Symbols
- Table 32.86 Patent Analysis: Distribution by Distribution by Type of Applicant
- Table 32.87 Patent Analysis: Distribution of Leading Industry Players: Analysis by Number of Patents
- Table 32.88 Patent Analysis: Distribution of Leading Non-Industry Players: Analysis by Number of Patents
- Table 32.89 Patent Analysis: Distribution of Leading Inventors: Analysis by Number of Patents
- Table 32.90 Patent Benchmarking: Distribution of Leading Industry Players by Patent Characteristics (CPC Codes)
- Table 32.91 Patent Analysis: Patent Valuation
- Table 32.92 FDA Approval Strategies: Distribution of Key Strategies by Vaccines
- Table 32.93 Outsourcing: Go / No-Go Framework
- Table 32.94 Outsourcing: Go / No-Go Framework Methodology
- Table 32.95 Outsourcing: Go / No-Go Framework for Cell and Gene Therapy Developers
- Table 32.96 Outsourcing: Go / No-Go Framework for Small Companies
- Table 32.97 Outsourcing: Go / No-Go Framework for Mid-sized Companies
- Table 32.98 Outsourcing: Go / No-Go Framework for Large Companies
- Table 32.99 mRNA Vaccines and Therapeutics: Market Drivers
- Table 32.100 mRNA Vaccines and Therapeutics: Market Restraints
- Table 32.101 mRNA Vaccines and Therapeutics: Market Opportunities
- Table 32.102 mRNA Vaccines and Therapeutics: Market Challenges.
- Table 32.103 Global mRNA Vaccines and Therapeutics Market, till 2035 (USD Million)
- Table 32.104 Global mRNA Vaccines and Therapeutics Market, till 2035: Conservative Scenario (USD Million)
- Table 32.105 Global mRNA Vaccines and Therapeutics Market, till 2035: Optimistic Scenario (USD Million)
- Table 32.106 mRNA Vaccines and Therapeutics Market: Distribution by Application Area
- Table 32.107 mRNA Vaccines and Therapeutics Market for COVID-19, till 2035 (USD Million)
- Table 32.108 mRNA Vaccines and Therapeutics Market for Other Indications, till 2035 (USD Million)
- Table 32.109 mRNA Vaccines and Therapeutics Market: Distribution by Target Disease Indication
- Table 32.110 mRNA Vaccines and Therapeutics Market for Influenza, till 2035 (USD Million)
- Table 32.111 mRNA Vaccines and Therapeutics Market for Respiratory Syncytial Virus Infection, till 2035 (USD Million)
- Table 32.112 mRNA Vaccines and Therapeutics Market for Cytomegalovirus Disease, till 2035 (USD Million)
- Table 32.113 mRNA Vaccines and Therapeutics Market: Distribution by Geographical Regions
- Table 32.114 mRNA Vaccines and Therapeutics Market in North America, till 2035 (USD Million)
- Table 32.115 mRNA Vaccines and Therapeutics Market in the US, till 2035 (USD Million)
- Table 32.116 mRNA Vaccines and Therapeutics Market in Canada, till 2035 (USD Million)
- Table 32.117 mRNA Vaccines and Therapeutics Market in Europe, till 2035 (USD Million)
- Table 32.118 mRNA Vaccines and Therapeutics Market in Germany, till 2035 (USD Million)
- Table 32.119 mRNA Vaccines and Therapeutics Market in the UK, till 2035 (USD Million)
- Table 32.120 mRNA Vaccines and Therapeutics Market in France, till 2035 (USD Million)
- Table 32.121 mRNA Vaccines and Therapeutics Market in Italy, till 2035 (USD Million)
- Table 32.122 mRNA Vaccines and Therapeutics Market in Spain, till 2035 (USD Million)
- Table 32.123 mRNA Vaccines and Therapeutics Market in Belgium, till 2035 (USD Million)
- Table 32.124 mRNA Vaccines and Therapeutics Market in Asia-Pacific, till 2035 (USD Million)
- Table 32.125 mRNA Vaccines and Therapeutics Market in China, till 2035 (USD Million)
- Table 32.126 mRNA Vaccines and Therapeutics Market in India, till 2035 (USD Million)
- Table 32.127 mRNA Vaccines and Therapeutics Market in Japan, till 2035 (USD Million)
- Table 32.128 mRNA Vaccines and Therapeutics Market in Australia, till 2035 (USD Million)
List of Figures
- Figure 2.1 Research Methodology: Project Methodology
- Figure 2.2 Research Methodology: Secondary Research: Data Sources
- Figure 3.1 Lessons Learnt from Past Recessions
- Figure 4.1 Executive Summary: Market Landscape
- Figure 4.2 Executive Summary: Clinical Trial Analysis
- Figure 4.3 Executive Summary: Partnerships and Collaborations
- Figure 4.4 Executive Summary: Funding and Investment Analysis
- Figure 4.5 Executive Summary: Patent Analysis
- Figure 4.6 Executive Summary: Market Forecast and Opportunity Analysis
- Figure 5.1 Historical Evolution of mRNA
- Figure 5.2 Key Applications of mRNA Therapeutics
- Figure 7.1 mRNA Vaccines and Therapeutics: Distribution by Status of Development
- Figure 7.2 mRNA Vaccines and Therapeutics: Distribution by Type of Drug Candidate
- Figure 7.3 mRNA Vaccines and Therapeutics: Distribution by Type of Program
- Figure 7.4 mRNA Vaccines and Therapeutics: Distribution by Type of Delivery System
- Figure 7.5 mRNA Vaccines and Therapeutics: Distribution by Type of Molecule Encoded
- Figure 7.6 mRNA Vaccines and Therapeutics: Distribution by Route of Administration
- Figure 7.7 mRNA Vaccines and Therapeutics: Distribution by Therapeutic Area
- Figure 7.8 mRNA Vaccines and Therapeutics Developers: Distribution by Year of Establishment
- Figure 7.9 mRNA Vaccines and Therapeutics Developers: Distribution by Company Size
- Figure 7.10 mRNA Vaccines and Therapeutics Developers: Distribution by Location of Headquarters
- Figure 7.11 mRNA Vaccines and Therapeutics Developers: Distribution by Most Active Developers
- Figure 8.1 Product Competitiveness Analysis: mRNA Vaccine and Therapeutics Developed by Players based in North America
- Figure 8.2 Product Competitiveness Analysis: mRNA Vaccine and Therapeutics Developed by Players based in Europe
- Figure 8.3 Product Competitiveness Analysis: mRNA Vaccine and Therapeutics Developed by Players based in Asia-Pacific and Rest of the World
- Figure 9.1 Arcturus Therapeutics: Annual Revenues, Since 2021 (USD Billion)
- Figure 9.2 Moderna: Annual Revenues, Since 2021 (USD Billion)
- Figure 9.3 Providence Therapeutics: Annual Revenues, Since 2021 (USD Billion)
- Figure 9.4 Kernal Biologics: Annual Revenues, Since 2021 (USD Billion)
- Figure 9.5 Recode Therapeutics: Annual Revenues, Since 2021 (USD Billion)
- Figure 9.6 Rejuvenation Technologies: Annual Revenues, Since 2021 (USD Billion)
- Figure 9.7 RNAimmune: Annual Revenues, Since 2021 (USD Billion)
- Figure 9.8 Turn Biotechnologies: Annual Revenues, Since 2021 (USD Billion)
- Figure 9.9 Strand Therapeutics: Annual Revenues, Since 2021(USD Billion)
- Figure 10.1 BioNTech: Annual Revenues, Since 2021 (USD Billion)
- Figure 10.2 CureVac: Annual Revenues, Since 2021 (USD Billion)
- Figure 11.1 Gennova Biopharmaceuticals: Annual Revenues, Since 2021 (USD Billion)
- Figure 11.2 Walvax: Annual Revenues, Since 2021 (USD Billion)
- Figure 12.1 Big Pharma Initiatives: Distribution by Year of Initiative
- Figure 12.2 Big Pharma Initiatives:: Distribution by Type of Initiative
- Figure 12.3 Big Pharma Initiatives:: Distribution by Year and Type of Initiative
- Figure 12.4 Big Pharma Initiatives:: Distribution by Type of Partnership
- Figure 12.5 Big Pharma Initiatives:: Distribution by Type of Expansion
- Figure 12.6 Big Pharma Initiatives:: Distribution by Year of Initiative and Company
- Figure 12.7 Big Pharma Initiatives:: Distribution by Number of Initiatives
- Figure 12.8 Spider Web Analysis: Bayer
- Figure 12.9 Spider Web Analysis: Pfizer
- Figure 12.10 Spider Web Analysis: Sanofi
- Figure 13.1 Startup-Health Indexing: Distribution by Location of Headquarters
- Figure 13.2 Startup-Health Indexing: Distribution by Company Strength
- Figure 13.3 Startup-Health Indexing: Distribution by Pipeline Maturity
- Figure 13.4 Startup-Health Indexing: Distribution by Pipeline Strength
- Figure 13.5 Startup-Health Indexing: Distribution by Financial Support
- Figure 13.6 Startup-Health Indexing: Distribution by Investor Strength
- Figure 13.7 Startup-Health Indexing: Distribution by Partnership Activity
- Figure 13.8 Startup-Health Indexing: Roots Analysis Perspective
- Figure 13.9 Start-up Health Indexing: Leading Companies
- Figure 14.1 Clinical Trial Analysis: Distribution by Trial Status
- Figure 14.2 Clinical Trial Analysis: Distribution by Trial Registration Year
- Figure 14.3 Clinical Trial Analysis: Distribution by Trial Phase
- Figure 14.4 Clinical Trial Analysis: Distribution by Analysis of Number of Patients Enrolled by Trial Status
- Figure 14.5 Clinical Trial Analysis: Distribution by Type of Sponsor / Collaborator
- Figure 14.6 Clinical Trial Analysis: Distribution by Trial Registration Year and Trial Status
- Figure 14.7 Clinical Trial Analysis: Distribution of Number of Patients Enrolled by Trial Registration Year
- Figure 14.8 Clinical Trial Analysis: Distribution by Study Design
- Figure 14.9 Clinical Trial Analysis: Distribution of Leading Industry Players: Analysis by Number of Clinical Trials
- Figure 14.10 Clinical Trial Analysis: Distribution by Patient Gender
- Figure 14.11 Clinical Trial Analysis: Distribution by Target Patient Population
- Figure 14.12 Clinical Trial Analysis: Distribution of Clinical Trials by Geography
- Figure 14.13 Clinical Trial Analysis: Distribution of Clinical Trials by Geography and Trial Status
- Figure 14.14 Clinical Trial Analysis: Distribution of Patients Enrolled by Geography and Trial Status
- Figure 14.15 Clinical Trial Analysis: Distribution by Number of Clinical Trials in Geography
- Figure 14.16 Clinical Trial Analysis: Distribution by Number of Patients Enrolled by Geography
- Figure 15.1 Partnerships and Collaborations: Distribution by Year of Partnership
- Figure 15.2 Partnerships and Collaborations: Distribution by Type of Partnership
- Figure 15.3 Partnerships and Collaborations: Distribution by Year and Type of Partnership
- Figure 15.4 Partnerships and Collaborations: Distribution by Therapeutic Area
- Figure 15.5 Partnerships and Collaborations: Most Active Players: Distribution by Number of Partnerships
- Figure 15.6 Partnerships and Collaborations: Intercontinental and Intracontinental Agreements
- Figure 15.7 Partnerships and Collaborations: Local and International Agreements
- Figure 16.1 Funding and Investment Analysis: Cumulative Year-wise Trend, Pre-2020-2025
- Figure 16.2 Funding and Investment Analysis: Cumulative Year-wise Trend of Amount Invested, Pre-2020-2025 (USD Million)
- Figure 16.3 Funding and Investment Analysis: Distribution of Funding Instances by Type of Funding
- Figure 16.4 Funding and Investment Analysis: Distribution of Amount Raised by Year and Type of Funding
- Figure 16.6 Funding and Investment Analysis: Distribution by Therapeutic Area
- Figure 16.7 Funding and Investment Analysis: Most Active Players: Distribution by Number of Funding Instances
- Figure 16.8 Funding and Investment Analysis: Most Active Players: Distribution by Amount Raised
- Figure 16.9 Funding and Investment Analysis: Geographical Distribution by Number of Instances
- Figure 16.10 Funding and Investment Analysis: Geographical Distribution by Number of Instances by Amount Raised
- Figure 17.1 Patent Analysis: Distribution by Type of Patent
- Figure 17.2 Patent Analysis: Distribution by Patent Publication Year
- Figure 17.3 Patent Analysis: Distribution by Type of Patent and Publication Year
- Figure 17.4 Patent Analysis: Distribution by Application Year
- Figure 17.5 Patent Analysis: Distribution by Patent Jurisdiction
- Figure 17.6 Patent Analysis: Distribution by CPC Symbols
- Figure 17.7 Patent Analysis: Distribution by Type of Applicant
- Figure 17.8 Patent Analysis: Distribution of Leading Industry Players: Analysis by Number of Patents
- Figure 17.9 Patent Analysis: Distribution of Leading Non-Industry Players: Analysis by Number of Patents
- Figure 17.10 Patent Analysis: Distribution of Leading Inventors: Analysis by Number of Patents
- Figure 17.11 Patent Benchmarking: Distribution of Leading Industry Players by Patent Characteristics (CPC Codes)
- Figure 17.12 Patent Analysis: Patent Valuation
- Figure 18.1 FDA Approval Strategies: Distribution of Key Strategies by Vaccines
- Figure 19.1 Outsourcing: Go / No-Go Framework
- Figure 19.2 Outsourcing: Go / No-Go Framework Methodology
- Figure 19.3 Outsourcing: Go / No-Go Framework for Cell and Gene Therapy Developers
- Figure 19.4 Outsourcing: Go / No-Go Framework for Small Companies
- Figure 19.5 Outsourcing: Go / No-Go Framework for Mid-sized Companies
- Figure 19.6 Outsourcing: Go / No-Go Framework for Large Companies
- Figure 20.1 mRNA Vaccine and Therapeutics: Market Drivers
- Figure 20.2 mRNA Vaccine and Therapeutics: Market Restraints
- Figure 20.3 mRNA Vaccine and Therapeutics: Market Opportunities
- Figure 20.4 mRNA Vaccine and Therapeutics: Market Challenges
- Figure 21.1 Global mRNA Vaccine and Therapeutics Market, till 2035 (USD Million)
- Figure 21.2 Global mRNA Vaccine and Therapeutics Market, till 2035: Conservative Scenario (USD Million)
- Figure 21.3 Global mRNA Vaccine and Therapeutics Market, till 2035: Optimistic Scenario (USD Million)
- Figure 22.1 mRNA Vaccine and Therapeutics Market: Distribution by Application Area
- Figure 22.2 mRNA Vaccine and Therapeutics Market for COVID-19, till 2035 (USD Million)
- Figure 22.3 mRNA Vaccine and Therapeutics Market for Other Indications, till 2035 (USD Million)
- Figure 23.1 mRNA Vaccine and Therapeutics Market: Distribution by Target Disease Indication
- Figure 23.2 mRNA Vaccine and Therapeutics Market for Influenza, till 2035 (USD Million)
- Figure 23.3 mRNA Vaccine and Therapeutics Market for Respiratory Syncytial Virus Infection, till 2035 (USD Million)
- Figure 23.4 mRNA Vaccine and Therapeutics Market for Cytomegalovirus Disease, till 2035 (USD Million)
- Figure 24.1 mRNA Vaccine and Therapeutics Market: Distribution by Geographical Regions
- Figure 24.2 mRNA Vaccine and Therapeutics Market in North America, till 2035 (USD Million)
- Figure 24.3 mRNA Vaccine and Therapeutics Market in the US, till 2035 (USD Million)
- Figure 24.4 mRNA Vaccine and Therapeutics Market in Canada, till 2035 (USD Million)
- Figure 24.5 mRNA Vaccine and Therapeutics Market in Europe, till 2035 (USD Million)
- Figure 24.6 mRNA Vaccine and Therapeutics Market in Germany, till 2035 (USD Million)
- Figure 24.7 mRNA Vaccine and Therapeutics Market in the UK, till 2035 (USD Million)
- Figure 24.8 mRNA Vaccine and Therapeutics Market in France, till 2035 (USD Million)
- Figure 24.9 mRNA Vaccine and Therapeutics Market in Italy, till 2035 (USD Million)
- Figure 24.10 mRNA Vaccine and Therapeutics Market in Spain, till 2035 (USD Million)
- Figure 24.11 mRNA Vaccine and Therapeutics Market in Belgium, till 2035 (USD Million)
- Figure 24.12 mRNA Vaccine and Therapeutics Market in Asia-Pacific, till 2035 (USD Million)
- Figure 24.13 mRNA Vaccine and Therapeutics Market in China, till 2035 (USD Million)
- Figure 24.14 mRNA Vaccine and Therapeutics Market in India, till 2035 (USD Million)
- Figure 24.15 mRNA Vaccine and Therapeutics Market in Japan, till 2035 (USD Million)
- Figure 24.17 mRNA Vaccine and Therapeutics Market in Australia, till 2035 (USD Million)
- Figure 30.1 Concluding Remarks: Overall Market Landscape
- Figure 30.2 Concluding Remarks: Partnerships and Collaborations
- Figure 30.3 Concluding Remarks: Funding and Investment Analysis
- Figure 30.4 Concluding Remarks: Clinical Trial Analysis
- Figure 30.5 Concluding Remarks: Patent Analysis
- Figure 30.6 Concluding Remarks: Market Forecast and Opportunity Analysis

