
PUBLISHER: Roots Analysis | PRODUCT CODE: 2037814

PUBLISHER: Roots Analysis | PRODUCT CODE: 2037814
Next Generation RNA Therapeutics Market (2nd Edition) by Type of Modality, Type of Molecule, Target Indication, Route of Administration, Geographical Regions and Leading Players-Trends and Forecast Till 2035
Next Generation RNA Therapeutics Market: Overview
As per Roots Analysis, the next generation therapeutics market is estimated to grow from USD 0.1 billion in 2029 to USD 2.7 billion by 2035, at a CAGR of 63.1% during the forecast period, till 2035.
Next Generation RNA Therapeutics Market: Growth and Trends
RNA-based treatments have become one of the most important therapeutic approaches in the contemporary healthcare sector over time. RNA therapeutics play a critical role in protein expression and the regulation of gene activity. Additionally, when compared to conventional treatment methods, they provide improved therapeutic and safety characteristics. The extremely unstable nature of these molecules and their distribution in sufficient concentrations, however, raise several issues.
Global industry leaders are pushing the development of next-generation RNA therapies and vaccines to get over the aforementioned obstacles. Further, several companies also provide cutting-edge technological platforms for the creation, development, and production of innovative RNA therapies and vaccines.
Circular RNA (circRNA), endless RNA (eRNA), self-amplifying RNA (saRNA), and transfer RNA (tRNA) are examples of emerging modalities that exhibit improved structural stability, expression specificity, targeted delivery, and non-immunogenic characteristics. These characteristics allow their utilization across various therapeutic applications including breast cancer and influenza. Given the current trends and anticipated potential of the RNA therapies and vaccines industry, the market is expected to grow at a healthy CAGR in the near future.
Growth Drivers: Strategic Enablers of Market Expansion
The RNA therapeutics and RNA vaccines market is driven by a numerous factors underscoring its transformative impact on modern medicine and supporting its accelerated growth trajectory. A key growth driver has been the strong real-world validation of mRNA-based COVID-19 vaccines, which demonstrated the ability for rapid development, testing, and deployment while maintaining high efficacy against evolving pathogens. This success has significantly strengthened confidence in the platform, triggering substantial investments in the form of venture capital, strategic partnerships, and pipeline expansion across therapeutic areas such as oncology, rare genetic disorders, chronic diseases, and personalized vaccines.
This momentum is further reinforced by ongoing technological advancements, including the development of advanced lipid nanoparticle and exosome-based delivery systems that address prior challenges related to stability and targeted delivery. Additionally, innovations such as self-amplifying RNA platforms have enabled dose and cost optimization, while the integration of AI-driven tools has accelerated sequence design, optimization, and candidate selection timelines. Moreover, the increasing global burden of diseases including infectious diseases, cancer, and genetic disorders combined with supportive regulatory frameworks, such as fast-track designations for orphan drugs and a growing number of product approvals, continues to drive market demand. At the same time, a highly collaborative ecosystem involving biotechnology companies, contract development and manufacturing organizations (CDMOs), and research institutions is fostering innovation and investment in precision medicine approaches, enabling RNA-based therapies to selectively direct protein expression or silence disease-associated genes.
Market Challenges: Critical Barriers Impeding Progress
Despite the abovementioned advantages, the RNA therapeutics and RNA vaccines market faces significant hurdles, that can slow the pace of transition and raise barriers for widespread implementation. Manufacturing remains exceptionally complex and capital-intensive, requiring specialized cleanroom facilities, rigorous quality oversight, and labor-intensive purification steps that significantly increase costs. These challenges also create bottlenecks in raw material supply and skilled personnel availability, often limiting production volumes and increasing vulnerability to recalls due to unexpected safety signals or inconsistencies.
In addition, delivery hurdles persist as RNA molecules are fragile and prone to rapid degradation by RNases, while lipid carriers frequently struggle with inefficient endosomal escape, off-target effects, or immune activation that can diminish potency or raise toxicity concerns, particularly outside the liver. Logistical challenges stem from stringent ultra-cold storage and distribution requirements, which significantly limit reach in low-resource settings. These issues are further compounded by evolving regional regulatory frameworks, geopolitical risks associated with dual-use technologies, and persistent public hesitancy driven by misinformation, collectively extending timelines, increasing financial risks for smaller innovators, and underscoring the need for continued innovation to achieve mainstream viability.
Next Generation RNA Therapeutics Market: Key Insights
The report delves into the current state of the next generation therapeutics market and identifies potential growth opportunities within industry. Some key findings from the report include:
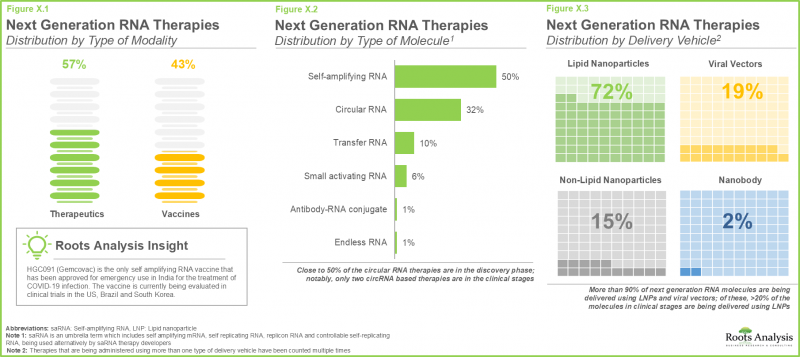
- 73% of the next generation therapies being developed by various industry players are in discovery and preclinical stages; most of these therapies primarily focus on the treatment of infectious diseases.
- 80% of the clinical stage next generation therapies are in phase I and phase I / II; notably, around 60% clinical stage next generation therapies / vaccines are designed for intramuscular administration.
- Despite being in early stages of development, circular RNA therapies form a rapidly advancing therapy segment; this highly stable and efficient therapeutic modality is anticipated to gain significant popularity in the coming future.
- ~40% therapies are being evaluated in late-stages of development, highlighting the significant potential of next generation RNA technologies in therapy development.
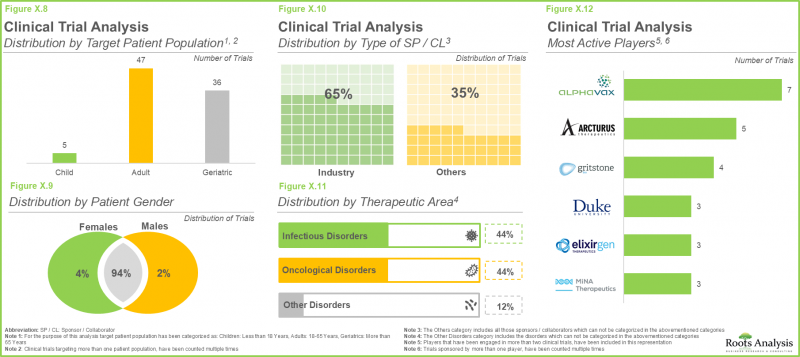
- Majority of the clinical trials (21%) were registered in 2024; notably, most of the (~60%) clinical trials completed in the RNA therapeutics and vaccines domain were focused on infectious diseases.
- Recently, the exploration of RNA therapeutics and vaccines in targeting various disorders has gained momentum, consequently drawing attention from several industry players to conduct more trials in this domain.
- Around 30% of the patents related to RNA therapeutics and vaccines have been published in 2024, reflecting numerous advancements in the field of RNA-based therapies and technologies.
- 53% of the deals inked in this market are focused on clinical research of saRNA therapeutics / vaccines; of these, 50% partnerships focus on the evaluation of therapies targeting oncological disorders.
- Around 40% of the investments made in this domain were reported in the year 2021; notably venture capital emerged as the most prominent funding model, with Series A rounds accounting for 64% of transactions.
- In 2029, the market size is estimated to be around USD 0.1 billion; this value is further projected to reach about USD 2.7 billion in 2035, growing at an annualized CAGR of 63.1%, during the forecast period till 2035.
Next Generation RNA Therapeutics Market
The market sizing and opportunity analysis has been segmented across the following parameters:
Type of Modality
- Therapeutics
- Vaccines
Type of Molecule
- circRNA
- sacRNA
- saRNA
Target Indication
- Advanced Solid Tumors
- Hepatocellular Carcinoma
- Inherited Bone Marrow Failure Syndrome
- Radiation-Induced Xerostomia and Hyposalivation
- Seasonal Influenza
Route of Administration
- Intraductal Route
- Intramuscular Route
- Intratumoral Route
- Intravenous Route
Geographical Regions
- North America
- US
Europe
- France
- Germany
- Italy
- Spain
- UK
- Rest of Europe
Asia-Pacific
- Singapore
Next Generation RNA Therapeutics Market: Key Segments
Which Modality Holds the Biggest Market Share for RNA Therapeutics?
The market for next-generation RNA treatments is segmented across various modalities, including vaccines and therapeutics. According to the next generation RNA therapeutics market forecast, the therapeutics sub-segment is expected to hold a larger proportion (>80%) in 2035. Furthermore, during the forecast period, this sub-segment is anticipated to increase at a notable rate. This is mainly because medicines have a wider range of possible applications than vaccinations. Therapeutics can treat both acute and chronic illnesses, increasing their market potential, in contrast to vaccines, which are mostly preventive and target infectious diseases.
Which molecule type exhibits the fastest growth in the next-generation RNA therapeutics sector?
According to the industry prediction, saRNA molecules are expected to have around 60% of the total market share by 2035. Additionally, the market is anticipated to see a significant rise in the proportion of saRNA molecules, expanding at a CAGR of 73.6% over the course of the projected period. This is because, in contrast to other RNA therapies like siRNAs, its double-stranded structure allows for enhanced gene expression at the transcriptional level. This guarantees the development of larger amounts of proteins that can be used to treat illnesses.
Which Target Indication Has the Biggest Market Share for RNA Therapeutics?
The advanced solid tumors subsegment is anticipated to hold the largest (~35%) market share in 2035, according to the next generation RNA therapies market analysis. This trend can be attributed to the rising global prevalence of oncological diseases, which continue to pose significant health challenges. Furthermore, the hereditary bone marrow failure syndrome sub-segment is anticipated to register a comparatively higher CAGR in the near term. This growth is driven by the rarity and predominantly monogenic nature of inherited bone marrow failure disorders, coupled with the current lack of effective therapeutic options.
North America: Taking the Lead in the Market with the Highest Share
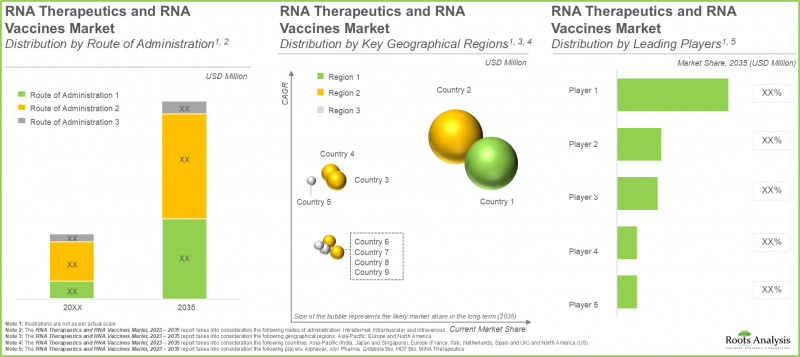
North America is expected to have the largest market share (more than 65%) for next-generation RNA therapies. This is due to significant public funding in RNA biology, which has driven increased clinical activity within the field.
Example Players in Next Generation RNA Therapeutics Market
- AlphaVax
- Arcturus Therapeutics
- BioNTech
- HDT Bio
- MiNA Therapeutics
- VLP Therapeutics
Next Generation RNA Therapeutics Market: Research Coverage
- Market Sizing and Opportunity Analysis: The report features an in-depth analysis of the next generation RNA therapeutics market , focusing on key market segments, including [A] type of modality, [B] type of molecule, [C] therapeutic areas, [D] route of administration [E] and [F] key geographical regions.
- Market Landscape: A comprehensive evaluation of next generation RNA therapeutics and RNA vaccines that are either approved or being evaluated in different stages of development, considering various parameters, such as [A] type of modality, [B] type of molecule, [C] type of delivery vehicle, [D] phase of development [E] therapeutic area and [F] key niche market segments (circRNA and saRNA). Additionally, the chapter includes analysis of various next generation RNA therapeutic and RNA vaccine developers, based on their [G] year of establishment, [H] company size, [I] location of headquarters and [J] most active players (in terms of number of therapies).
- Technology Landscape: A comprehensive evaluation of technologies that are being developed / deployed to support the development of next generation RNA therapeutics and RNA vaccines, considering various parameters, such as [A] class of molecule, [B] type of molecule, [C] capabilities of the technology, [D] therapeutic area and [E] highest phase of development. Additionally, the chapter features analysis of various next generation RNA therapeutic and RNA vaccine technology developers, based on their [F] year of establishment, [G] company size, [H] location of headquarters and [I] operational model.
- Drug Profiles: In-depth profiles of drug candidates that are in advanced stages of development, focusing on [A] details on its developer, [B] drug overview, [C] clinical trial information, [D] clinical trial endpoints, [E] clinical trial results and [F] estimated sales.
- Clinical Trial Analysis: Examination of completed, ongoing, and planned clinical studies of various next generation RNA therapeutics and RNA vaccines, based on parameters like [A] trial registration year, [B] trial status, [C] trial phase, [D] patients enrolled, [E] type of sponsor, [F] therapeutic area, [G] study design, [H] leading organizations (in terms of number of trials), [I] focus area and [J] geography.
- Patent Analysis: Detailed analysis of various patents filed / granted related to next generation RNA therapeutics and RNA vaccines based on [A] type of patent (granted patents, patent applications and others), [B] patent publication year, [C] patent jurisdiction, [D] CPC symbols, [E] emerging focus areas, [F] patent age, [G] leading industry / non-industry players (in terms of number of patents filed / granted) and [H] patent valuation.
- Partnerships and Collaborations: An analysis of partnerships established in this sector based on several relevant parameters, such as the [A] year of partnership, [B] type of partnership, [C] type of molecule, [D] focus of partnership, [E] purpose of partnership, [F] therapeutic area, [G] most active players (in terms of number of partnerships) and [H] the regional distribution of partnership activity in this market.
- Funding and Investment Analysis: A detailed evaluation of the investments made in this domain based on several relevant parameters, such as [A] year of funding, [B] type of funding, [C] type of molecule, [D] amount invested, [E] geography, [F] purpose of funding, [G] stage of development, [H] therapeutic area, [I] most active players (in terms of number and amount of funding instances) and [J] leading investors (in terms of number of funding instances).
- Big Pharma Analysis: A comprehensive examination of various initiatives focused on next generation RNA therapeutics and RNA vaccines undertaken by major pharmaceutical companies based on several relevant parameters, such as [A] number of initiatives, [B] year of initiative, [C] type of initiative, [D] purpose of initiative, [E] focus of initiative and [F] location of headquarters.
Key Questions Answered in this Report
- Which are the leading companies in the next generation RNA therapeutics market?
- Which region dominates the next generation RNA therapeutics market?
- What are the key trends observed in the next generation RNA therapeutics market?
- What factors are likely to influence the evolution of this market?
- What are the primary challenges faced by next generation RNA therapeutics developers?
- What is the current and future market size?
- What is the CAGR of this market?
- How is the current and future market opportunity likely to be distributed across key market segments?
Reasons to Buy this Report
- The report provides a comprehensive market analysis, offering detailed revenue projections of the overall market and its specific sub-segments. This information is valuable to both established market leaders and emerging entrants.
- The report offers stakeholders a comprehensive overview of the market, including key drivers, barriers, opportunities, and challenges. This information empowers stakeholders to stay abreast of market trends and make data-driven decisions to capitalize on growth prospects.
- The report can aid businesses in identifying future opportunities in any sector. It also helps in understanding if those opportunities are worth pursuing.
- The report helps in identifying customer demand by understanding the needs, preferences, and behavior of the target audience in order to tailor products or services effectively.
- The report equips new entrants with requisite information regarding a particular market to help them build successful business strategies.
- The report allows for more effective communication with the audience and in building strong business relations.
Additional Benefits
- Complimentary Excel Data Packs for all Analytical Modules in the Report
- 15% Free Content Customization
- Detailed Report Walkthrough Session with Research Team
- Free Updated report if the report is 6-12 months old or older
TABLE OF CONTENTS
1. BACKGROUND
- 1.1. Context
- 1.2. Project Objectives
2. RESEARCH METHODOLOGY
- 2.1. Chapter Overview
- 2.2. Research Assumptions
- 2.2.1. Market Landscape and Market Trends
- 2.2.2. Market Forecast and Opportunity Analysis
- 2.2.3. Comparative Analysis
- 2.3. Database Building
- 2.3.1. Data Collection
- 2.3.2. Data Validation
- 2.3.3. Data Analysis
- 2.4. Project Methodology
- 2.4.1. Secondary Research
- 2.4.1.1. Annual Reports
- 2.4.1.2. Academic Research Papers
- 2.4.1.3. Company Websites
- 2.4.1.4. Investor Presentations
- 2.4.1.5. Regulatory Filings
- 2.4.1.6. White Papers
- 2.4.1.7. Industry Publications
- 2.4.1.8. Conferences and Seminars
- 2.4.1.9. Government Portals
- 2.4.1.10. Media and Press Releases
- 2.4.1.11. Newsletters
- 2.4.1.12. Industry Databases
- 2.4.1.13. Roots Proprietary Databases
- 2.4.1.14. Paid Databases and Sources
- 2.4.1.15. Social Media Portals
- 2.4.1.16. Other Secondary Sources
- 2.4.2. Primary Research
- 2.4.2.1. Types of Primary Research
- 2.4.2.1.1. Qualitative Research
- 2.4.2.1.2. Quantitative Research
- 2.4.2.1.3. Hybrid Approach
- 2.4.2.2. Advantages of Primary Research
- 2.4.2.3. Techniques for Primary Research
- 2.4.2.3.1. Interviews
- 2.4.2.3.2. Surveys
- 2.4.2.3.3. Focus Groups
- 2.4.2.3.4. Observational Research
- 2.4.2.3.5. Social Media Interactions
- 2.4.2.4. Key Opinion Leaders Considered in Primary Research
- 2.4.2.4.1. Company Executives (CXOs)
- 2.4.2.4.2. Board of Directors
- 2.4.2.4.3. Company Presidents and Vice Presidents
- 2.4.2.4.4. Research and Development Heads
- 2.4.2.4.5. Technical Experts
- 2.4.2.4.6. Subject Matter Experts
- 2.4.2.4.7. Scientists
- 2.4.2.4.8. Doctors and Other Healthcare Providers
- 2.4.2.5. Ethics and Integrity
- 2.4.2.5.1. Research Ethics
- 2.4.2.5.2. Data Integrity
- 2.4.2.1. Types of Primary Research
- 2.4.3. Analytical Tools and Databases
- 2.4.1. Secondary Research
- 2.5. Robust Quality Control
3. MARKET DYNAMICS
- 3.1. Chapter Overview
- 3.2. Forecast Methodology
- 3.2.1. Top-down Approach
- 3.2.2. Bottom-up Approach
- 3.2.3. Hybrid Approach
- 3.3. Market Assessment Framework
- 3.3.1. Total Addressable Market (TAM)
- 3.3.2. Serviceable Addressable Market (SAM)
- 3.3.3. Serviceable Obtainable Market (SOM)
- 3.3.4. Currently Acquired Market (CAM)
- 3.4. Forecasting Tools and Techniques
- 3.4.1. Qualitative Forecasting
- 3.4.2. Correlation
- 3.4.3. Regression
- 3.4.4. Extrapolation
- 3.4.5. Convergence
- 3.4.6. Sensitivity Analysis
- 3.4.7. Scenario Planning
- 3.4.8. Data Visualization
- 3.4.9. Time Series Analysis
- 3.4.10. Forecast Error Analysis
- 3.5. Key Considerations
- 3.5.1. Demographics
- 3.5.2. Government Regulations
- 3.5.3. Reimbursement Scenarios
- 3.5.4. Market Access
- 3.5.5. Supply Chain
- 3.5.6. Industry Consolidation
- 3.5.7. Pandemic / Unforeseen Disruptions Impact
- 3.6. Limitations
4. MACRO-ECONOMIC INDICATORS
- 4.1. Chapter Overview
- 4.2. Market Dynamics
- 4.2.1. Time Period
- 4.2.1.1. Historical Trends
- 4.2.1.2. Current and Forecasted Estimates
- 4.2.2. Currency Coverage
- 4.2.2.1. Major Currencies Affecting the Market
- 4.2.2.2. Factors Affecting Currency Fluctuations on the Industry
- 4.2.2.3. Impact of Currency Fluctuations on the Industry
- 4.2.3. Foreign Currency Exchange Rate
- 4.2.3.1. Impact of Foreign Exchange Rate Volatility on the Market
- 4.2.3.2. Strategies for Mitigating Foreign Exchange Risk
- 4.2.4. Recession
- 4.2.4.1. Assessment of Current Economic Conditions and Potential Impact on the Market
- 4.2.4.2. Historical Analysis of Past Recessions and Lessons Learnt
- 4.2.5. Inflation
- 4.2.5.1. Measurement and Analysis of Inflationary Pressures in the Economy
- 4.2.5.2. Potential Impact of Inflation on the Market Evolution
- 4.2.6. Interest Rates
- 4.2.6.1. Interest Rates and Their Impact on the Market
- 4.2.6.2. Strategies for Managing Interest Rate Risk
- 4.2.7. Commodity Flow Analysis
- 4.2.7.1. Type of Commodity
- 4.2.7.2. Origins and Destinations
- 4.2.7.3. Values and Weights
- 4.2.7.4. Modes of Transportation
- 4.2.8. Global Trade Dynamics
- 4.2.8.1. Import Scenario
- 4.2.8.2. Export Scenario
- 4.2.8.3. Trade Policies
- 4.2.8.4. Strategies for Mitigating the Risks Associated with Trade Barriers
- 4.2.8.5. Impact of Trade Barriers on the Market
- 4.2.9. War Impact Analysis
- 4.2.9.1. Russian-Ukraine War
- 4.2.9.2. Israel-Hamas War
- 4.2.10. COVID Impact / Related Factors
- 4.2.10.1. Global Economic Impact
- 4.2.10.2. Industry-specific Impact
- 4.2.10.3. Government Response and Stimulus Measures
- 4.2.10.4. Future Outlook and Adaptation Strategies
- 4.2.11. Other Indicators
- 4.2.11.1. Fiscal Policy
- 4.2.11.2. Consumer Spending
- 4.2.11.3. Gross Domestic Product
- 4.2.11.4. Employment
- 4.2.11.5. Taxes
- 4.2.11.6. Stock Market Performance
- 4.2.11.7. Cross Border Dynamics
- 4.2.1. Time Period
- 4.3. Conclusion
5. EXECUTIVE SUMMARY
- 5.1. Executive Summary: Market Landscape
- 5.2. Executive Summary: Market Trends
- 5.3. Executive Summary: Market Forecast and Opportunity Analysis
6. INTRODUCTION
- 6.1. Overview of Next Generation RNA Therapeutics and Vaccines
- 6.2. Evolution of Next Generation RNA Therapeutics and Vaccines
- 6.3. Types of Next Generation RNA Molecules
- 6.4. Key Aspects of Next Generation RNA Molecules
- 6.5. Key Challenges Associated with Traditional RNA Modalities
- 6.6. Advantages of Using Next Generation RNA Modalities
7. MARKET LANDSCAPE: RNA THERAPEUTICS AND RNA VACCINES
- 7.1. Overview of RNA Therapeutics and RNA Vaccines Therapies
- 7.1.1. Analysis by Type of Modality
- 7.1.2. Analysis by Type of Molecule
- 7.1.3. Analysis by Delivery Vehicle
- 7.1.4. Analysis by Stage of Development
- 7.1.5. Analysis by Therapeutic Area
- 7.1.6. Most Active Players: Analysis by Number of Therapies
- 7.2. RNA Therapeutics and RNA Vaccines: Clinical Stage Therapies Landscape
- 7.2.1. Analysis by Phase of Development
- 7.2.2. Analysis by Route of Administration
- 7.2.3. Analysis by Therapeutic Area
- 7.3. RNA Therapeutics and RNA Vaccines: Therapy Developers Landscape
- 7.3.1. Analysis by Year of Establishment
- 7.3.2. Analysis by Company Size
- 7.3.3. Analysis by Location of Headquarters
- 7.4. RNA Therapeutics and RNA Vaccines: Self-amplifying RNA Therapies Landscape
- 7.4.1. Analysis by Phase of Development
- 7.4.2. Analysis by Therapeutic Area
- 7.4.3. Most Active Players: Analysis by Number of Therapies
- 7.5. RNA Therapeutics and RNA Vaccines: Circular RNA Therapies Landscape
- 7.5.1. Analysis by Phase of Development
- 7.5.2. Analysis by Therapeutic Area
- 7.5.3. Most Active Players: Analysis by Number of Therapies
8. TECHNOLOGY LANDSCAPE
- 8.1. Overview of RNA Therapeutics and RNA Vaccines Technologies
- 8.1.1. Analysis by Class of Molecule
- 8.1.2. Analysis by Type of Molecule
- 8.1.3. Analysis by Capabilities of the Technology
- 8.1.4. Analysis by Therapeutic Area
- 8.1.5. Analysis by Highest Stage of Development
- 8.1.6. Analysis by Class of Molecule and Therapeutic Area
- 8.1.7. Analysis by Class of Molecule and Highest Stage of Development
- 8.1.8. Analysis by Type of Molecule and Capabilities of the Technology
- 8.2. RNA Therapeutics and RNA Vaccines: Next Generation RNA Technology / Platform Developers Landscape
- 8.2.1. Analysis by Year of Establishment
- 8.2.2. Analysis by Company Size
- 8.2.3. Analysis by Location of Headquarters
- 8.2.4. Analysis by Operational Model
9. DRUG PROFILES
- 9.1. ARCT-154
- 9.1.1. Company Overview
- 9.1.2. Drug Overview
- 9.1.3. Clinical Trial Information
- 9.1.4. Clinical Trial Endpoints
- 9.1.5. Clinical Trial Results
- 9.2. Gemcovac
- 9.3. VLPCOV-01
- 9.4. AVX901
- 9.5. BNT161
- 9.6. MTL-CEBPA + Sorafenib
10. CLINICAL TRIAL ANALYSIS
- 10.1. Methodology and Key Parameters
- 10.2. RNA Therapeutics and RNA Vaccines: Clinical Trial Analysis
- 10.2.1. Analysis by Trial Registration Year
- 10.2.2. Analysis by Trial Status
- 10.2.3. Analysis by Trial Registration Year and Trial Status
- 10.2.4. Analysis by Trial Phase
- 10.2.5. Analysis of Patients Enrolled by Trial Phase
- 10.2.6. Analysis of Patients Enrolled by Trial Registration Year
- 10.2.7. Analysis by Study Design
- 10.2.8. Analysis by Target Patient Population
- 10.2.9. Analysis by Patient Gender
- 10.2.10. Analysis by Type of Sponsor / Collaborator
- 10.2.11. Analysis by Therapeutic Area
- 10.2.12. Most Active Players: Analysis by Number of Trials
- 10.2.13. Analysis by Geography
11. PATENT ANALYSIS
- 11.1. Methodology and Key Parameters
- 11.2. RNA Therapeutics and RNA Vaccines: Patent Analysis
- 11.2.1. Analysis by Publication Year
- 11.2.2. Analysis by Type of Patent
- 11.2.3. Analysis of Granted Patents and Patent Applications by Publication Year
- 11.2.4. Analysis by Type of Applicant
- 11.2.5. Analysis by Application Year
- 11.2.6. Analysis by Patent Jurisdiction (Region)
- 11.2.7. Analysis by Patent Jurisdiction (Country)
- 11.2.8. Analysis by Patent Age
- 11.2.9. Leading Industry Players: Analysis by Number of Patents
- 11.2.10. Leading Non-Industry Players: Analysis by Number of Patents
- 11.2.11. Leading Individual Assignees: Analysis by Number of Patents
- 11.2.12. Analysis by CPC Symbols
- 11.3. Patent Benchmarking Analysis
- 11.4. Patent Valuation Analysis
12. PARTNERSHIPS AND COLLABORATIONS
- 12.1. Partnership Models
- 12.2. RNA Therapeutics and RNA Vaccines: Partnerships and Collaborations
- 12.2.1. Analysis by Year of Partnership
- 12.2.2. Analysis by Type of Partnership
- 12.2.3. Analysis by Year and Type of Partnership
- 12.2.4. Analysis by Year of Partnership and Type of Molecule
- 12.2.5. Analysis by Purpose of Partnership
- 12.2.6. Analysis by Focus Area of Partnership
- 12.2.7. Analysis by Therapeutic Area
- 12.2.8. Most Active Players: Analysis by Number of Partnerships
- 12.2.9. Analysis by Geography
- 12.2.9.1. Local and International Deals
- 12.2.9.2. Intracontinental and Intercontinental Deals
13. FUNDING AND INVESTMENT ANALYSIS
- 13.1. Funding Models
- 13.2. Funding Lifecycle Analysis
- 13.3. Investment Case: Risk and Return
- 13.4. RNA Therapeutics and RNA Vaccines: Funding and Investment Analysis
- 13.4.1. Analysis by Year of Funding
- 13.4.2. Analysis by Type of Funding
- 13.4.3. Analysis by Year and Type of Funding
- 13.4.4. Analysis of Amount Invested by Year of Funding
- 13.4.5. Analysis of Amount Invested by Type of Funding
- 13.4.6. Analysis by Geography
- 13.4.7. Analysis by Type of Molecule
- 13.4.8. Analysis by Purpose of Funding
- 13.4.9. Analysis by Stage of Development
- 13.4.10. Analysis by Therapeutic Area
- 13.4.11. Most Active Players: Analysis by Number of Funding Instances
- 13.4.12. Most Active Players: Analysis by Amount Invested
- 13.4.13. Most Active Investors: Analysis by Number of Funding Instances
- 13.5. Evolution and Relative Assessment of Funding Models
- 13.6. Summary of Funding and Investment Opportunities
14. BIG PHARMA INITIATIVES
- 14.1. Analysis Methodology
- 14.2. RNA Therapeutics and RNA Vaccines: Big Pharma Initiatives
- 14.2.1. Most Active Players: Analysis by Number of Big Pharma Initiatives
- 14.2.2. Analysis by Year of Initiative
- 14.2.3. Analysis by Type of Initiative
- 14.2.4. Analysis by Focus Area of Initiative
- 14.2.5. Analysis by Purpose of Initiative
- 14.2.6. Analysis by Type of Molecule
- 14.2.7. Analysis by Therapeutic Area
- 14.2.8. Analysis by Location of Headquarters
15. GLOBAL NEXT GENERATION RNA THERAPEUTICS MARKET
- 15.1. Forecast Model
- 15.2. Key Assumptions
- 15.3. Forecast Methodology
- 15.4. Global Next Generation RNA Therapeutics Market: Forecasted Estimates (till 2035)
- 15.4.1. Scenario Analysis
- 15.4.1.1. Conservative Scenario
- 15.4.1.2. Optimistic Scenario
- 15.4.1. Scenario Analysis
- 15.5. Key Market Segmentations
16. NEXT GENERATION RNA THERAPEUTICS MARKET, BY TYPE OF MODALITY
- 16.1. Next Generation RNA Therapeutics Market: Distribution by Type of Modality
- 16.1.1. Next Generation RNA Therapeutics Market for Therapeutics: Forecasted Estimates (till 2035)
- 16.1.2. Next Generation RNA Therapeutics Market for Vaccines: Forecasted Estimates (till 2035)
17. NEXT GENERATION RNA THERAPEUTICS MARKET, BY TYPE OF MOLECULE
- 17.1. Next Generation RNA Therapeutics Market: Distribution by Type of Molecule
- 17.1.1. Next Generation RNA Therapeutics Market for sacRNA: Forecasted Estimates (till 2035)
- 17.1.2. Next Generation RNA Therapeutics Market for saRNA: Forecasted Estimates (till 2035)
- 17.1.3. Next Generation RNA Therapeutics Market for circRNA: Forecasted Estimates (till 2035)
18. NEXT GENERATION RNA THERAPEUTICS MARKET, BY TARGET INDICATION
- 18.1. Next Generation RNA Therapeutics Market: Distribution by Target Indication
- 18.1.1. Next Generation RNA Therapeutics Market for Hepatocellular Carcinoma: Forecasted Estimates (till 2035)
- 18.1.2. Next Generation RNA Therapeutics Market for Seasonal Influenza: Forecasted Estimates (till 2035)
- 18.1.3. Next Generation RNA Therapeutics Market for Advanced Solid Tumors: Forecasted Estimates (till 2035)
- 18.1.4. Next Generation RNA Therapeutics Market for Radiation-Induced Xerostomia and Hyposalivation: Forecasted Estimates (till 2035)
- 18.1.5. Next Generation RNA Therapeutics Market for Inherited Bone Marrow Failure Syndromes: Forecasted Estimates (till 2035)
19. NEXT GENERATION RNA THERAPEUTICS MARKET, BY ROUTE OF ADMINISTRATION
- 19.1. Next Generation RNA Therapeutics Market: Distribution by Route of Administration
- 19.1.1. Next Generation RNA Therapeutics Market for Intravenous Route: Forecasted Estimates (till 2035)
- 19.1.2. Next Generation RNA Therapeutics Market for Intramuscular Route: Forecasted Estimates (till 2035)
- 19.1.3. Next Generation RNA Therapeutics Market for Intratumoral Route: Forecasted Estimates (till 2035)
- 19.1.4. Next Generation RNA Therapeutics Market for Intraductal Route: Forecasted Estimates (till 2035)
20. NEXT GENERATION RNA THERAPEUTICS MARKET, BY GEOGRAPHICAL REGIONS
- 20.1. Next Generation RNA Therapeutics Market: Distribution by Geographical Regions
- 20.1.1. Next Generation RNA Therapeutics Market in North America: Forecasted Estimates (till 2035)
- 20.1.1.1. Next Generation RNA Therapeutics Market in the US: Forecasted Estimates (till 2035)
- 20.1.2. Next Generation RNA Therapeutics Market in Europe: Forecasted Estimates (till 2035)
- 20.1.2.1. Next Generation RNA Therapeutics Market in the UK: Forecasted Estimates (till 2035)
- 20.1.2.2. Next Generation RNA Therapeutics Market in Germany: Forecasted Estimates (till 2035)
- 20.1.2.3. Next Generation RNA Therapeutics Market in France: Forecasted Estimates (till 2035)
- 20.1.2.4. Next Generation RNA Therapeutics Market in Italy: Forecasted Estimates (till 2035)
- 20.1.2.5. Next Generation RNA Therapeutics Market in Spain: Forecasted Estimates (till 2035)
- 20.1.2.6. Next Generation RNA Therapeutics Market in Rest of Europe: Forecasted Estimates (till 2035)
- 20.1.3. Next Generation RNA Therapeutics Market in Asia-Pacific: Forecasted Estimates (till 2035)
- 20.1.3.1. Next Generation RNA Therapeutics Market in Singapore: Forecasted Estimates (till 2035)
- 20.1.1. Next Generation RNA Therapeutics Market in North America: Forecasted Estimates (till 2035)
21. NEXT GENERATION RNA THERAPEUTICS MARKET, BY LEADING PLAYERS
22. NEXT GENERATION RNA THERAPEUTICS MARKET, SALES FORECAST OF DRUGS
- 22.1. Next Generation RNA Therapeutics: Drug Sales Forecast
- 22.1.1. MTL-CEBPA
- 22.1.2. BNT 161 / PF-07926307
- 22.1.3. STX-001
- 22.1.4. RXRG001
- 22.1.5. EXG-34217
23. MARKET OPPORTUNITY ANALYSIS: NORTH AMERICA
- 23.1. Next Generation RNA Therapeutics Market in North America: Distribution by Type of Modality
- 23.1.1. Next Generation RNA Therapeutics Market in North America for Therapeutics: Forecasted Estimates (till 2035)
- 23.1.2. Next Generation RNA Therapeutics Market in North America for Vaccines: Forecasted Estimates (till 2035)
- 23.2. Next Generation RNA Therapeutics Market in North America: Distribution by Type of Molecule
- 23.2.1. Next Generation RNA Therapeutics Market in North America for sacRNA: Forecasted Estimates (till 2035)
- 23.2.2. Next Generation RNA Therapeutics Market in North America for saRNA: Forecasted Estimates (till 2035)
- 23.2.3. Next Generation RNA Therapeutics Market in North America for circRNA: Forecasted Estimates (till 2035)
- 23.3. Next Generation RNA Therapeutics Market in North America: Distribution by Target Indication
- 23.3.1. Next Generation RNA Therapeutics Market in North America for Hepatocellular Carcinoma: Forecasted Estimates (till 2035)
- 23.3.2. Next Generation RNA Therapeutics Market in North America for Seasonal Influenza: Forecasted Estimates (till 2035)
- 23.3.3. Next Generation RNA Therapeutics Market in North America for Advanced Solid Tumors: Forecasted Estimates (till 2035)
- 23.3.4. Next Generation RNA Therapeutics Market in North America for Radiation-Induced Xerostomia and Hyposalivation: Forecasted Estimates (till 2035)
- 23.3.5. Next Generation RNA Therapeutics Market in North America for Inherited Bone Marrow Failure Syndromes: Forecasted Estimates (till 2035)
- 23.4. Next Generation RNA Therapeutics Market in North America: Distribution by Route of Administration
- 23.4.1. Next Generation RNA Therapeutics Market in North America for Intravenous Route: Forecasted Estimates (till 2035)
- 23.4.2. Next Generation RNA Therapeutics Market in North America for Intramuscular Route: Forecasted Estimates (till 2035)
- 23.4.3. Next Generation RNA Therapeutics Market in North America for Intratumoral Route: Forecasted Estimates (till 2035)
- 23.4.4. Next Generation RNA Therapeutics Market in North America for Intraductal Route: Forecasted Estimates (till 2035)
24. MARKET OPPORTUNITY ANALYSIS: EUROPE
- 24.1. Next Generation RNA Therapeutics Market in Europe: Distribution by Type of Modality
- 24.1.1. Next Generation RNA Therapeutics Market in Europe for Therapeutics: Forecasted Estimates (till 2035)
- 24.1.2. Next Generation RNA Therapeutics Market in Europe for Vaccines: Forecasted Estimates (till 2035)
- 24.2. Next Generation RNA Therapeutics Market in Europe: Distribution by Type of Molecule
- 24.2.1. Next Generation RNA Therapeutics Market in Europe for sacRNA: Forecasted Estimates (till 2035)
- 24.2.2. Next Generation RNA Therapeutics Market in Europe for saRNA: Forecasted Estimates (till 2035)
- 24.2.3. Next Generation RNA Therapeutics Market in Europe for circRNA: Forecasted Estimates (till 2035)
- 24.3. Next Generation RNA Therapeutics Market in Europe: Distribution by Target Indication
- 24.3.1. Next Generation RNA Therapeutics Market in Europe for Hepatocellular Carcinoma: Forecasted Estimates (till 2035)
- 24.3.2. Next Generation RNA Therapeutics Market in Europe for Seasonal Influenza: Forecasted Estimates (till 2035)
- 24.3.3. Next Generation RNA Therapeutics Market in Europe for Advanced Solid Tumors: Forecasted Estimates (till 2035)
- 24.3.4. Next Generation RNA Therapeutics Market in Europe for Radiation-Induced Xerostomia and Hyposalivation: Forecasted Estimates (till 2035)
- 24.3.5. Next Generation RNA Therapeutics Market in Europe for Inherited Bone Marrow Failure Syndromes: Forecasted Estimates (till 2035)
- 24.4. Next Generation RNA Therapeutics Market in Europe: Distribution by Route of Administration
- 24.4.1. Next Generation RNA Therapeutics Market in Europe for Intravenous Route: Forecasted Estimates (till 2035)
- 24.4.2. Next Generation RNA Therapeutics Market in Europe for Intramuscular Route: Forecasted Estimates (till 2035)
- 24.4.3. Next Generation RNA Therapeutics Market in Europe for Intratumoral Route: Forecasted Estimates (till 2035)
- 24.4.4. Next Generation RNA Therapeutics Market in Europe for Intraductal Route: Forecasted Estimates (till 2035)
25. MARKET OPPORTUNITY ANALYSIS: ASIA-PACIFIC
- 25.1. Next Generation RNA Therapeutics Market in Asia-Pacific: Distribution by Type of Modality
- 25.1.1. Next Generation RNA Therapeutics Market in Asia-Pacific for Therapeutics: Forecasted Estimates (till 2035)
- 25.1.2. Next Generation RNA Therapeutics Market in Asia-Pacific for Vaccines: Forecasted Estimates (till 2035)
- 25.2. Next Generation RNA Therapeutics Market in Asia-Pacific: Distribution by Type of Molecule
- 25.2.1. Next Generation RNA Therapeutics Market in Asia-Pacific for sacRNA: Forecasted Estimates (till 2035)
- 25.2.2. Next Generation RNA Therapeutics Market in Asia-Pacific for saRNA: Forecasted Estimates (till 2035)
- 25.2.3. Next Generation RNA Therapeutics Market in Asia-Pacific for circRNA: Forecasted Estimates (till 2035)
- 25.3. Next Generation RNA Therapeutics Market in Asia-Pacific: Distribution by Target Indication
- 25.3.1. Next Generation RNA Therapeutics Market in Asia-Pacific for Hepatocellular Carcinoma: Forecasted Estimates (till 2035)
- 25.3.2. Next Generation RNA Therapeutics Market in Asia-Pacific for Seasonal Influenza: Forecasted Estimates (till 2035)
- 25.3.3. Next Generation RNA Therapeutics Market in Asia-Pacific for Advanced Solid Tumors: Forecasted Estimates (till 2035)
- 25.3.4. Next Generation RNA Therapeutics Market in Asia-Pacific for Radiation-Induced Xerostomia and Hyposalivation: Forecasted Estimates (till 2035)
- 25.3.5. Next Generation RNA Therapeutics Market in Asia-Pacific for Inherited Bone Marrow Failure Syndromes: Forecasted Estimates (till 2035)
- 25.4. Next Generation RNA Therapeutics Market in Asia-Pacific: Distribution by Route of Administration
- 25.4.1. Next Generation RNA Therapeutics Market in Asia-Pacific for Intravenous Route: Forecasted Estimates (till 2035)
- 25.4.2. Next Generation RNA Therapeutics Market in Asia-Pacific for Intramuscular Route: Forecasted Estimates (till 2035)
- 25.4.3. Next Generation RNA Therapeutics Market in Asia-Pacific for Intratumoral Route: Forecasted Estimates (till 2035)
- 25.4.4. Next Generation RNA Therapeutics Market in Asia-Pacific for Intraductal Route: Forecasted Estimates (till 2035)
26. CONCLUDING INSIGHTS
27. APPENDIX I: TABULATED DATA
28. APPENDIX II: LIST OF COMPANIES AND ORGANIZATIONS
List of Tables
- Table 6.1 List of Next Generation RNA Therapeutics and RNA Vaccines
- Table 6.2 List of Clinical Stage Next Generation RNA Therapeutics and RNA Vaccines
- Table 6.3 List of Next Generation RNA Therapeutic and RNA Vaccine Developers
- Table 7.1 List of Next Generation RNA Technologies
- Table 7.2 List of Next Generation RNA Technology / Platform Developers
- Table 8.1 Gemcovac(R): Developer Overview
- Table 8.2 Gemcovac(R): Drug Overview
- Table 8.3 Gemcovac(R): Clinical Trial Information
- Table 8.4 Gemcovac(R): Clinical Trial Endpoints
- Table 8.5 Gemcovac(R): Clinical Trial Results
- Table 8.6 ATYR1923: Developer Overview
- Table 8.7 ATYR1923: Drug Overview
- Table 8.8 ATYR1923: Clinical Trial Information
- Table 8.9 ATYR1923: Clinical Trial Endpoints
- Table 8.10 ATYR1923: Clinical Trial Results
- Table 8.11 ARCT-154: Developer Overview
- Table 8.12 ARCT-154: Drug Overview
- Table 8.13 ARCT-154: Clinical Trial Information
- Table 8.14 ARCT-154: Clinical Trial Endpoints
- Table 8.15 ARCT-154: Clinical Trial Results
- Table 8.16 GRT-C901: Developer Overview
- Table 8.17 GRT-C901: Drug Overview
- Table 8.18 GRT-C901: Clinical Trial Information
- Table 8.19 GRT-C901: Clinical Trial Endpoints
- Table 8.20 GRT-C901: Clinical Trial Results
- Table 8.21 VLPCOV-01: Developer Overview
- Table 8.22 VLPCOV-01: Drug Overview
- Table 8.23 AVX-901: Developer Overview
- Table 8.24 AVX-901: Drug Overview
- Table 8.25 AVX-901: Clinical Trial Information
- Table 8.26 AVX-901: Clinical Trial Endpoints
- Table 8.27 AVX-901: Clinical Trial Results
- Table 8.28 MTL-CEBPA + Sorafenib: Developer Overview
- Table 8.29 MTL-CEBPA + Sorafenib: Drug Overview
- Table 8.30 MTL-CEBPA + Sorafenib: Clinical Trial Information
- Table 8.31 MTL-CEBPA + Sorafenib: Clinical Trial Endpoints
- Table 8.32 MTL-CEBPA + Sorafenib: Clinical Trial Results
- Table 8.33 SLATE: Developer Overview
- Table 8.34 SLATE: Drug Overview
- Table 8.35 SLATE: Clinical Trial Information
- Table 8.36 SLATE: Clinical Trial Endpoints
- Table 8.37 SLATE: Clinical Trial Results
- Table 9.1 RNA Therapeutics and RNA Vaccines: List of Clinical Trials
- Table 10.1 RNA Therapeutics and RNA Vaccines: List of Filed / Granted Patents, since 2019
- Table 11.1 RNA Therapeutics and RNA Vaccines: List of Partnerships and Collaborations, since 2019
- Table 12.1 RNA Therapeutics and RNA Vaccines: List of Funding and Investments, since 2019
- Table 13.1 RNA Therapeutics and RNA Vaccines: List of Big Pharma Initiatives, since 2019
- Table 14.1 Next Generation RNA Therapeutics Market :Expected Launch Year of Forecasted Drug Candidates
- Table 22.1 Next Generation RNA Therapies: Distribution by Type of Modality
- Table 22.2 Next Generation RNA Therapies: Distribution by Type of Molecule
- Table 22.3 Next Generation RNA Therapies: Distribution by Delivery Vehicle
- Table 22.4 Next Generation RNA Therapies: Distribution by Phase of Development
- Table 22.5 Next Generation RNA Therapies: Distribution by Therapeutic Area
- Table 22.6 Most Active Players: Distribution by Number of Therapies
- Table 22.7 Clinical Stage Therapies: Distribution by Phase of Development
- Table 22.8 Clinical Stage Therapies: Distribution by Route of Administration
- Table 22.9 Clinical Stage Therapies: Distribution by Therapeutic Area
- Table 22.10 Therapy Developer Landscape: Distribution by Year of Establishment
- Table 22.11 Therapy Developer Landscape: Distribution by Company Size
- Table 22.12 Therapy Developer Landscape: Distribution by Location of Headquarters
- Table 22.13 circRNA Therapies: Distribution by Phase of Development
- Table 22.14 circRNA Therapies: Distribution by Therapeutic Area
- Table 22.15 Most Active Players: Distribution by Number of circRNA Therapies
- Table 22.16 saRNA Therapies: Distribution by Phase of Development
- Table 22.17 saRNA Therapies: Distribution by Therapeutic Area
- Table 22.18 Most Active Players: Distribution by Number of saRNA Therapies
- Table 22.19 Next Generation RNA Technologies: Distribution by Class of Molecule
- Table 22.20 Next Generation RNA Technologies: Distribution by Type of Molecule
- Table 22.21 Next Generation RNA Technologies: Distribution by Capabilities of the Technology
- Table 22.22 Next Generation RNA Technologies: Distribution by Therapeutic Area
- Table 22.23 Next Generation RNA Technologies: Distribution by Highest Phase of Development
- Table 22.24 Technology Developer Landscape: Distribution by Year of Establishment
- Table 22.25 Technology Developer Landscape: Distribution by Company Size
- Table 22.26 Technology Developer Landscape: Distribution by Location of Headquarters
- Table 22.27 Technology Developer Landscape: Distribution by Operational Model
- Table 22.28 Gemcovac(R): Estimated Sales
- Table 22.29 ATYR1923: Estimated Sales
- Table 22.30 ARCT-154: Estimated Sales
- Table 22.31 GRT-C901: Estimated Sales
- Table 22.32 VLPCOV-01: Estimated Sales
- Table 22.33 AVX901: Estimated Sales
- Table 22.34 MTL-CEBPA + Sorafenib: Estimated Sales
- Table 22.35 SLATE: Estimated Sales
- Table 22.36 Clinical Trial Analysis: Cumulative Year-wise Trend
- Table 22.37 Clinical Trial Analysis: Distribution by Trial Status
- Table 22.38 Clinical Trial Analysis: Distribution by Trial Registration Year and Trial Status
- Table 22.39 Clinical Trial Analysis: Distribution by Trial Phase
- Table 22.40 Clinical Trial Analysis: Distribution by Patients Enrolled
- Table 22.41 Clinical Trial Analysis: Distribution by Type of Sponsor
- Table 22.42 Clinical Trial Analysis: Distribution by Therapeutic Area
- Table 22.43 Clinical Trial Analysis: Distribution by Study Design
- Table 22.44 Leading Organizations: Distribution by Number of Trials
- Table 22.45 Clinical Trial Analysis: Distribution by Focus Area
- Table 22.46 Clinical Trial Analysis: Distribution by Geography
- Table 22.47 Patent Analysis: Distribution by Type of Patent
- Table 22.48 Patent Analysis: Cumulative Year-wise Trend, since 2019
- Table 22.49 Patent Analysis: Distribution by Patent Jurisdiction
- Table 22.50 Patent Jurisdiction: North American Scenario
- Table 22.51 Patent Jurisdiction: European Scenario
- Table 22.52 Patent Jurisdiction: Asia-Pacific Scenario
- Table 22.53 Patent Analysis: Distribution by Patent Age
- Table 22.54 Patent Analysis: Distribution by CPC Symbols
- Table 22.55 Leading Industry Players: Distribution by Number of Patents
- Table 22.56 Leading Non-Industry Players: Distribution by Number of Patents
- Table 22.57 Patent Analysis: Distribution by Patent Characteristics
- Table 22.58 RNA Therapeutics and RNA Vaccines: Patent Valuation Analysis
- Table 22.59 Partnerships and Collaborations: Cumulative Year-wise Trend, since 2019
- Table 22.60 Partnerships and Collaborations: Distribution by Type of Partnership
- Table 22.61 Partnerships and Collaborations: Distribution by Year and Type of Partnership, since 2019
- Table 22.62 Partnerships and Collaborations: Distribution by Year and Type of Molecule, since 2019
- Table 22.63 Partnerships and Collaborations: Distribution by Focus of Partnership
- Table 22.64 Partnerships and Collaborations: Distribution by Purpose of Partnership
- Table 22.65 Partnerships and Collaborations: Distribution by Therapeutic Area
- Table 22.66 Most Active Players: Distribution by Number of Partnerships
- Table 22.67 Partnerships and Collaborations: Local and International Deals
- Table 22.68 Partnerships and Collaborations: Intercontinental and Intracontinental Deals
- Table 22.69 Funding and Investment Analysis: Cumulative Year-wise Trend, since 2019
- Table 22.70 Funding and Investment Analysis: Distribution by Type of Funding
- Table 22.71 Funding and Investment Analysis: Distribution by Type of Molecule
- Table 22.72 Funding and Investment Analysis: Cumulative Amount Invested by Year, since 2019 (USD Million)
- Table 22.73 Funding and Investment Analysis: Distribution of Amount Invested by Type of Funding (USD Million)
- Table 22.74 Funding and Investment Analysis: Distribution of Amount Invested by Geography (USD Million)
- Table 22.75 Funding and Investment Analysis: Distribution by Year and Type of Funding, since 2019
- Table 22.76 Funding and Investment Analysis: Distribution by Purpose of Funding
- Table 22.77 Funding and Investment Analysis: Distribution by Stage of Development
- Table 22.78 Funding and Investment Analysis: Distribution by Therapeutic Area
- Table 22.79 Most Active Players: Distribution by Number of Funding Instances
- Table 22.80 Most Active Players: Distribution by Amount Invested (USD Million)
- Table 22.81 Leading Investors: Distribution by Number of Funding Instances
- Table 22.82 Big Pharma Initiatives: Distribution by Number of Initiatives
- Table 22.83 Big Pharma Initiatives: Cumulative Distribution by Year of Initiative, since 2019
- Table 22.84 Big Pharma Initiatives: Distribution by Type of Initiative
- Table 22.85 Big Pharma Initiatives: Cumulative Distribution by Purpose of Initiative
- Table 22.86 Big Pharma Initiatives: Cumulative Year-wise Trend, since 2019
- Table 22.87 Big Pharma Initiatives: Distribution by Focus of Initiative
- Table 22.88 Big Pharma Initiatives: Distribution by Location of Headquarters of Big Pharma Players
- Table 22.89 Global Next Generation RNA Therapeutics Market, Forecasted Estimates (till 2035), Base Scenario (USD Million)
- Table 22.90 Global Next Generation RNA Therapeutics Market, Forecasted Estimates (till 2035), Conservative Scenario (USD Million)
- Table 22.91 Global Next Generation RNA Therapeutics Market, Forecasted Estimates (till 2035), Optimistic Scenario (USD Million)
- Table 22.92 Global Next Generation RNA Therapeutics Market: Distribution by Type of Modality, 2023, 2028 and 2035 (USD Million)
- Table 22.93 Global RNA Therapeutics Market, Forecasted Estimates (till 2035) (USD Million)
- Table 22.94 Global RNA Vaccines Market, Forecasted Estimates (till 2035) (USD Million)
- Table 22.95 Global Next Generation RNA Therapeutics Market: Distribution by Type of Molecule, 2023, 2028 and 2035 (USD Million)
- Table 22.96 Global repRNA Therapeutics Vaccines Market, Forecasted Estimates (till 2035) (USD Million)
- Table 22.97 Global saRNA Therapeutics and Vaccines Market, Forecasted Estimates (till 2035) (USD Million)
- Table 22.98 Global sacRNA Therapeutics and Vaccines Market, Forecasted Estimates (till 2035) (USD Million)
- Table 22.99 Global sa-mRNA Therapeutics and Vaccines Market, Forecasted Estimates (till 2035) (USD Million)
- Table 22.100 Global tRNA Therapeutics and Vaccines Market, Forecasted Estimates (till 2035) (USD Million)
- Table 22.101 Global Next Generation RNA Therapeutics Market :Distribution by Therapeutic Area, 2023, 2028 and 2035 (USD Million)
- Table 22.102 Global Next Generation RNA Therapeutics Market for Infectious Diseases, Forecasted Estimates (till 2035) (USD Million)
- Table 22.103 Global Next Generation RNA Therapeutics Market for Oncological Disorders, Forecasted Estimates (till 2035) (USD Million)
- Table 22.104 Global Next Generation RNA Therapeutics Market for Pulmonary Disorders, Forecasted Estimates (till 2035) (USD Million)
- Table 22.105 Global Next Generation RNA Therapeutics Market: Distribution by Route of Administration, 2023, 2028 and 2035 (USD Million)
- Table 22.106 Global Next Generation RNA Therapeutics Market for Intradermal Therapeutics / Vaccines, Forecasted Estimates (till 2035) (USD Million)
- Table 22.107 Global Next Generation RNA Therapeutics Market forI ntramuscular Therapeutics / Vaccines, Forecasted Estimates (till 2035) (USD Million)
- Table 22.108 Global Next Generation RNA Therapeutics Market for Intravenous Therapeutics / Vaccines, Forecasted Estimates (till 2035) (USD Million)
- Table 22.109 Global Next Generation RNA Therapeutics Market: Distribution by Key Geographical Regions, 2023, 2028 and 2035 (USD Million)
- Table 22.110 Next Generation RNA Therapeutics Market in North America, Forecasted Estimates (till 2035) (USD Million)
- Table 22.111 Next Generation RNA Therapeutics Market in the US, Forecasted Estimates (till 2035) (USD Million)
- Table 22.112 Next Generation RNA Therapeutics Market in Europe, Forecasted Estimates (till 2035) (USD Million)
- Table 22.113 Next Generation RNA Therapeutics Market in France, Forecasted Estimates (till 2035) (USD Million)
- Table 22.114 Next Generation RNA Therapeutics Market in Italy, Forecasted Estimates (till 2035) (USD Million)
- Table 22.115 Next Generation RNA Therapeutics Market in Spain, Forecasted Estimates (till 2035) (USD Million)
- Table 22.116 Next Generation RNA Therapeutics Market in the UK, Forecasted Estimates (till 2035) (USD Million)
- Table 22.117 Next Generation RNA Therapeutics Market in the Netherlands, Forecasted Estimates (till 2035) (USD Million)
- Table 22.118 Next Generation RNA Therapeutics Market in Asia-Pacific, Forecasted Estimates (till 2035) (USD Million)
- Table 22.119 Next Generation RNA Therapeutics Market in India, Forecasted Estimates (till 2035) (USD Million)
- Table 22.120 Next Generation RNA Therapeutics Market in Japan, Forecasted Estimates (till 2035) (USD Million)
- Table 22.121 Next Generation RNA Therapeutics Market in Singapore, Forecasted Estimates (till 2035) (USD Million)
- Table 22.122 Global Next Generation RNA Therapeutics Market: Distribution by Leading Players (USD Million)
List of Figures
- Figure 2.1 Research Methodology: Project Methodology
- Figure 2.2 Research Methodology: Data Sources for Secondary Research
- Figure 2.3 Research Methodology: Robust Quality Control
- Figure 3.1 Market Dynamics: Forecast Methodology
- Figure 3.2 Market Dynamics: Market Assessment Framework
- Figure 4.1 Lessons Learnt from Past Recessions
- Figure 5.1 Executive Summary: Market Landscape
- Figure 5.2 Executive Summary: Market Trends
- Figure 5.3 Executive Summary: Market Forecast and Opportunity Analysis
- Figure 6.1 Evolution of Next Generation RNA Therapeutics and Vaccines
- Figure 6.2 Key Aspects of Next Generation RNA Molecules
- Figure 6.3 Key Challenges Associated with Traditional RNA Modalities
- Figure 6.4 Advantages of Using Next Generation RNA Modalities
- Figure 7.1 Next Generation RNA Therapies: Distribution by Type of Modality
- Figure 7.2 Next Generation RNA Therapies: Distribution by Type of Molecule
- Figure 7.3 Next Generation RNA Therapies: Distribution by Delivery Vehicle
- Figure 7.4 Next Generation RNA Therapies: Distribution by Stage of Development
- Figure 7.5 Next Generation RNA Therapies: Distribution by Therapeutic Area
- Figure 7.6 Most Active Players: Distribution by Number of Therapies
- Figure 7.7 Clinical Stage Therapies: Distribution by Phase of Development
- Figure 7.8 Clinical Stage Therapies: Distribution by Route of Administration
- Figure 7.9 Clinical Stage Therapies: Distribution by Therapeutic Area
- Figure 7.10 Therapy Developers Landscape: Distribution by Year of Establishment
- Figure 7.11 Therapy Developers Landscape: Distribution by Company Size
- Figure 7.12 Therapy Developers Landscape: Distribution by Location of Headquarters
- Figure 7.13 saRNA Therapies: Distribution by Phase of Development
- Figure 7.14 saRNA Therapies: Distribution by Therapeutic Area
- Figure 7.15 Most Active Players: Distribution by Number of saRNA Therapies
- Figure 7.16 circRNA Therapies: Distribution by Phase of Development
- Figure 7.17 circRNA Therapies: Distribution by Therapeutic Area
- Figure 7.18 Most Active Players: Distribution by Number of circRNA Therapies
- Figure 8.1 Next Generation RNA Technologies: Distribution by Class of Molecule
- Figure 8.2 Next Generation RNA Technologies: Distribution by Type of Molecule
- Figure 8.3 Next Generation RNA Technologies: Distribution by Capabilities of the Technology
- Figure 8.4 Next Generation RNA Technologies: Distribution by Therapeutic Area
- Figure 8.5 Next Generation RNA Technologies: Distribution by Highest Stage of Development
- Figure 8.6 Next Generation RNA Technologies: Distribution by Class of Molecule and Therapeutic Area
- Figure 8.7 Next Generation RNA Technologies: Distribution by Class of Molecule and Highest Stage of Development
- Figure 8.8 Next Generation RNA Technologies: Distribution by Type of Molecule and Capabilities of the Technology
- Figure 8.9 Technology Developer Landscape: Distribution by Year of Establishment
- Figure 8.10 Technology Developer Landscape: Distribution by Company Size
- Figure 8.11 Technology Developer Landscape: Distribution by Location of Headquarters
- Figure 8.12 Technology Developer Landscape: Distribution by Operational Model
- Figure 9.1 BNT161: Estimated Sales
- Figure 9.2 MTL-CEBPA: Estimated Sales
- Figure 10.1 Clinical Trial Analysis: Distribution by Trial Registration Year
- Figure 10.2 Clinical Trial Analysis: Distribution by Trial Status
- Figure 10.3 Clinical Trial Analysis: Distribution by Trial Registration Year and Trial Status
- Figure 10.4 Clinical Trial Analysis: Distribution by Trial Phase
- Figure 10.5 Clinical Trial Analysis: Distribution of Patients Enrolled by Trial Phase
- Figure 10.6 Clinical Trial Analysis: Distribution of Patients Enrolled by Trial Registration Year
- Figure 10.7 Clinical Trial Analysis: Distribution by Study Design
- Figure 10.8 Clinical Trial Analysis: Distribution by Target Patient Population
- Figure 10.9 Clinical Trial Analysis: Distribution by Patient Gender
- Figure 10.10 Clinical Trial Analysis: Distribution by Type of Sponsor / Collaborator
- Figure 10.11 Clinical Trial Analysis: Distribution by Therapeutic Area
- Figure 10.12 Clinical Trial Analysis: Most Active Players by Number of Trials
- Figure 10.13 Clinical Trial Analysis: Geographical Distribution of Trials and Number of Patients Enrolled
- Figure 10.14 Clinical Trial Analysis: North America: Key Insights
- Figure 10.15 Clinical Trial Analysis: Europe: Key Insights
- Figure 10.16 Clinical Trial Analysis: Asia-Pacific: Key Insights
- Figure 10.17 Clinical Trial Analysis: Rest of the World: Key Insights
- Figure 11.1 Patent Analysis: Distribution by Publication Year
- Figure 11.2 Patent Analysis: Distribution by Type of Patent
- Figure 11.3 Patent Analysis: Distribution of Granted Patents and Patent Applications by Publication Year
- Figure 11.4 Patent Analysis: Cumulative Year-wise Distribution by Type of Applicant
- Figure 11.5 Patent Analysis: Distribution by Application Year
- Figure 11.6 Patent Analysis: Distribution by Patent Jurisdiction (Region)
- Figure 11.7 Patent Analysis: Distribution by Patent Jurisdiction (Country)
- Figure 11.8 Patent Analysis: Distribution by Patent Age
- Figure 11.9 Leading Industry Players: Analysis by Number of Patents
- Figure 11.10 Leading Non-Industry Players: Analysis by Number of Patents
- Figure 11.11 Leading Individual Assignees: Analysis by Number of Patents
- Figure 11.12 Patent Analysis: Distribution by CPC Symbols
- Figure 11.13 Patent Benchmarking: Distribution of Patent Characteristics (CPC Codes) by Leading Industry Players
- Figure 11.14 Patent Benchmarking: Distribution of Leading Industry Players by Patent Characteristics (CPC Codes)
- Figure 11.15 Patent Valuation
- Figure 12.1 Partnerships and Collaborations: Cumulative Year-wise Trend
- Figure 12.2 Partnerships and Collaborations: Distribution by Type of Partnership
- Figure 12.3 Partnerships and Collaborations: Distribution by Year and Type of Partnership
- Figure 12.4 Partnerships and Collaborations: Distribution by Year of Partnership and Type of Molecule
- Figure 12.5 Partnerships and Collaborations: Distribution by Purpose of Partnership
- Figure 12.6 Partnerships and Collaborations: Distribution by Focus Area of Partnership
- Figure 12.7 Partnerships and Collaborations: Distribution by Therapeutic Area
- Figure 12.8 Most Active Players: Distribution by Number of Partnerships
- Figure 12.9 Partnerships and Collaborations: Local and International Deals
- Figure 12.10 Partnerships and Collaborations: Intercontinental and Intracontinental Deals
- Figure 13.1 Funding and Investment Analysis: Cumulative Year-wise Trend
- Figure 13.2 Funding and Investment Analysis: Distribution by Type of Funding
- Figure 13.3 Funding and Investment Analysis: Distribution by Year and Type of Funding
- Figure 13.4 Funding and Investment Analysis: Distribution of Cumulative Amount Invested by Year (USD Million)
- Figure 13.5 Funding and Investment Analysis: Distribution of Amount Invested by Type of Funding (USD Million)
- Figure 13.6 Funding and Investment Analysis: Distribution by Geography
- Figure 13.7 Funding and Investment Analysis: Distribution by Type of Molecule
- Figure 13.8 Funding and Investment Analysis: Distribution by Purpose of Funding
- Figure 13.9 Funding and Investment Analysis: Distribution by Stage of Development
- Figure 13.10 Funding and Investment Analysis: Distribution by Therapeutic Area
- Figure 13.11 Most Active Players: Analysis by Number of Funding Instances
- Figure 13.12 Most Active Players: Analysis by Amount Invested (USD Million)
- Figure 13.13 Most Active Investors: Analysis by Number of Funding Instances
- Figure 14.1 Most Active Players by Number of Big Pharma Initiatives
- Figure 14.2 Big Player Initiatives: Distribution by Year of Initiative
- Figure 14.3 Big Player Initiatives: Distribution by Type of Initiative
- Figure 14.4 Big Player Initiatives: Distribution by Focus Area of Initiative
- Figure 14.5 Big Player Initiatives: Distribution by Purpose of Initiative
- Figure 14.6 Big Player Initiatives: Distribution by Type of Molecule
- Figure 14.7 Big Player Initiatives: Distribution by Therapeutic Area
- Figure 14.8 Big Player Initiatives: Distribution by Therapeutic Area
- Figure 14.9 Big Player Initiatives: Distribution by Location of Headquarters
- Figure 15.1 Global Next Generation RNA Therapeutics Market, Forecasted Estimates (till 2035): Base Scenario
- Figure 15.2 Global Next Generation RNA Therapeutics Market, Forecasted Estimates (till 2035): Conservative Scenario
- Figure 15.3 Global Next Generation RNA Therapeutics Market, Forecasted Estimates (till 2035): Optimistic Scenario
- Figure 16.1 Next Generation RNA Therapeutics Market: Distribution by Type of Modality
- Figure 16.2 Next Generation RNA Therapeutics Market for Therapeutics, Forecasted Estimates (till 2035)
- Figure 16.3 Next Generation RNA Therapeutics Market for Vaccines, Forecasted Estimates (till 2035)
- Figure 17.1 Next Generation RNA Therapeutics Market: Distribution by Type of Molecule
- Figure 17.2 Next Generation RNA Therapeutics Market for sacRNA, Forecasted Estimates (till 2035)
- Figure 17.3 Next Generation RNA Therapeutics Market for saRNA, Forecasted Estimates (till 2035)
- Figure 17.4 Next Generation RNA Therapeutics Market for circRNA, Forecasted Estimates (till 2035)
- Figure 18.1 Next Generation RNA Therapeutics Market: Distribution by Target Indication
- Figure 18.2 Next Generation RNA Therapeutics Market for Hepatocellular Carcinoma, Forecasted Estimates (till 2035)
- Figure 18.3 Next Generation RNA Therapeutics Market for Seasonal Influenza, Forecasted Estimates (till 2035)
- Figure 18.4 Next Generation RNA Therapeutics Market for Advanced Solid Tumors, Forecasted Estimates (till 2035)
- Figure 18.5 Next Generation RNA Therapeutics Market for Radiation-Induced Xerostomia and Hyposalivation, Forecasted Estimates (till 2035)
- Figure 18.6 Next Generation RNA Therapeutics Market for Inherited Bone Marrow Failure Syndromes, Forecasted Estimates (till 2035)
- Figure 19.1 Next Generation RNA Therapeutics Market: Distribution by Route of Administration
- Figure 19.2 Next Generation RNA Therapeutics Market for Intravenous Route, Forecasted Estimates (till 2035)
- Figure 19.3 Next Generation RNA Therapeutics Market for Intramuscular Route, Forecasted Estimates (till 2035)
- Figure 19.4 Next Generation RNA Therapeutics Market for Intratumoral Route, Forecasted Estimates (till 2035)
- Figure 19.5 Next Generation RNA Therapeutics Market for Intraductal Route, Forecasted Estimates (till 2035)
- Figure 20.1 Next Generation RNA Therapeutics Market: Distribution by Geographical Region
- Figure 20.2 Next Generation RNA Therapeutics Market in North America, Forecasted Estimates (till 2035)
- Figure 20.3 Next Generation RNA Therapeutics Market in the US, Forecasted Estimates (till 2035)
- Figure 20.4 Next Generation RNA Therapeutics Market in Europe, Forecasted Estimates (till 2035)
- Figure 20.5 Next Generation RNA Therapeutics Market in the UK, Forecasted Estimates (till 2035)
- Figure 20.6 Next Generation RNA Therapeutics Market in Germany, Forecasted Estimates (till 2035)
- Figure 20.7 Next Generation RNA Therapeutics Market in France, Forecasted Estimates (till 2035)
- Figure 20.8 Next Generation RNA Therapeutics Market in Italy, Forecasted Estimates (till 2035)
- Figure 20.9 Next Generation RNA Therapeutics Market in Spain, Forecasted Estimates (till 2035)
- Figure 20.10 Next Generation RNA Therapeutics Market in Rest of Europe, Forecasted Estimates (till 2035)
- Figure 20.11 Next Generation RNA Therapeutics Market in Asia-Pacific, Forecasted Estimates (till 2035)
- Figure 20.12 Next Generation RNA Therapeutics Market in Singapore, Forecasted Estimates (till 2035)
- Figure 21.1 Next Generation RNA Therapeutics Market: Distribution by Distribution by Leading Players, 2032 (based on revenues generated)
- Figure 21.2 Next Generation RNA Therapeutics Market: Distribution by Distribution by Leading Players, 2035 (based on revenues generated)
- Figure 22.1 Next Generation RNA Therapeutics Market: Sales Forecast for MTL-CEBPA, Forecasted Estimates (till 2035) (USD Million)
- Figure 22.2 Next Generation RNA Therapeutics Market: Sales Forecast for BNT 161, Forecasted Estimates (till 2035) (USD Million)
- Figure 22.3 Next Generation RNA Therapeutics Market: Sales Forecast for STX-001, Forecasted Estimates (till 2035) (USD Million)
- Figure 22.4 Next Generation RNA Therapeutics Market: Sales Forecast for RXRG001, Forecasted Estimates (till 2035) (USD Million)
- Figure 22.5 Next Generation RNA Therapeutics Market: Sales Forecast for EXG-34217, Forecasted Estimates (till 2035) (USD Million)

