
PUBLISHER: Roots Analysis | PRODUCT CODE: 2037816

PUBLISHER: Roots Analysis | PRODUCT CODE: 2037816
Single Use Bioreactors Market (4th Edition): Industry Trends and Global Forecasts, Till 2035: Distribution by Type of Bioreactor, Scale of Operation, Type of Cell Culture, Type of Biologics Synthesized, End Users and Geographical Regions
Single Use Bioreactors Market: Overview
As per Roots Analysis, the global single use bioreactors market is estimated to grow from USD 4.81 billion in the current year to USD 10.48 billion by 2035, at a CAGR of 9.03% during the forecast period, till 2035.
Single Use Bioreactors Market: Growth and Trends
Single-use bioreactors (SUBs), also referred to as disposable bioreactors, utilize single-use bioreactor bags in place of traditional stainless-steel culture vessels for the production of biologics. These systems offer several advantages over conventional bioreactors, including cost savings of approximately 40%, reduced production timelines by nearly 35%, lower energy and water consumption (by 45-50%), improved product yields, and a significantly reduced risk of contamination.
In recent years, the biopharmaceutical sector has experienced substantial growth, with more than 170 biologics approved by the US FDA and over 10,000 candidates currently in various stages of development. To meet the increasing demand for biologics, including high-quality antibodies, cell therapies, and gene therapies, there has been a notable shift toward the adoption of single-use bioreactor technologies.
In response to evolving industry requirements, manufacturers of single-use bioreactors are increasingly integrating advanced features into their systems. These include automated alerts and alarms, electronic batch records, built-in process control sensors, touchscreen interfaces, remote monitoring capabilities, and enhanced safety mechanisms, all aimed at improving operational efficiency and scalability for global biomanufacturing applications. Ongoing technological advances-particularly the development of improved biosensors and single-use bioreactor bags are expected to drive biopharmaceutical companies toward adopting disposable bioreactors for continuous bioprocessing, creating significant growth opportunities for companies operating in this expanding market.
Growth Drivers: Strategic Enablers of Market Expansion
The single-use bioreactors market is experiencing strong growth, driven by the rapid expansion of biopharmaceutical industry and the increasing demand for biologics, including monoclonal antibodies, vaccines, and advanced therapies such as cell and gene therapies. Further, the growing preference for flexible and cost-efficient manufacturing solutions has accelerated the adoption of single-use systems, as they eliminate the need for extensive cleaning and sterilization, reduce capital expenditure, and enable faster turnaround times. Additionally, the shift toward decentralized and small-batch production, particularly for personalized medicines, further supports the uptake of single-use bioreactors. Continuous technological advancements such as improved scalability, automation, and integration with digital monitoring systems are also enhancing process efficiency and reliability, thereby driving broader industry adoption.
Market Challenges: Critical Barriers Impeding Progress
Despite these advantages, the market faces several challenges that may impact long-term growth. One of the primary concerns is the limited scalability of single-use bioreactors for large-volume commercial production, where traditional stainless-steel systems may still be preferred. Additionally, issues related to extractables and leachables from disposable materials raise concerns regarding product quality and regulatory compliance. The dependence on single-use plastics also presents sustainability and waste management challenges, particularly in the context of increasing environmental regulations. Furthermore, supply chain constraints for specialized components and consumables, along with the need for standardization across platforms, can hinder widespread adoption. Addressing these challenges will require continued innovation, regulatory alignment, and the development of more sustainable materials and disposal practices.
Single Use Bioreactors Market: Key Insights
The report delves into the current state of the singe use bioreactors market and identifies potential growth opportunities within industry. Some key findings from the report include:
- Currently, more than 260 single-use bioreactors are being offered by various industry players worldwide; of these, around 75% of bioreactors have the capability to synthesize vaccines.
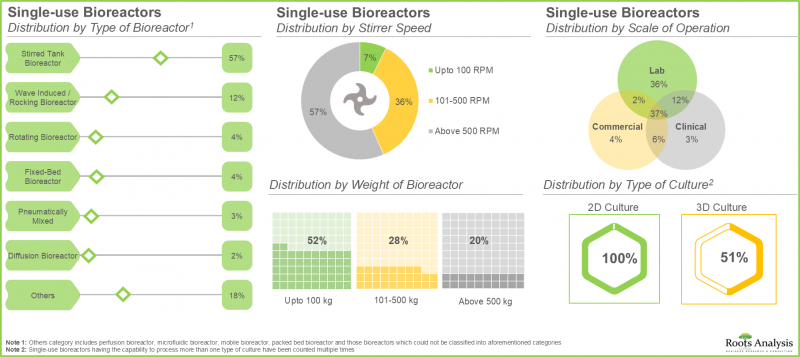
- Around 60% of the single-use bioreactors are stirred tank bioreactors; notably, nearly 40% of the bioreactors have capability to support all scales including lab, clinical and commercial scale.
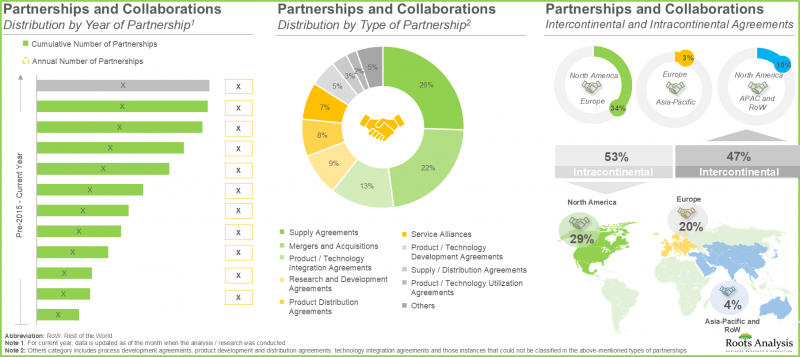
- A steady growth in the partnership activity has been observed in the recent years; supply agreements emerged as the most prominent type of partnership model.
- Around 540 patents have been filed / granted for the research and development of single-use bioreactors since 2020; notably majority of the patent applicants are industry players
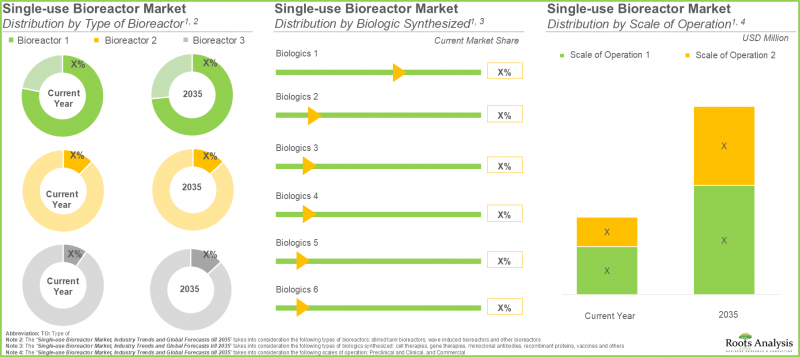
- The single-use bioreactors market is likely to grow at a CAGR of 9.28%, till 2035; presently, majority of the market share is occupied by revenues generated from stirred tank bioreactors.
- Currently, majority of the single-use bioreactors market share is likely to be occupied by Europe; the market in Asia-Pacific is likely to grow at a higher CAGR of 11% in the foreseen future.
- Given the rising demand for biopharmaceuticals, the need for flexible and scalable manufacturing solutions, the single-use bioreactor market is likely to experience substantial growth in the coming years.
Single Use Bioreactors Market
The market sizing and opportunity analysis has been segmented across the following parameters:
By Type of Bioreactor
- Stirred Tank Bioreactor
- Wave Induced Bioreactor
- Other Bioreactors
By Scale of Operation
- Preclinical and Clinical
- Commercial
By Type of Cell Culture
- Mammalian
- Microbial
- Others
By Type of Biologics Synthesized
- Vaccine
- Monoclonal Antibody
- Recombinant Protein
- Stem Cell
- Cell Therapy
- Gene Therapy
By End Users
- Biopharmaceutical / Pharmaceutical Industries
- Academic / Research Institutes
By Geographical Regions
- North America
- Europe
- Asia-Pacific
- Latin America
- Middle East and North Africa
Single Use Bioreactors Market: Key Segments
Market Share by Bioreactor Type: Stirred Tank Systems Dominate the Single Use Bioreactors Market
The global single-use bioreactors market is segmented by bioreactor type into stirred tank, wave-induced, and other systems. Currently, stirred tank bioreactors account for approximately 80% of the market share and are expected to grow at a relatively higher CAGR over the forecast period. This dominance is attributed to their superior scalability, efficient mixing capabilities, and widespread adoption in biopharmaceutical manufacturing. Additionally, these systems are designed to minimize shear stress, thereby reducing potential damage to cell cultures through optimized blade configurations and controlled agitation speeds.
Market Share by Scale of Operation: Preclinical and Clinical Segments Lead in the Single Use Bioreactors Domain
Based on the scale of operation, the market is categorized into preclinical and clinical, and commercial segments. The preclinical and clinical segment currently holds the largest share, accounting for over 60% of total revenue. This is primarily due to the operational advantages of single-use systems, which eliminate the need for extensive cleaning and maintenance, making them particularly suitable and cost-effective for early-stage development and clinical-scale production.
Market Share by Cell Culture Type: Mammalian Cells Hold Majority of the Single Use Bioreactors Market Share
The market is further segmented by cell culture type into mammalian, microbial, and others. The mammalian cell culture segment dominates with an approximate share of 65%, a trend expected to persist due to its critical role in producing complex biologics. Notably, over 80% of disposable bioreactors are designed to support mammalian cell processing. In contrast, the microbial segment is projected to grow at a higher CAGR of 10% during the forecast period, driven by its suitability for producing smaller and less complex biologics, such as antibody fragments and single-domain antibodies.
Market Share by Biologics Type: Monoclonal Antibodies Segment Leads the Single Use Bioreactors Market
By biologics type, the market includes vaccines, monoclonal antibodies, recombinant proteins, stem cells, cell therapies, and gene therapies. Among these, monoclonal antibodies currently account for the largest share at approximately 35%, supported by their extensive use across multiple therapeutic areas. Meanwhile, the cell therapy segment is expected to grow at a higher CAGR of 13% during the forecast period, driven by expanding clinical applications across a wide range of disease indications.
Market Share by End Users: Biopharmaceutical Companies are likely to Dominate the Market
Based on end users, the market is segmented into biopharmaceutical/pharmaceutical companies and academic/research institutes. The biopharmaceutical and pharmaceutical segment holds a dominant share of approximately 65%, reflecting high adoption rates of single-use technologies for biologics production and the need for flexible, scalable manufacturing solutions.
Market Share by Geography: Asia-Pacific to Exhibit Strong Growth
Geographically, the market spans North America, Europe, Asia-Pacific, the Middle East and North Africa, and Latin America. North America is projected to maintain its leading position, accounting for over 35% of the market share, driven by advanced biomanufacturing infrastructure and strong industry presence. However, the Asia-Pacific region is expected to register the highest growth, with a projected CAGR of 11% during the forecast period, supported by increasing investments, expanding product portfolios, and strategic initiatives by regional players to strengthen long-term market positioning.
Example Players in Single Use Bioreactors Market
- Celartia
- Cell Culture Company
- Cellexus
- Cercell
- Cytiva
- Eppendorf
- Esco Bioengineering
- Getinge
- Merck Millipore
- PBS Biotech
- PerfuseCell
- ProlifeCell
- Sartorius
- Solaris Biotech
- Synthecon
- Thermo Fisher Scientific
Single Use Bioreactors Market Research Coverage
- Market Sizing and Opportunity Analysis: The report features an in-depth analysis of the single use bioreactors market, focusing on key market segments, including [A] type of bioreactor, [B] scale of operation, [C] type of cell culture, [D] type of biologics synthesized,[E] end user, and [F] geographical regions.
- Single Use Bioreactors Market Landscape: A detailed assessment of various single-use bioreactors that are either commercialized or under development based several relevant parameters, such as [A] type of bioreactor, [B] scale of operation, [C] typical working volume, [D] stirrer speed, [E] weight of the bioreactor, [F] type of cell culture, [G] type of biologics synthesized, [H] end-users, [I] year of establishment, [J] company size, and [K] location of headquarters.
- Key Insights: A contemporary market trend analysis of the companies engaged in this industry based on [A] company size and location of headquarters, [B] type of single use bioreactor and mode of operation, [C] type of single use bioreactor and type of biologics synthesized, [D] scale of operation, type of cell culture and [E] type of biologics synthesized.
- Company Competitiveness Analysis: An in-depth company competitiveness analysis based on various relevant parameters, such as [A] company strength, and [B] portfolio strength and [C] product portfolio diversity.
- Company Profiles: In-depth profiles of key companies based in North America, Europe and Asia-Pacific based on several parameters such as [A] year of establishment, [B] location of headquarters, [C] product portfolio, [D] recent developments and [E] an informed future outlook.
- Partnerships and Collaborations: An analysis of the recent partnerships and collaborations related to single-use bioreactors, based on several parameters, such as [A] year of agreement, type of partnership, [B] focus area, [C] type of partner, [D] type of biologics synthesized, [E] type of bioreactor involved, [F] location of facility, [G] expanded bioreactor capacity and [H] most active players.
- Product Competitiveness Analysis: An in-depth product competitiveness analysis based on various relevant parameters, such as [A] supplier strength, and [B] product competitiveness.
- Brand Positioning Analysis: An opinion on the relative popularity of the respective brands of key industry stakeholders based on several relevant parameters, such as [A] portfolio strength, and [B] portfolio diversity.
- Patent Analysis: A detailed analysis of the patents that have been filed / granted based on important parameters such as, [A] type of patent, [B] publication year, [C] application year, [D] number of granted patents and patent applications, [E] patent jurisdiction, [F] CPC symbols, [G] patent age, [H] type of applicant, and [I] individual patent assignees (in terms of size of intellectual property portfolio).
- Case Study - Key Technological Innovations in the Single-Use Bioreactors Industry: A case study on the key technological innovations, such as [A] built-in system control sensors, [B] advanced alarm systems, [C] electronic-log records, [D] touch screens, [E] real-time tracking, [F] remote monitoring and [G] advanced mixing technologies, that have been introduced in the single-use bioreactors industry.
- Case Study - Bioprocess Controllers and Automation Systems: A case study on the market landscape of bioprocess controllers and automation systems, providing information on [A] scale of operation, [B] key features, [C] compatibility with bioreactor system, [D] type of bioprocess, and [E] type of process controlled.
- SWOT Analysis: A discussion on affiliated trends, key drivers and challenges, under a SWOT framework, which are likely to impact the industry's evolution, including a Harvey ball analysis, highlighting the relative effect of each SWOT parameter on the overall single-use bioreactors industry.
Key Questions Answered in this Report
- Which are the leading companies in the single use bioreactors market?
- Which region dominates the single use bioreactors market?
- What are the key trends observed in the single use bioreactors market?
- What factors are likely to influence the evolution of this market?
- What are the primary challenges faced by single use bioreactors providers?
- What is the current and future market size?
- What is the CAGR of this market?
- How is the current and future market opportunity likely to be distributed across key market segments?
Reasons to Buy this Report
- The report provides a comprehensive market analysis, offering detailed revenue projections of the overall market and its specific sub-segments. This information is valuable to both established market leaders and emerging entrants.
- The report offers stakeholders a comprehensive overview of the market, including key drivers, barriers, opportunities, and challenges. This information empowers stakeholders to stay abreast of market trends and make data-driven decisions to capitalize on growth prospects.
- The report can aid businesses in identifying future opportunities in any sector. It also helps in understanding if those opportunities are worth pursuing.
- The report helps in identifying customer demand by understanding the needs, preferences, and behavior of the target audience in order to tailor products or services effectively.
- The report equips new entrants with requisite information regarding a particular market to help them build successful business strategies.
- The report allows for more effective communication with the audience and in building strong business relations.
Additional Benefits
- Complementary PPT Insights Pack
- Complimentary Excel Data Packs for all Analytical Modules in the Report
- 15% Free Content Customization
- Detailed Report Walkthrough Session with Research Team
- Free Updated report if the report is 6-12 months old or older
TABLE OF CONTENTS
1. PREFACE
- 1.1. Introduction
- 1.2. Key Market Insights
- 1.3. Scope of the Report
- 1.4. Research Methodology
- 1.5. Frequently Asked Questions
- 1.6. Chapter Outlines
2. EXECUTIVE SUMMARY
3. INTRODUCTION
- 3.1. Chapter Overview
- 3.2. Overview of Single-use Bioreactors
- 3.2.1. Historical Evolution
- 3.2.2. Single-use versus Traditional Bioreactors
- 3.3. Types of Single-use Bioreactors
- 3.3.1. Based on Cell Culture
- 3.3.2. Based on Agitation Mechanism
- 3.4. Advantages of Single-use Bioreactors
- 3.5. Key Applications Areas
- 3.6. Prevalent Regulatory Standards
- 3.7. Challenges Associated with Single-use Bioreactors
- 3.8. Concluding Remarks
4. MARKET LANDSCAPE
- 4.1. Chapter Overview
- 4.2. Single-use Bioreactors: Overall Market Landscape
- 4.2.1. Analysis by Type of Bioreactor
- 4.2.2. Analysis by Scale of Operation
- 4.2.3. Analysis by Working Volume
- 4.2.4. Analysis by Stirrer Speed
- 4.2.5. Analysis by Weight of Bioreactor
- 4.2.6. Analysis by Advanced Display / Control Features
- 4.2.7. Analysis by Mode of Operation
- 4.2.8. Analysis by Type of Culture
- 4.2.9. Analysis by Type of Cell Culture
- 4.2.10. Analysis by Type of Biologics Synthesized
- 4.2.11. Analysis by End-users
- 4.3. List of Single-use Bioreactor Manufacturers
- 4.3.1. Analysis by Year of Establishment
- 4.3.2. Analysis by Company Size
- 4.3.3. Analysis by Location of Headquarters (Region)
- 4.3.4. Analysis by Location of Headquarters (Country)
- 4.4. Leading Manufacturers: Analysis by Number of Products
5. KEY INSIGHTS
- 5.1. Chapter Overview
- 5.2. Analysis by Company Size and Location of Headquarters
- 5.3. Analysis by Company Size and Type of Single-use Bioreactor
- 5.4. Analysis by Type of Single-use Bioreactor and Mode of Operation
- 5.5. Analysis by Type of Single-use Bioreactor and Type of Biologics Synthesized
- 5.6. Analysis by Scale of Operation, Type of Cell Culture and Type of Biologics Synthesized
- 5.7. Analysis by Location of Headquarters
6. COMPANY COMPETITIVENESS ANALYSIS
- 6.1. Chapter Overview
- 6.2. Methodology
- 6.3. Assumptions / Key Parameters
- 6.4. Single-use Bioreactor Manufacturers: Company Competitiveness Analysis
- 6.4.1. Small Companies
- 6.4.2. Mid-sized Companies
- 6.4.3. Large Companies
7. SINGLE-USE BIOREACTOR MANUFACTURERS IN NORTH AMERICA: COMPANY PROFILES
- 7.1. Chapter Overview
- 7.2. Leading Players based in North America
- 7.2.1. Celartia
- 7.2.1.1. Company Overview
- 7.2.1.2. Product Portfolio
- 7.2.1.3. Recent Developments and Future Outlook
- 7.2.2. Cell Culture Company
- 7.2.2.1. Company Overview
- 7.2.2.2. Product Portfolio
- 7.2.2.3. Recent Developments and Future Outlook
- 7.2.3. Cytiva
- 7.2.3.1. Company Overview
- 7.2.3.2. Product Portfolio
- 7.2.3.3. Recent Developments and Future Outlook
- 7.2.4. Merck Millipore
- 7.2.4.1. Company Overview
- 7.2.4.2. Financial Information
- 7.2.4.3. Product Portfolio
- 7.2.4.4. Recent Developments and Future Outlook
- 7.2.5. Pall Corporation
- 7.2.5.1. Company Overview
- 7.2.5.2. Product Portfolio
- 7.2.5.3. Recent Developments and Future Outlook
- 7.2.6. PBS Biotech
- 7.2.6.1. Company Overview
- 7.2.6.2. Product Portfolio
- 7.2.6.3. Recent Developments and Future Outlook
- 7.2.7. Synthecon
- 7.2.7.1. Company Overview
- 7.2.7.2. Product Portfolio
- 7.2.7.3. Recent Developments and Future Outlook
- 7.2.8. Thermo Fisher Scientific
- 7.2.8.1. Company Overview
- 7.2.8.2. Financial Information
- 7.2.8.3. Product Portfolio
- 7.2.8.4. Recent Developments and Future Outlook
- 7.2.1. Celartia
8. SINGLE-USE BIORECTOR MANUFACTURERS IN EUROPE, ASIA-PACIFIC AND REST OF THE WORLD: COMPANY PROFILES
- 8.1. Chapter Overview
- 8.2. Leading Players based in Europe, Asia-Pacific and Rest of the World
- 8.2.1. Applikon Biotechnology
- 8.2.1.1. Company Overview
- 8.2.1.2. Product Portfolio
- 8.2.1.3. Recent Developments and Future Outlook
- 8.2.2. Cellexus
- 8.2.2.1. Company Overview
- 8.2.2.2. Product Portfolio
- 8.2.2.3. Recent Developments and Future Outlook
- 8.2.3. CerCell
- 8.2.3.1. Company Overview
- 8.2.3.2. Product Portfolio
- 8.2.3.3. Recent Developments and Future Outlook
- 8.2.4. Eppendorf
- 8.2.4.1. Company Overview
- 8.2.4.2. Financial Information
- 8.2.4.3. Product Portfolio
- 8.2.4.4. Recent Developments and Future Outlook
- 8.2.5. PerfuseCell
- 8.2.5.1. Company Overview
- 8.2.5.2. Product Portfolio
- 8.2.5.3. Recent Developments and Future Outlook
- 8.2.6. ProlifeCell
- 8.2.6.1. Company Overview
- 8.2.6.2. Product Portfolio
- 8.2.6.3. Recent Developments and Future Outlook
- 8.2.7. Sartorius Stedim Biotech
- 8.2.7.1. Company Overview
- 8.2.7.2. Financial Information
- 8.2.7.3. Product Portfolio
- 8.2.7.4. Recent Developments and Future Outlook
- 8.2.8. Solaris Biotech
- 8.2.8.1. Company Overview
- 8.2.8.2. Product Portfolio
- 8.2.8.3. Recent Developments and Future Outlook
- 8.2.1. Applikon Biotechnology
- 8.3. Leading Players based in Asia-Pacific and Rest of the World
- 8.3.1. Biolinx Labsystems
- 8.3.1.1. Company Overview
- 8.3.1.2. Product Portfolio
- 8.3.1.3. Recent Developments and Future Outlook
- 8.3.2. CESCO Bioengineering
- 8.3.2.1. Company Overview
- 8.3.2.2. Product Portfolio
- 8.3.2.3. Recent Developments and Future Outlook
- 8.3.1. Biolinx Labsystems
9. PARTNERSHIPS AND COLLABORATIONS
- 9.1. Chapter Overview
- 9.2. Partnership Models
- 9.3. Single-use Bioreactors: List of Partnerships and Collaborations
- 9.3.1. Analysis by Year of Partnership
- 9.3.2. Analysis by Type of Partnership
- 9.3.3. Analysis by Year and Type of Partnership
- 9.3.4. Analysis by Focus Area
- 9.3.5. Analysis by Year of Partnership and Focus Area
- 9.3.6. Analysis by Type of Partner
- 9.3.7. Analysis by Type of Biologics Synthesized
- 9.3.8. Analysis by Type of Bioreactor Involved
- 9.3.9. Analysis by Location of Facility (Country) and Expanded Bioreactor Capacity
- 9.3.10. Most Active Players: Analysis by Number of Partnerships
- 9.3.11. Analysis by Geography
- 9.3.11.1. Local and International Agreements
- 9.3.11.2. Intracontinental and Intercontinental Agreements
10. PRODUCT COMPETITIVENESS ANALYSIS
- 10.1. Chapter Overview
- 10.2. Methodology
- 10.3. Assumptions / Key Parameters
- 10.4. Single-use Bioreactors: Product Competitiveness Analysis
- 10.4.1. Stirred Tank Single-use Bioreactors
- 10.4.1.1. Products Offered by Players based In North America
- 10.4.1.2. Products Offered by Players based In Europe
- 10.4.1.3. Products Offered by Players based In Asia-Pacific and Rest of the World
- 10.4.2. Fixed-Bed Single-use Bioreactors
- 10.4.3. Wave-Induced / Rocking Single-use Bioreactors
- 10.4.4. Other Types of Single-use Bioreactors
- 10.4.4.1. Products Offered by Players based In North America
- 10.4.4.2. Products Offered by Players based In Europe
- 10.4.4.3. Products Offered by Players based In Asia-Pacific and Rest of the World
- 10.4.1. Stirred Tank Single-use Bioreactors
11. BRAND POSITIONING ANALYSIS
- 11.1. Chapter Overview
- 11.2. Methodology
- 11.3. Key Parameters
- 11.4. Brand Positioning Matrix
- 11.5. Brand Positioning Matrix: Pall Corporation
- 11.6. Brand Positioning Matrix: Biolinx Labsystems
- 11.7. Brand Positioning Matrix: Eppendorf
- 11.8. Brand Positioning Matrix: Solaris Biotech
- 11.9. Brand Positioning Matrix: Sartorius Stedim Biotech
- 11.10. Brand Positioning Matrix: Applikon Biotechnology
- 11.11. Brand Positioning Matrix: Cercell
12. PATENT ANALYSIS
- 12.1. Chapter Overview
- 12.2. Scope and Methodology
- 12.3. Single-use Bioreactors: Patent Analysis
- 12.3.1. Analysis by Publication Year
- 12.3.2. Analysis by Application Year
- 12.3.3. Analysis by Type of Patents and Publication Year
- 12.3.4. Analysis by Patent Jurisdiction
- 12.3.5. Analysis by CPC Symbols
- 12.3.6. Analysis by Type of Applicant
- 12.3.7. Leading Industry Players: Analysis by Number of Patents
- 12.3.8. Leading Patent Assignees: Analysis by Number of Patents
- 12.4. Single-use Bioreactors: Patent Benchmarking Analysis
- 12.4.1. Analysis by Patent Characteristics
- 12.5. Single-use Bioreactors: Patent Valuation
- 12.6. Leading Patents by Number of Citations
13. MARKET FORECAST AND OPPORTUNITY ANALYSIS
- 13.1. Chapter Overview
- 13.2. Key Assumptions and Methodology
- 13.3. Global Single-use Upstream Bioprocessing Technology Market, till 2035
- 13.3.1. Global Single-use Upstream Bioprocessing Technology Market: Distribution by Scale of Operation, till 2035
- 13.3.2. Global Single-use Upstream Bioprocessing Technology Market: Distribution by Type of Equipment, till 2035
- 13.3.3. Global Single-use Upstream Bioprocessing Technology Market: Distribution by Geographical Region, till 2035
- 13.4. Global Single-use Bioreactors Market, till 2035
- 13.4.1. Global Single-use Bioreactors Market: Distribution by Type of Bioreactor, till 2035
- 13.4.2. Global Single-use Bioreactors Market: Distribution by Scale of Operation, till 2035
- 13.4.3. Global Single-use Bioreactors Market: Distribution by Type of Cell Culture, till 2035
- 13.4.4. Global Single-use Bioreactors Market: Distribution by Type of Biologics Synthesized, till 2035
- 13.4.5. Global Single-use Bioreactors Market: Distribution by End-users, till 2035
- 13.4.6. Global Single-use Bioreactors Market: Distribution by Geographical Region, till 2035
14. CASE STUDY: KEY TECHNOLOGICAL INNOVATIONS IN THE SINGLE-USE BIOREACTORS INDUSTRY
- 14.1. Chapter Overview
- 14.2. Innovations in Bioreactor Display / Control Features
- 14.2.1. Built-in System Control Sensors
- 14.2.2. Advanced Alarm Systems
- 14.2.3. Electronic-Log Records and Touch Screens
- 14.2.4. Real-Time Tracking and Remote Monitoring
- 14.3. Innovation in Mixing Technologies
- 14.4. Automation in Single-use bioreactors
- 14.5. Concluding Remarks
15. SWOT ANALYSIS
- 15.1. Chapter Overview
- 15.2. Single-use Bioreactors: SWOT Analysis
- 15.3. Strengths
- 15.4. Weaknesses
- 15.5. Opportunities
- 15.6. Threats
- 15.7. Comparison of SWOT Factors
16. CASE STUDY: BIOPROCESS CONTROLLERS AND AUTOMATION SYSTEMS
- 16.1. Chapter Overview
- 16.2. Bioprocess Control Software: Overall Market Landscape
- 16.2.1. Analysis by Scale of Operation
- 16.2.2. Analysis by Key Features
- 16.2.3. Analysis by Compatibility with System
- 16.2.4. Analysis by Type of Process Controlled
- 16.3. Bioprocess Control Software Developers: Overall Market Landscape
- 16.3.1. Analysis by Year of Establishment
- 16.3.2. Analysis by Company Size
- 16.3.3. Analysis by Location of Headquarters
- 16.4. Upstream Controllers: Overall Market Landscape
- 16.4.1. Analysis by Scale of Operation
- 16.4.2. Analysis by Key Features
- 16.4.3. Analysis by Compatibility with Bioreactor System
- 16.4.4. Analysis by Type of Bioprocess
- 16.4.5. Analysis by Type of Process Controlled
- 16.5. Upstream Controller Developers: Overall Market Landscape
- 16.5.1. Analysis by Year of Establishment
- 16.5.2. Analysis by Company Size
- 16.5.3. Analysis by Location of Headquarters
- 16.6. Downstream Controller Systems: Overall Market Landscape
- 16.6.1. Analysis by Scale of Operation
- 16.6.2. Analysis by Key Features
- 16.6.3. Analysis by Type of System
- 16.6.4. Analysis by Type of Bioprocess
- 16.6.5. Analysis by Application Area
- 16.7. Downstream Controller System Developers: Overall Market Landscape
- 16.7.1. Analysis by Year of Establishment
- 16.7.2. Analysis by Company Size
- 16.7.3. Analysis by Location of Headquarters
17. CONCLUSION
18. EXECUTIVE INSIGHTS
19. APPENDIX I: TABULATED DATA
20. APPENDIX II: LIST OF COMPANIES AND ORGANIZATIONS
21. APPENDIX III: LIST OF BUSINESSES OFFERING BIOPROCESS
List of Tables
- Table 3.1 Comparison between Conventional and Single-use Bioreactors
- Table 4.1 Single-use Bioreactors: Information on Manufacturer, Status of Development, Type of Bioreactor and Scale of Operation
- Table 4.2 Single-use Bioreactors: Information on Working Volume, Stirrer Speed, Weight and Dimensions of Bioreactor
- Table 4.3 Single-use Bioreactors: Information on Advanced Display / Control Features
- Table 4.4 Single-use Bioreactors: Information on Mode of Operation
- Table 4.5 Single-use Bioreactors: Information on Type of Culture and Type of Cell Culture
- Table 4.6 Single-use Bioreactors: Information on Type of Biologics Synthesized
- Table 4.7 Single-use Bioreactors: Information on End-users
- Table 4.8 Single-use Bioreactors: List of Manufacturers
- Table 7.1 Single-use Bioreactors: List of Companies Profiled
- Table 7.2 Celartia: Company Snapshot
- Table 7.3 Celartia: Product Portfolio
- Table 7.4 Cell Culture Company: Company Snapshot
- Table 7.5 Cell Culture Company: Product Portfolio
- Table 7.6 Cytiva: Company Snapshot
- Table 7.7 Cytiva: Product Portfolio
- Table 7.8 Merck Millipore: Company Snapshot
- Table 7.9 Merck Millipore: Product Portfolio
- Table 7.10 Merck Millipore: Recent Developments and Future Outlook
- Table 7.11 Pall Corporation: Company Snapshot
- Table 7.12 Pall Corporation: Product Portfolio
- Table 7.13 Pall Corporation: Recent Developments and Future Outlook
- Table 7.14 PBS Biotech: Company Snapshot
- Table 7.15 PBS Biotech: Product Portfolio
- Table 7.16 PBS Biotech: Recent Developments and Future Outlook
- Table 7.17 Synthecon: Company Snapshot
- Table 7.18 Synthecon: Product Portfolio
- Table 7.19 Thermo Fisher Scientific: Company Snapshot
- Table 7.20 Thermo Fisher Scientific: Product Portfolio
- Table 7.21 Thermo Fisher Scientific: Recent Developments and Future Outlook
- Table 8.1 Single-use Bioreactors: List of Companies Profiled
- Table 8.2 Applikon Biotechnology: Company Snapshot
- Table 8.3 Applikon Biotechnology: Product Portfolio
- Table 8.4 Applikon Biotechnology: Recent Developments and Future Outlook
- Table 8.5 Cellexus: Company Snapshot
- Table 8.6 Cellexus: Product Portfolio
- Table 8.7 Cellexus: Recent Developments and Future Outlook
- Table 8.8 CerCell: Company Snapshot
- Table 8.9 CerCell: Product Portfolio
- Table 8.10 CerCell: Recent Developments and Future Outlook
- Table 8.11 Eppendorf: Company Snapshot
- Table 8.12 Eppendorf: Product Portfolio
- Table 8.13 Eppendorf: Recent Developments and Future Outlook
- Table 8.14 PerfuseCell: Company Snapshot
- Table 8.15 PerfuseCell: Product Portfolio
- Table 8.16 PerfuseCell: Recent Developments and Future Outlook
- Table 8.17 ProlifeCell: Company Snapshot
- Table 8.18 ProlifeCell: Product Portfolio
- Table 8.19 ProlifeCell: Recent Developments and Future Outlook
- Table 8.20 Sartorius Stedim Biotech: Company Snapshot
- Table 8.21 Sartorius Stedim Biotech: Product Portfolio
- Table 8.22 Sartorius Stedim Biotech: Recent Developments and Future Outlook
- Table 8.23 Solaris Biotech: Company Snapshot
- Table 8.24 Solaris Biotech: Product Portfolio
- Table 8.25 Solaris Biotech: Recent Developments and Future Outlook
- Table 8.26 Biolinx Labsystems: Company Snapshot
- Table 8.27 Biolinx Labsystems: Product Portfolio
- Table 8.28 CESCO Bioengineering: Company Snapshot
- Table 8.29 CESCO Bioengineering: Product Portfolio
- Table 9.1 Single-use Bioreactors: List of Partnerships and Collaborations
- Table 9.2 Single-use Bioreactors: Information on Location of Partner (Country and Continent)
- Table 10.1 Product Competitiveness Analysis: Information on Peer Groups
- Table 12.1 Patent Analysis: Top CPC Sections
- Table 12.2 Patent Analysis: Top CPC Symbols
- Table 12.3 Patent Analysis: Top CPC Codes
- Table 12.4 Patent Analysis: Summary of Benchmarking Analysis
- Table 12.5 Patent Analysis: Categorization based on Weighted Valuation Scores
- Table 12.6 Patent Analysis: List of Leading Patents (by Number of Citations)
- Table 16.1 Bioprocess Control Software: Information on Stage of Bioprocess and Scale of Operation
- Table 16.2 Bioprocess Control Software: Information on Key Features, Compatibility with Bioreactor Systems and Processes Controlled
- Table 16.3 Bioprocess Control Software Manufacturers: Information of Year of Establishment, Company Size and Location of Headquarters
- Table 16.4 Upstream Controllers: Information on Dimensions and Scale of Operation
- Table 16.5 Upstream Controllers: Information on Key Features, Type of Bioprocess and Compatibility with Bioreactor Systems, and Processes Controlled
- Table 16.6 Upstream Controller Manufacturers: Information on Year of Establishment, Company Size and Location of Headquarters
- Table 16.7 Downstream Controller Systems: Information on Dimensions, Type of Controllers and Scale of Operation
- Table 16.8 Downstream Controller Systems: Information on Key Features, Type of System, Type of Bioprocess and Application Areas
- Table 16.9 Downstream Controller System Manufacturers: Information of Year of Establishment, Company Size and Location of Headquarters
- Table 18.1 Membio: Company Snapshot
- Table 18.2 Distek: Company Snapshot
- Table 18.3 Refine Technology: Company Snapshot
- Table 18.4 CerCell: Company Snapshot
- Table 18.5 CelVivo: Company Snapshot
- Table 19.1 Conventional Stainless-steel Bioreactors and Single-use Bioreactors: Energy Consumption (Mega Joules)
- Table 19.2 Conventional Stainless-steel Bioreactors and Single-use Bioreactors: Water Consumption (Kilo Liters)
- Table 19.3 Single-use Bioreactors: Distribution by Type of Bioreactor
- Table 19.4 Single-use Bioreactors: Distribution by Scale of Operation
- Table 19.5 Single-use Bioreactors: Distribution by Working Volume
- Table 19.6 Single-use Bioreactors: Distribution by Stirrer speed
- Table 19.7 Single-use Bioreactors: Distribution by Weight of Bioreactor
- Table 19.8 Single-use Bioreactors: Distribution by Advanced Display / Control Features
- Table 19.9 Single-use Bioreactors: Distribution by Mode of Operation
- Table 19.10 Single-use Bioreactors: Distribution by Type of Culture
- Table 19.11 Single-use Bioreactors: Distribution by Type of Cell Culture
- Table 19.12 Single-use Bioreactors: Distribution by Type of Biologics Synthesized
- Table 19.13 Single-use Bioreactors: Distribution by End-users
- Table 19.14 Single-use Bioreactor Manufacturers: Distribution by Year of Establishment
- Table 19.15 Single-use Bioreactor Manufacturers: Distribution by Company Size
- Table 19.16 Single-use Bioreactor Manufacturers: Distribution by Location of Headquarters (Region)
- Table 19.17 Single-use Bioreactor Manufacturers: Distribution by Location of Headquarters (Country)
- Table 19.18 Leading Manufacturers: Distribution by Number of Products
- Table 19.19 Distribution by Company Size of manufacturer and Type of Single-use Bioreactor
- Table 19.20 Distribution by Type of Single-use Bioreactor and Mode of Operation
- Table 19.21 Distribution by Company Size and Location of Headquarters
- Table 19.22 World Map Representation: Distribution by Location of Headquarters
- Table 19.23 Danaher (a parent company of Cytiva): Annual Revenues, Since 2022(USD Billion)
- Table 19.24 Merck Millipore: Annual Revenues, 2017-2022 (EUR Billion)
- Table 19.25 Danaher (a parent company of Pall Corporation): Annual Revenues, Since 2022(USD Billion)
- Table 19.26 Thermo Fisher Scientific: Annual Revenues, 2017-2022 (USD Billion)
- Table 19.27 Eppendorf: Annual Revenues, 2018-2022 (EUR Million)
- Table 19.28 Sartorius Stedim Biotech: Annual Revenues, 2018-Q1 2023 (EUR Million)
- Table 19.29 Partnerships and Collaborations: Cumulative Year-Wise Trend
- Table 19.30 Partnerships and Collaborations: Distribution by Type of Partnership
- Table 19.31 Partnerships and Collaborations: Distribution by Year and Type of Partnership
- Table 19.32 Partnerships and Collaborations: Distribution by Focus Area
- Table 19.33 Partnerships and Collaborations: Distribution by Year of Partnership and Focus Area
- Table 19.34 Partnerships and Collaborations: Distribution by Type of Partner
- Table 19.35 Partnerships and Collaborations: Distribution by Type of Biologics Synthesized
- Table 19.36 Partnerships and Collaborations: Distribution by Type of Bioreactor Involved
- Table 19.37 Most Active Players: Distribution by Number of Partnerships
- Table 19.38 Partnerships and Collaborations: Local and International Agreements
- Table 19.39 Partnerships and Collaborations: Intracontinental and Intercontinental Agreements
- Table 19.40 Patent Analysis: Distribution by Type of Patent
- Table 19.41 Patent Analysis: Cumulative Year-wise Trend by Application Year, Since Pre-2015
- Table 19.42 Patent Analysis: Cumulative Year-wise Trend by Publication Year, Since Pre-2015
- Table 19.43 Patent Analysis: Distribution of Type of Patents and Publication Year, Pre-2015-2023
- Table 19.44 Patent Analysis: Distribution by Patent Jurisdiction
- Table 19.45 Patent Analysis: Cumulative Year-wise Distribution by Type of Applicant
- Table 19.46 Leading Industry Players: Distribution by Number of Patents
- Table 19.47 Leading Patent Assignees: Distribution by Number of Patents
- Table 19.48 Patent Analysis: Distribution by Patent Age
- Table 19.49 Single-use Bioreactors: Patent Valuation
- Table 19.50 Global Single-use Upstream Bioprocessing Technology Market, Conservative, Base and Optimistic Scenario, (USD Billion)
- Table 19.51 Global Single-use Upstream Bioprocessing Technology Market: Distribution by Scale of Operation, Conservative, Base and Optimistic Scenario, (USD Billion)
- Table 19.52 Global Single-use Upstream Bioprocessing Technology Market: Distribution by Type of Equipment, Conservative, Base and Optimistic Scenario, (USD Billion)
- Table 19.53 Global Single-use Upstream Bioprocessing Technology Market: Distribution by Geographical Region, Conservative, Base and Optimistic Scenario, (USD Billion)
- Table 19.54 Global Single-use Bioreactor Market, Conservative, Base and Optimistic Scenario, (USD Billion)
- Table 19.55 Global Single-use Bioreactor Market: Distribution by Type of Bioreactor, Conservative, Base and Optimistic Scenario, (USD Billion)
- Table 19.56 Global Single-use Bioreactor Market: Distribution by Scale of Operation, Conservative, Base and Optimistic Scenario, (USD Billion)
- Table 19.57 Global Single-use Bioreactor Market: Distribution by Type of Cell Culture, Conservative, Base and Optimistic Scenario, (USD Billion)
- Table 19.58 Global Single-use Bioreactor Market: Distribution by Type of Biologics Synthesized, Conservative, Base and Optimistic Scenario, (USD Billion)
- Table 19.59 Global single-use Bioreactor Market: Distribution by Application Area, Conservative, Base and Optimistic Scenario, (USD Billion)
- Table 19.60 Global single-use Bioreactor Market: Distribution by End-users, Conservative, Base and Optimistic Scenario, (USD Billion)
- Table 19.61 Global Single-use Bioreactor Market: Distribution by Geographical Region, Conservative, Base and Optimistic Scenario, (USD Billion)
- Table 19.62 Bioprocess Control Software: Distribution by Scale of Operation
- Table 19.63 Bioprocess Control Software: Distribution by Key Features
- Table 19.64 Bioprocess Control Software: Distribution by Compatibility with Systems
- Table 19.65 Bioprocess Control Software: Distribution by Type of Process Controlled
- Table 19.66 Bioprocess Control Software Manufacturers: Distribution by Year of Establishment
- Table 19.67 Bioprocess Control Software Manufacturers: Distribution by Company Size
- Table 19.68 Bioprocess Control Software Manufacturers: Distribution by Location of Headquarters
- Table 19.69 Upstream Controllers: Distribution by Scale of Operation
- Table 19.70 Upstream Controllers: Distribution by Key Features
- Table 19.71 Upstream Controllers: Distribution by Compatibility with Bioreactor systems
- Table 19.72 Upstream Controllers: Distribution by Type of Bioprocess
- Table 19.73 Upstream Controllers: Distribution by Type of Process Controlled
- Table 19.74 Upstream Controller Manufacturers: Distribution by Year of Establishment
- Table 19.75 Upstream Controller Manufacturers: Distribution by Company Size
- Table 19.76 Upstream Controller Manufacturers: Distribution by Location of Headquarters
- Table 19.77 Downstream Controller Systems: Distribution by Scale of Operation
- Table 19.78 Downstream Controller Systems: Distribution by Key Features
- Table 19.79 Downstream Controller Systems: Distribution by Type of System
- Table 19.80 Downstream Controller Systems: Distribution by Type of Bioprocess
- Table 19.81 Downstream Controller Systems: Distribution by Application Area
- Table 19.82 Downstream Controller System Manufacturers: Distribution by Year of Establishment
- Table 19.83 Downstream Controller System Manufacturers: Distribution by Company Size
- Table 19.84 Downstream Controller System Manufacturers: Distribution by Location of Headquarters
List of Figures
- Figure 2.1 Executive Summary: Current Market Landscape of Single-use Bioreactors
- Figure 2.2 Executive Summary: Partnerships and Collaborations
- Figure 2.3 Executive Summary: Patent Analysis
- Figure 2.4 Executive Summary: Market Forecast and Opportunity Analysis
- Figure 3.1 Historical Events related to the Development of Single-use Bioreactors
- Figure 3.2 Conventional Stainless-steel Bioreactors and Single-use Bioreactors: Energy Consumption (Mega Joules)
- Figure 3.3 Conventional Stainless-steel Bioreactors and Single-use Bioreactors: Water Consumption (Kilo Liters)
- Figure 3.4 Single-use Bioreactors: Type of Cell Culture Handled
- Figure 3.5 Advantages of Single-use Bioreactors
- Figure 3.6 Applications of Single-use Bioreactors
- Figure 4.1 Single-use Bioreactors: Distribution by Type of Bioreactor
- Figure 4.2 Single-use Bioreactors: Distribution by Scale of Operation
- Figure 4.3 Single-use Bioreactors: Distribution by Working Volume (Liters)
- Figure 4.4 Single-use Bioreactors: Distribution by Stirrer speed (RPM)
- Figure 4.5 Single-use Bioreactors: Distribution by Weight of Bioreactor (Kg)
- Figure 4.6 Single-use Bioreactors: Distribution by Advanced Display / Control Features
- Figure 4.7 Single-use Bioreactors: Distribution by Mode of Operation
- Figure 4.8 Single-use Bioreactors: Distribution by Type of Culture
- Figure 4.9 Single-use Bioreactors: Distribution by Type of Cell Culture
- Figure 4.10 Single-use Bioreactors: Distribution by Type of Biologics Synthesized
- Figure 4.11 Single-use Bioreactors: Distribution by End-users
- Figure 4.12 Single-use Bioreactor Manufacturers: Distribution by Year of Establishment
- Figure 4.13 Single-use Bioreactor Manufacturers: Distribution by Company Size
- Figure 4.14 Single-use Bioreactor Manufacturers: Distribution by Location of Headquarters (Region)
- Figure 4.15 Single-use Bioreactor Manufacturers: Distribution by Location of Headquarters (Country)
- Figure 4.16 Leading Manufacturers: Distribution by Number of Products
- Figure 5.1 Distribution by Company Size of Manufacturer and Type of Single-use Bioreactor
- Figure 5.2 Distribution by Type of Single-use Bioreactor and Mode of Operation
- Figure 5.3 Heat Map Representation: Distribution by Type of Single-use Bioreactor and Type of Biologics Synthesized
- Figure 5.4 Hybrid Chart: Distribution by Scale of Operation, Type of Cell Culture and Type of Biologics Synthesized
- Figure 5.5 Distribution by Company Size and Location of Headquarters
- Figure 5.6 World Map Representation: Distribution by Location of Headquarters
- Figure 6.1 Company Competitiveness Analysis: Small Companies
- Figure 6.2 Company Competitiveness Analysis: Mid-sized Companies
- Figure 6.3 Company Competitiveness Analysis: Large Companies
- Figure 7.1 Danaher (a parent company of Cytiva): Annual Revenues, Since 2022(USD Billion)
- Figure 7.2 Merck Millipore: Annual Revenues, 2017-2022 (EUR Billion)
- Figure 7.3 Danaher (a parent company of Pall Corporation): Annual Revenues, Since 2022(USD Billion)
- Figure 7.4 Thermo Fisher Scientific: Annual Revenues, FY 2017-FY 2022 (USD Billion)
- Figure 8.1 Eppendorf: Annual Revenues, FY 2018-FY 2022 (EUR Million)
- Figure 8.2 Sartorius Stedim Biotech: Annual Revenues, 2018-Q1 2023 (EUR Million)
- Figure 9.1 Partnerships and Collaborations: Cumulative Year-Wise Trend
- Figure 9.2 Partnerships and Collaborations: Distribution by Type of Partnership
- Figure 9.3 Partnerships and Collaborations: Distribution by Year and Type of Partnership
- Figure 9.4 Partnerships and Collaborations: Distribution by Focus Area
- Figure 9.5 Partnerships and Collaborations: Distribution by Year of Partnership and Focus Area
- Figure 9.6 Partnerships and Collaborations: Distribution by Type of Partner
- Figure 9.7 Partnerships and Collaborations: Distribution by Type of Biologics Synthesized
- Figure 9.8 Partnerships and Collaborations: Distribution by Type of Bioreactor Involved
- Figure 9.9 Partnerships and Collaborations: Distribution by Location of Facility (Country) and Expanded Bioreactor Capacity
- Figure 9.10 Most Active Players: Distribution by Number of Partnerships
- Figure 9.11 Partnerships and Collaborations: Local and International Agreements
- Figure 9.12 Partnerships and Collaborations: Intracontinental and Intercontinental Agreements
- Figure 10.1 Product Competitiveness Analysis: Stirred Tank Single-use Bioreactors Offered by Players in North America
- Figure 10.2 Product Competitiveness Analysis: Stirred Tank Single-use Bioreactors Offered by Players in Europe
- Figure 10.3 Product Competitiveness Analysis: Stirred Tank Single-use Bioreactors Offered by Players in Asia-Pacific and Rest of the World
- Figure 10.4 Product Competitiveness Analysis: Fixed-Bed Single-use Bioreactors
- Figure 10.5 Product Competitiveness Analysis: Wave-Induced / Rocking Single-use Bioreactors
- Figure 10.6 Product Competitiveness Analysis: Other Types of Single-use Bioreactors Offered by Players in North America
- Figure 10.7 Product Competitiveness Analysis: Other Types of Single-use Bioreactors Offered by Players in Europe
- Figure 10.8 Product Competitiveness Analysis: Other Types of Single-use Bioreactors Offered by Players in Asia-Pacific and Rest of the World
- Figure 11.1 Brand Positioning Analysis: Competitive Advantage
- Figure 11.2 Brand Positioning Analysis: Reasons to Believe
- Figure 11.3 Brand Positioning Matrix: Pall Corporation
- Figure 11.4 Brand Positioning Matrix: Biolinx Labsystems
- Figure 11.5 Brand Positioning Matrix: Eppendorf
- Figure 11.6 Brand Positioning Matrix: Solaris Biotech
- Figure 11.7 Brand Positioning Matrix: Sartorius Stedim Biotech
- Figure 11.8 Brand Positioning Matrix: Applikon Biotechnology
- Figure 11.9 Brand Positioning Matrix: Cercell
- Figure 12.1 Patent Analysis: Distribution by Type of Patent
- Figure 12.2 Patent Analysis: Cumulative Year-wise Trend by Application Year, Since Pre-2015
- Figure 12.3 Patent Analysis: Cumulative Year-wise Trend by Publication Year, Since Pre-2015
- Figure 12.4 Patent Analysis: Distribution of Type of Patents and Publication Year, Pre-2015-2023
- Figure 12.5 Patent Analysis: Distribution by Patent Jurisdiction
- Figure 12.6 Patent Analysis: Distribution by CPC Symbols and Sections
- Figure 12.7 Patent Analysis: Cumulative Year-wise Distribution by Type of Applicant
- Figure 12.8 Leading Industry Players: Distribution by Number of Patents
- Figure 12.9 Leading Patent Assignees: Distribution by Number of Patents
- Figure 12.10 Patent Benchmarking Analysis: Distribution of Top Nine Industry Players by CPC Codes
- Figure 12.11 Patent Analysis: Distribution by Patent Age
- Figure 12.12 Single-use Bioreactors: Patent Valuation
- Figure 13.1 Global Single-use Upstream Bioprocessing Technology Market, (USD Billion)
- Figure 13.2 Global Single-use Upstream Bioprocessing Technology Market: Distribution by Scale of Operation, (USD Billion)
- Figure 13.3 Global Single-use Upstream Bioprocessing Technology Market: Distribution by Type of Equipment, (USD Billion)
- Figure 13.4 Global Single-use Upstream Bioprocessing Technology Market: Distribution by Geographical Region, (USD Billion)
- Figure 13.5 Global Single-use Bioreactors Market, (USD Billion)
- Figure 13.6 Global Single-use Bioreactors Market: Distribution by Type of Bioreactor, (USD Billion)
- Figure 13.7 Global Single-use Bioreactors Market: Distribution by Scale of Operation, (USD Billion)
- Figure 13.8 Global Single-use Bioreactors Market: Distribution by Type of Cell Culture, (USD Billion)
- Figure 13.9 Global Single-use Bioreactors Market: Distribution by Type of Biologics Synthesized, (USD Billion)
- Figure 13.10 Global single-use Bioreactors Market: Distribution by Application Area, (USD Billion)
- Figure 13.11 Global single-use Bioreactors Market: Distribution by End-users, (USD Billion)
- Figure 13.12 Global Single-use Bioreactors Market: Distribution by Geographical Region, (USD Billion)
- Figure 14.1 Single-use Bioreactors Market: SWOT Analysis
- Figure 14.2 Comparison of SWOT Factors: Harvey Ball Analysis
- Figure 16.1 Bioprocess Control Software: Distribution by Scale of Operation
- Figure 16.2 Bioprocess Control Software: Distribution by Key Features
- Figure 16.3 Bioprocess Control Software: Distribution by Compatibility with System
- Figure 16.4 Bioprocess Control Software: Distribution by Type of Process Controlled
- Figure 16.5 Bioprocess Control Software Manufacturers: Distribution by Year of Establishment
- Figure 16.6 Bioprocess Control Software Manufacturers: Distribution by Company Size
- Figure 16.7 Bioprocess Control Software Manufacturers: Distribution by Location of Headquarters
- Figure 16.8 Upstream Controllers: Distribution by Scale of Operation
- Figure 16.9 Upstream Controllers: Distribution by Key Features
- Figure 16.10 Upstream Controllers: Distribution by Compatibility with Bioreactor systems
- Figure 16.11 Upstream Controllers: Distribution by Type of Bioprocess
- Figure 16.12 Upstream Controllers: Distribution by Type of Process Controlled
- Figure 16.13 Upstream Controller Manufacturers: Distribution by Year of Establishment
- Figure 16.14 Upstream Controller Manufacturers: Distribution by Company Size
- Figure 16.15 Upstream Controller Manufacturers: Distribution by Location of Headquarters
- Figure 16.16 Downstream Controller Systems: Distribution by Scale of Operation
- Figure 16.17 Downstream Controller Systems: Distribution by Key Features
- Figure 16.18 Downstream Controller Systems: Distribution by Type of System
- Figure 16.19 Downstream Controller Systems: Distribution by Type of Bioprocess
- Figure 16.20 Downstream Controller Systems: Distribution by Application Area
- Figure 16.21 Downstream Controller System Manufacturers: Distribution by Year of Establishment
- Figure 16.22 Downstream Controller System Manufacturers: Distribution by Company Size
- Figure 16.23 Downstream Controller System Manufacturers: Distribution by Location of Headquarters
- Figure 17.1 Concluding Remarks: Current Market Landscape of Single-use Bioreactors
- Figure 17.2 Concluding Remarks: Partnerships and Collaborations
- Figure 17.3 Concluding Remarks: Patent Analysis
- Figure 17.4 Concluding Remarks: Market Forecast and Opportunity Analysis

